copenhagen - EcoRegion
copenhagen - EcoRegion
copenhagen - EcoRegion

You also want an ePaper? Increase the reach of your titles
YUMPU automatically turns print PDFs into web optimized ePapers that Google loves.
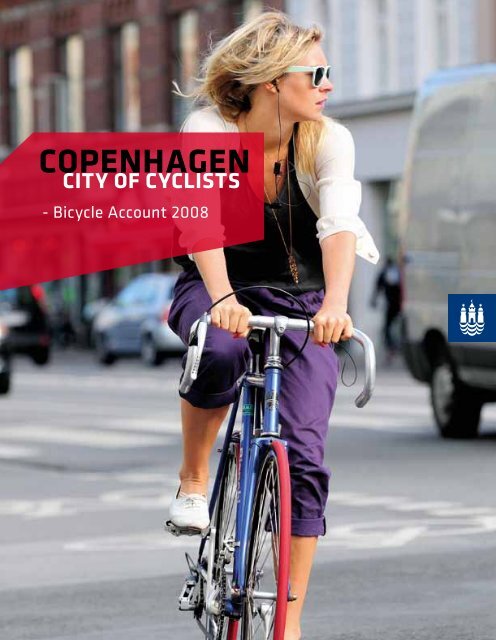
<strong>copenhagen</strong><br />
city of cyclists<br />
- Bicycle Account 2008
FOREWORD<br />
2<br />
In Copenhagen our goal is clear, we aim to become the world’s best city for cyclists. This<br />
means we should not be afraid to give cycling top political priority and we must be prepared<br />
to back it up with investments targeted to promote cycling as a means of transport.<br />
Every single day 55% of Copenhagen residents choose to cycle, which means that every<br />
day there are between 20,000 and 30,000 cyclists travelling on each of the major Copenhagen<br />
thoroughfares.<br />
Last year the equivalent of twice the entire population of Denmark have crossed Dronning<br />
Louise’s Bridge at the lakes: over 10 million cyclists have taken the trip over the bridge<br />
and then continued on through town.<br />
This is a clear indication that the bicycle is Copenhageners’ transport of choice. As a city<br />
we are highly pleased about this. A bicycle is quiet, non-polluting, takes up very little<br />
space and in addition cycling offers numerous health benefits. For all these reasons it is<br />
obvious that we should continue to invest in improving cycling conditions and finding new<br />
ways of catering to cycling needs.<br />
The Bicycle Account is a vital tool for success in our ongoing development of Copenhagen<br />
as a bicycle-friendly city. The Account gives an overview of how far we have come in<br />
meeting our objectives, what new measures need to be taken, and last but not least it<br />
provides us with valuable insight into the most important thing of all, namely what the<br />
cyclists of Copenhagen really think.<br />
It’s all those Copenhageners who choose to cycle every day that are going to make Copenhagen<br />
the world’s best city for cyclists by 2015. The Bicycle Account is a valuable tool for<br />
achieving that goal.<br />
Bo Asmus Kjeldgaard<br />
Mayor, Technical and Environmental Administration<br />
City of Copenhagen<br />
What is the<br />
Bicycle Account <br />
The Bicycle Account is<br />
an assessment of cycling<br />
development in the City of<br />
Copenhagen. The Account<br />
consequently deals with<br />
city cycling conditions, new<br />
initiatives as well as the way<br />
in which the Copenhageners<br />
themselves perceive cycling<br />
facilities.<br />
The Bicycle Account is published<br />
bi-annually. This year’s<br />
Bicycle Account is based on<br />
2008 statistics and includes<br />
telephone interviews with 1,025<br />
randomly selected Copenhagen<br />
residents as well as data from the<br />
DTU Transport Survey of Transport<br />
Behaviour. The Bicycle Account<br />
2008 is the eighth of its kind. The<br />
Bicycle Account is aimed at Copenhagen<br />
residents, among others, who,<br />
hopefully, will be able to make use<br />
of it as a source of inspiration. For<br />
the City of Copenhagen the Bicycle<br />
Account is a vital planning tool in the<br />
work of making Copenhagen an even<br />
better city for cyclists.<br />
You can find further analyses and figures<br />
relating to Copenhagen cycling at<br />
www.kk.dk/cityofcyclists.
What do<br />
Copenhagen cyclists<br />
think<br />
1996 1998 2000 2002 2004 2006 2008<br />
CPH as a city for cyclists<br />
7 8 8 8 8 8 9<br />
Cyclist sense of safety<br />
Amount of cycle tracks<br />
Cycle track width<br />
Condition of cycle tracks<br />
Condition of roads<br />
Bicycle parking generally<br />
Combining cycling and<br />
public transport<br />
6 6 6 6 6 5 5<br />
6 6 7 6 6 6 6<br />
7 7 6 5 5 5 4<br />
5 5 4 5 5 5 5<br />
2 3 2 3 3 3 3<br />
4 3 4 3<br />
5 4 5 5 5<br />
3 3 3<br />
6 5<br />
Copenhagen cyclists are asked how they rate various cycling conditions<br />
in Copenhagen. Their ratings are then converted into a point system<br />
depicted graphically as red bicycles – the more bicycles, the better the<br />
rating. A rating of 10% satisfied cyclists is depicted as one red bicycle.<br />
The top rating is 10 red bicycles.<br />
A Copenhagen cyclist is defined in the survey as either a person for<br />
whom the bicycle is the preferred mode of transport or a person who<br />
uses a bicycle a minimum of once a week. 723 out of the 1025 interviewees<br />
are thus designated as cyclists in the survey.<br />
Copenhagen<br />
Copenhagen cyclists’ assessment of<br />
cycling facilities in Copenhagen is fairly<br />
similar to their attitude the last time we<br />
asked in 2006. However, there are three<br />
points where the ratings diverge, in both<br />
a positive and a negative direction.<br />
On the positive side the general rating<br />
for Copenhagen as a bicycle-friendly city<br />
has risen from eight to nine bicycles.<br />
This may be taken as an indication that<br />
Copenhageners appreciate the cycling<br />
investments of recent years.<br />
Cycle tracks<br />
On the negative side there has been a<br />
drop in cyclist satisfaction with cycle<br />
track width from five to four bicycles. The<br />
survey gives no concrete indication as to<br />
the cause of the drop. An obvious guess,<br />
however, is that the general growth in<br />
bicycle traffic and particularly the rise in<br />
the number of cargo bikes has resulted in<br />
increased congestion on the Copenhagen<br />
cycle tracks. Hence the decline in satisfaction<br />
needs not be viewed as solely<br />
negative, although the issue of cycle<br />
track congestion presents an interesting<br />
challenge for Copenhagen city planners!<br />
Taking your bike on the train<br />
Satisfaction with combining cycling and<br />
public transport has dropped from six<br />
to five bicycles and is thus down to the<br />
2004 level. The bicycle-train combination<br />
has a high potential as an alternative to<br />
private cars and the City of Copenhagen<br />
consequently wishes to continue the dialogue<br />
with DSB (Danish Railways) and the<br />
Metro on improving ways of combining<br />
cycling with train transport.<br />
4
target goals and<br />
target figures<br />
ECO-METROPOLIS<br />
Percentage that cycle to<br />
work or education (%)<br />
Seriously injured cyclists<br />
(number per year)<br />
Percentage of cyclists<br />
that feel safe (%)<br />
1996 1998 2000 2002 2004 2006 2008<br />
30 30 34 32 36 36 37<br />
252 173 146 152 124 92 121<br />
60 58 57 56 58 53 51<br />
OTHER KEY FIGURES<br />
Cycled kilometres<br />
(mio./km per weekday) 0.93 0.92 1.05 1.11 1.13 1.15 1.17<br />
Cycled km between serious<br />
casualties (mio./km) 1.2 1.8 2.4 2.4 3.0 4.2 3.2<br />
Cycling speed<br />
(km/h)<br />
15.3 16.0 16.2<br />
Cycle tracks (km)<br />
Cycle lanes (km)<br />
Green cycle routes (km)<br />
Bicycle parking spaces on<br />
roads and pavements (1000)<br />
294 302 307 323 329 332 338<br />
6 10 12 14 17 18<br />
29 30 31 32 37 39 41<br />
29.5 34.8<br />
The table on page 6 provides an overview of developments within key cycling parameters in Copenhagen.<br />
The first three categories relate to the political objectives for 2015 set forth in the City<br />
of Copenhagen’s environmental policy, Eco-Metropolis – Our Vision for Copenhagen 2015.<br />
Work and education<br />
In 2008 37% of everyone working or<br />
studying in Copenhagen chose to bike to<br />
their place of work or education. This is<br />
a slight improvement in relation to 2006<br />
when the figure was 36% but there is still<br />
a long way to go before reaching the target<br />
figure set by the City of Copenhagen of<br />
50% by 2015.<br />
In a larger perspective, however, this is an<br />
impressive advance. According to Statistics<br />
Denmark the number of cycled kilometres<br />
in Denmark as a whole has dropped by<br />
approx. 23% over the course of the past 15<br />
years. In comparison the number of cycled<br />
kilometres in Copenhagen in the period<br />
1996-2008 alone rose by 26% so that today<br />
1,170,000 kilometres are cycled daily.<br />
Cyclist casualties<br />
The number of serious accidents involving<br />
cyclists has been significantly reduced over<br />
the past 10 years. That trend has been reversed,<br />
however, in the past two years. The<br />
number of seriously injured cyclists in 2008<br />
was 121. The target objective for 2015 is to<br />
have reduced that number to maximum<br />
59, which amounts to half the number of<br />
cyclists who were seriously injured in 2005.<br />
The City has drawn up a plan for bicycle safety<br />
in traffic and is constantly improving<br />
dangerous intersections and road sections.<br />
However, the figures indicate that more<br />
attention to traffic safety is required if the<br />
objective is to be achieved.<br />
Feeling safe in traffic<br />
The 2006 tendency continues towards a<br />
slight drop in Copenhagen cyclists’ sense<br />
of safety. In 2008 51% of Copenhagen cyclists<br />
felt safe in traffic. If 80% of cyclists<br />
are to feel safe by 2015 we will have to step<br />
up our efforts significantly.<br />
The three objectives for 2015<br />
– At least 50% will go to their place of work or education by bike.<br />
– The number of killed and seriously injured Copenhagen cyclists will be reduced<br />
by more than 50% compared to 2005.<br />
– At least 80% of Copenhagen cyclists will feel safe in traffic.<br />
7
cycling<br />
cycling to<br />
work or education<br />
- statistics and perspectives<br />
Transport mode going to work or education in Copenhagen (journeys):<br />
37%<br />
walking 4%<br />
31%<br />
car<br />
28%<br />
bus and<br />
train<br />
Those who cycle solely to and from a station<br />
are registered under ”Bus and train”.<br />
55,000 more…<br />
37% of everyone working or studying<br />
in Copenhagen cycles to their place of<br />
work or education in the city. That figure<br />
includes Copenhagen residents as well<br />
as people from other municipalities who<br />
work or study in Copenhagen. In other<br />
words around 150,000 people cycle to<br />
work or school in Copenhagen every<br />
morning. If we are to achieve the political<br />
objective that by 2015 50% will cycle to<br />
their place of work or education in Copenhagen,<br />
this means in absolute numbers<br />
that 55,000 more people than today will<br />
have to take their bikes to work or education<br />
in the morning.<br />
If we limit ourselves to Copenhagen<br />
residents working or studying in the city,<br />
the cycling share of transport is 55%.<br />
Copenhagen residents are generally more<br />
inclined to cycle than residents of the<br />
neighbouring suburbs regardless of the<br />
distance to their workplaces.<br />
Workplaces<br />
The workplaces registering the highest<br />
number of cycle journeys into the City of<br />
Copenhagen are the two hospitals, Rigshospitalet<br />
and Bispebjerg Hospital. This<br />
is naturally bound up with the size of the<br />
workplace. In addition, people working<br />
within the public administration, education<br />
and health care sector are the group<br />
that cycles most - 45%. For purposes of<br />
comparison, 27% of employees in the<br />
trade, hotel and restaurant sector cycles<br />
to and from work.<br />
New initiatives<br />
If we are to achieve our objective that<br />
50% will cycle to their place of work or<br />
education in Copenhagen by 2015 then<br />
we must continue to improve the bicycle<br />
infrastructure and develop campaigns<br />
and promote urban development in ways<br />
that consistently incorporate and give<br />
high priority to cycling. Both Copenhagen<br />
cyclists and non-cyclists emphasize that<br />
the prime motivation for more cycling<br />
would be more and wider cycle tracks<br />
and fewer cars. Another prerequisite for<br />
achieving the objective is the reduction<br />
of motor traffic by road pricing. The legal<br />
procedures for introducing road pricing,<br />
however, are not as yet in place.<br />
9
safety<br />
- statistics and perspectives<br />
More cyclists, more safety!<br />
It is safer to cycle in Copenhagen than<br />
in most other big cities. There are two<br />
reasons for this: In the first place the<br />
infrastructure is adapted to accommodate<br />
cyclists, including such facilities as an<br />
extensive cycle track network and bicyclefriendly<br />
intersections. Secondly, the large<br />
number of cyclists in Copenhagen means<br />
that the city’s other road users are used<br />
to cyclists on the street scene and show<br />
them consideration.<br />
The work continues<br />
The City of Copenhagen is constantly working<br />
to improve traffic safety by means of<br />
physical redesign of intersections and road<br />
sections. One of the projects in 2008 was<br />
continuing the redesign of the large accident-causing<br />
junction where H.C. Andersens<br />
Boulevard intersects with Farimagsgade<br />
and Jarmers Plads. At the same time the<br />
speed limit on H.C. Andersens Boulevard<br />
was reduced from 60 to 50 km an hour.<br />
The City of Copenhagen initiated a major<br />
project in 2008 focusing on preventing<br />
right-turn accidents involving collisions<br />
between lorries and cyclists. Heavy goods<br />
vehicle traffic has been forbidden on Vester<br />
Voldgade and further measures will be<br />
implemented in the coming year.<br />
Vulnerable road users<br />
Taken as a whole, vulnerable road users<br />
– cyclists, pedestrians and moped users –<br />
constitute 74% of those killed or seriously<br />
injured in Copenhagen traffic. In 2008 there<br />
were 121 serious accidents involving cyclists<br />
while the figures for pedestrians and<br />
moped users were 66 and 34, respectively.<br />
Of the 121 serious cyclist casualties in 2008<br />
five were fatal. In four of these cases death<br />
occurred in connection with right-turning<br />
lorries.<br />
As mentioned above, the general trend<br />
taken over an extended period of time is<br />
going in the right direction. It should be<br />
noted that in 1996 there were 252 seriously<br />
injured cyclists in Copenhagen traffic.<br />
However, within the past two years there<br />
has been a rise in the number of serious<br />
cyclist casualties.<br />
Facts about accidents in <strong>copenhagen</strong><br />
Today there is one serious accident for every 3.2 million cycled kilometres in Copenhagen. For purposes<br />
of comparison the equivalent figure for 1996 was one accident per 1.2 million cycled kilometres.<br />
In other words the risk a cyclist runs of being involved in a serious accident has been reduced by<br />
65% in the period 1996-2008.<br />
sense of safety<br />
- statistics and perspectives<br />
Safety vs. sense of safety<br />
51% of Copenhagen residents feel safe<br />
when cycling in Copenhagen, 36% feel<br />
partially safe and 13% respond negatively<br />
when asked whether they feel safe<br />
cycling in town.<br />
The complex issue of Copenhagen<br />
cyclists’ sense of safety in traffic is difficult<br />
to measure as well as to change.<br />
Many factors may have an impact on the<br />
result of the survey measurements. For<br />
instance, it is conceivable that massive<br />
media coverage of a serious right-turn<br />
accident might have as great an impact<br />
on the individual cyclist’s perception of<br />
safety as the cyclist’s own experiences on<br />
his or her daily cycle journey. In any case<br />
the fact remains that cycling in Copenhagen<br />
has become statistically safer while<br />
at the same time the sense of safety has<br />
declined.<br />
Increased cycle track congestion<br />
Another interesting point is that when<br />
asked what single factor would make<br />
them feel safer as cyclists almost as<br />
many Copenhageners want the cycle<br />
tracks to be wider as want more cycle<br />
tracks. This may be regarded as a natural<br />
consequence of the growth in bicycle<br />
traffic and the resultant increase in cycle<br />
track congestion.<br />
Although the interviewed cyclists do<br />
relate to the concept of feeling safe, the<br />
survey measurements are by no means<br />
exhaustive in relation to how the individual<br />
cyclist perceives the term “sense<br />
of safety”. The City of Copenhagen is<br />
consequently focusing on obtaining more<br />
information about Copenhageners’ sense<br />
of safety.<br />
Why people feel unsafe<br />
When questioned directly the group of Copenhageners<br />
who do not feel safe in traffic gave the following<br />
reasons for their sense of feeling unsafe:<br />
58% feel unsafe because of cars.<br />
43% feel unsafe because of other cyclists.<br />
17% feel unsafe because of buses.<br />
why people feel safe<br />
When questioned directly the group of Copenhageners who do<br />
not feel safe in traffic stated that the following factors might<br />
make them feel safer:<br />
37% would feel safer if there were more cycle tracks.<br />
36% would feel safer if cycle tracks were wider.<br />
14% would feel safer if intersections were more bicycle-friendly.<br />
11
where there’s will<br />
there’s a way<br />
Åbuen<br />
Since the last Bicycle Account the City of<br />
Copenhagen has invested in improving<br />
conditions for the city’s cyclists. The idea<br />
behind all such investments is to help<br />
create a safer, less stressful and more<br />
efficient city for cyclists.<br />
One of the most obvious examples of<br />
an investment that enhances safety<br />
and passability and also makes city<br />
cyclists feel safer is the Åbuen bridge for<br />
pedestrians and cyclists. The bridge was<br />
inaugurated in June 2008 and forms a<br />
link between the neighbouring municipalities<br />
of Copenhagen and Frederiksberg<br />
over the highly congested thoroughfare,<br />
Ågade. By the end of the first week more<br />
than 1,700 cyclists had already used the<br />
bridge in the daytime and three months<br />
later the figure had risen to over 3,000<br />
cyclists.<br />
Green waves<br />
Copenhagen traffic lights were formerly<br />
largely synchronized for the benefit of<br />
cars and buses. Now the traffic lights<br />
along several of the city’s major traffic<br />
arteries are set so that Copenhagen<br />
cyclists maintaining an average traveling<br />
speed of 20 km an hour can ride through<br />
traffic without putting a foot down. The<br />
Green Waves for cyclists are an excellent<br />
example of cheap and effective measures<br />
made possible because the municipal<br />
authorities have given special priority<br />
to cycle traffic. The Green Waves are in<br />
force today on Nørrebrogade and sections<br />
of Amagerbrogade, Østerbrogade and<br />
Farimagsgade.<br />
Cyclists enter the intersection first<br />
Another initiative of recent years has<br />
been to rethink a number of the Copenhagen<br />
traffic signal intersections in order<br />
to better accommodate cyclists. One<br />
example is the introduction of advanced<br />
stop lines for cyclists with the general<br />
stop line for cars five metres back from<br />
the main traffic signal at 117 Copenhagen<br />
intersections. Cyclists are thereby<br />
clearly in view and are well into<br />
the intersection before the cars<br />
start their right-turn.<br />
Among other initiatives new cycle<br />
tracks have been established on<br />
Nørre Voldgade, Folke Bernadottes<br />
Allé and Hillerødgade.<br />
PILOT PROJECT ON<br />
NØRREBROGADE<br />
If we want the city to continue to be<br />
sustainable and dynamic and traffic<br />
movement to remain efficient in the<br />
future then we will occasionally have<br />
to enter new territory. One example of<br />
this is the pilot project on Nørrebrogade<br />
which was introduced in the autumn of<br />
2008. The purpose of the pilot project<br />
is to redesign Nørrebrogade to accommodate<br />
the environment and the people<br />
using the street. The project provides<br />
more space for pedestrians, cyclists and<br />
bus passengers. This is why there is no<br />
through car traffic on Nørrebrogade.<br />
Before the pilot project was initiated a<br />
typical 24 hour day of traffic on<br />
Nørrebrogade looked something like this:<br />
• 33,000 cyclists.<br />
• 40,000 bus passengers.<br />
• 22,000 persons in cars.<br />
• Many thousands of pedestrians.<br />
The figures for November 2008 show that<br />
bicycle traffic had increased by 15% compared to<br />
traffic on Nørrebrogade in November 2007. This<br />
indicates that already in its early phases the pilot<br />
project was instrumental in causing significantly<br />
more people to cycle along Nørrebrogade.<br />
13
The cargo bike<br />
- a new player<br />
in<br />
the field<br />
More cargo bikes on the street scene<br />
A cycle journey in the Copenhagen<br />
morning traffic proves it. A brief stop in<br />
front of a day nursery proves it. And City<br />
statistics prove it. The cargo bike has become<br />
a well established transport mode<br />
in Copenhagen. The concept of cargo bike<br />
here covers both freight bicycles and<br />
cargo trailers. The City of Copenhagen<br />
has not previously carried out systematic<br />
measurements of the extent to which<br />
cargo bikes are used. The present Bicycle<br />
Account will serve as a springboard for<br />
keeping abreast of future cargo bike<br />
developments in Copenhagen traffic.<br />
An alternative to cars<br />
In 2008 6% of all Copenhagen households<br />
had a cargo bike. Of these 22%<br />
use their cargo bike as a car replacement<br />
while 24% state that they use a cargo<br />
bike in addition to a car. These figures indicate<br />
that many of the journeys carried<br />
out by cargo bike replace car journeys.<br />
Of those who have a cargo bike 40%<br />
state that they use the cargo bike to<br />
transport goods. 50% say that they<br />
use the cargo bike to carry children.<br />
Not surprisingly the cargo bike is more<br />
widespread among families with children<br />
than among other social groups. As many<br />
as 25% of Copenhagen families with two<br />
children have a cargo bike.<br />
New challenges<br />
For all these reasons it makes a lot of<br />
sense to give serious consideration to<br />
cargo bike issues in the future when<br />
working to create a climate-friendly,<br />
dynamic metropolis with efficient traffic<br />
movement. One of the major challenges<br />
in this context is dealing with the increased<br />
level of congestion on the Copenhagen<br />
cycle tracks. Another increasing<br />
challenge is how to incorporate good<br />
parking facilities for cargo bikes into<br />
urban planning.<br />
The Bicycle Account figures indicate that<br />
the cargo bike is generally accepted in<br />
the streets of Copenhagen. Although<br />
dissatisfaction with cycle track width<br />
has increased somewhat since 2006, only<br />
2% of Copenhagen cyclists feel seriously<br />
annoyed by the cargo bikes.<br />
14<br />
”25% of all families with two<br />
children in <strong>copenhagen</strong> have a<br />
cargo bike”.
where can i hitch up<br />
my horse<br />
- Bicycle parking in <strong>copenhagen</strong><br />
bicycle parking<br />
– 4,000 new rack spaces distributed over 100 different locations in Copenhagen.<br />
– 1,000 mobile rack spaces for use at concerts and other major events.<br />
– 8,000 abandoned bicycles removed.<br />
16<br />
More bicycles than inhabitants<br />
Copenhagen residents own 560,000<br />
bicycles while the city has a population<br />
of 519,000. Add to this all the abandoned<br />
bicycles that have taken up residence in<br />
public spaces as well as the bicycles of<br />
non-resident commuters who, returning<br />
home, leave their bicycles to enjoy the<br />
hospitality of the city stations at night.<br />
It’s an excellent sign that there are so<br />
many bicycles in Copenhagen. However,<br />
this places great demands on the city’s<br />
parking facilities. If bicycle parking<br />
facilities are not up to standard this has<br />
at least two consequences: First of all,<br />
it makes life more difficult for people<br />
cycling in town. Second, bicycles are<br />
plunked down all over at random – to<br />
the annoyance of pedestrians and other<br />
users of public spaces.<br />
New bicycle parking spaces<br />
Over the course of the past couple of<br />
years the City of Copenhagen has focused<br />
intensely on establishing more and<br />
better parking facilities for Copenhagen<br />
cyclists. In 2006 there were 29,500 public<br />
bicycle parking spaces in Copenhagen.<br />
In 2008 alone the city established about<br />
5,000 new bicycle parking spaces so the<br />
figure today is now 34,800 including<br />
1,000 mobile rack spaces. This is an<br />
increase of 18% in the total number of<br />
public bicycle parking spaces.<br />
The Cycle Vulture is coming!<br />
A number of abandoned bicycles have<br />
taken up permanent residence in the<br />
Copenhagen bicycle racks. One way of<br />
creating more space is to remove the<br />
unused bicycles so as to make room for<br />
the ones in use. This method is also<br />
known as the “vulture method” since the<br />
city swoops down on the carcasses of<br />
the city’s bicycles. In 2008 alone 8,000<br />
abandoned bicycles were removed in<br />
Copenhagen.<br />
New construction = New bicycle parking<br />
The Proposal for the City of Copenhagen’s Municipal Plan for 2009 emphasizes the need for incorporating<br />
bicycle parking facilities into all new city construction.<br />
• Home: 2.5 bicycle parking spaces per 100 m 2 living area (or alternatively per residence).<br />
• Workplace: 1.5 bicycle parking spaces per 100 m 2 office space.<br />
• Shop: 3 bicycle parking spaces per 100 m 2 shop + 0.5 bicycle parking space per employee.<br />
• Home and shop: 1 bicycle parking space for oversize bicycle per 1,000 m 2 .<br />
17
cycling<br />
and its socioeconomic<br />
benefits<br />
Advantages and disadvantages<br />
A cost-benefit analysis often forms the<br />
basis for political decision making prior<br />
to traffic investments. Cost-benefit<br />
analyses involve assigning a monetary<br />
value to the advantages and disadvantages<br />
of a construction project. This<br />
makes it possible to weigh the benefits<br />
(e.g. reduced travel times and reduced<br />
pollution) against the disadvantages (e.g.<br />
construction costs and noise).<br />
Cycle projects<br />
The Danish Ministry of Transport has<br />
a manual for calculating cost-benefit.<br />
However, the manual does not include<br />
a method for assessing cycle projects.<br />
This is hardly viable when over one third<br />
of the population of the nation’s capital<br />
arrive at their place of work or education<br />
by bicycle. The City of Copenhagen has<br />
therefore had a cycling assessment procedure<br />
devised based on the principles<br />
set forth in the manual. The City of<br />
Copenhagen will use the procedure when<br />
assessing coming major cycle projects.<br />
In addition key cycling figures have<br />
been made available to the Ministry of<br />
Transport. This is the first step towards<br />
developing a method for cycle project<br />
analysis to be used in the Ministry’s<br />
existent cost-benefit manual.<br />
Sound investments<br />
The new method has so far been tested at<br />
two concrete cycle projects in the City of<br />
Copenhagen: Bryggebroen, a cyclist/pedestrian<br />
bridge across the harbour, and the<br />
reconstruction of the Gyldenløvesgade/<br />
Søgade intersection. In both cases the<br />
conclusion is clear: From a cost-benefit<br />
point of view the investments are particularly<br />
sound, giving an equivalent or better<br />
rate of return than current road construction<br />
projects such as the widening of<br />
the motorway around Roskilde or a new<br />
motorway near Silkeborg.<br />
18<br />
Cycling figures in hard cash<br />
– When a person chooses to cycle this is a clear gain for society of DKK 1.22 per cycled<br />
kilometre. Conversely, society suffers a net loss of DKK 0.69 per kilometre driven by car.<br />
– In cost-benefit terms the health and life expectancy benefits of cycling are seven times<br />
greater than the accident costs.<br />
– The cost of a bicycle is 33 øre per cycled kilometre covering purchase price and<br />
maintenance. The equivalent cost for a car is DKK 2.20 per driven kilometre.<br />
CYCLING AND HEALTH<br />
• Children that cycle to school are<br />
almost 10% more physically fit<br />
than their classmates who walk or<br />
are driven by their parents.<br />
• Adults that cycle to work or use a<br />
bicycle on an everyday basis have a<br />
30% lower mortality rate than others<br />
who resemble them in all other areas.
Published in June 2010<br />
City of Copenhagen<br />
The Technical and Environmental<br />
Administration,<br />
Traffic Department<br />
Photos: Troels Heien<br />
Graphics and layout: Monoline<br />
www.kk.dk/cityofcyclists