A Web-based Spatial DSS for estimating biomass-to- energy supply ...
A Web-based Spatial DSS for estimating biomass-to- energy supply ...
A Web-based Spatial DSS for estimating biomass-to- energy supply ...

You also want an ePaper? Increase the reach of your titles
YUMPU automatically turns print PDFs into web optimized ePapers that Google loves.
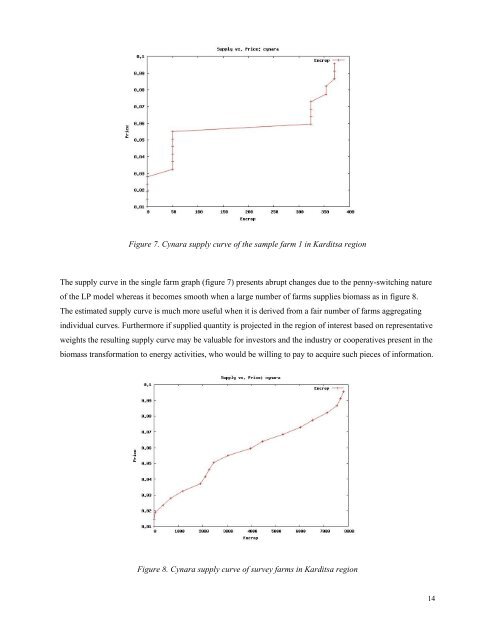
Figure 7. Cynara <strong>supply</strong> curve of the sample farm 1 in Karditsa region<br />
The <strong>supply</strong> curve in the single farm graph (figure 7) presents abrupt changes due <strong>to</strong> the penny-switching nature<br />
of the LP model whereas it becomes smooth when a large number of farms supplies <strong>biomass</strong> as in figure 8.<br />
The estimated <strong>supply</strong> curve is much more useful when it is derived from a fair number of farms aggregating<br />
individual curves. Furthermore if supplied quantity is projected in the region of interest <strong>based</strong> on representative<br />
weights the resulting <strong>supply</strong> curve may be valuable <strong>for</strong> inves<strong>to</strong>rs and the industry or cooperatives present in the<br />
<strong>biomass</strong> trans<strong>for</strong>mation <strong>to</strong> <strong>energy</strong> activities, who would be willing <strong>to</strong> pay <strong>to</strong> acquire such pieces of in<strong>for</strong>mation.<br />
Figure 8. Cynara <strong>supply</strong> curve of survey farms in Karditsa region<br />
14