The Effect of Learning and Fatigue on Preferences and WTP in a ...
The Effect of Learning and Fatigue on Preferences and WTP in a ...
The Effect of Learning and Fatigue on Preferences and WTP in a ...

Create successful ePaper yourself
Turn your PDF publications into a flip-book with our unique Google optimized e-Paper software.
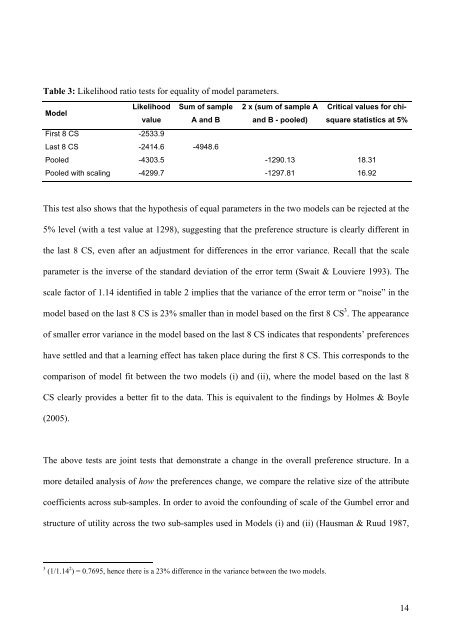
Table 3: Likelihood ratio tests for equality <str<strong>on</strong>g>of</str<strong>on</strong>g> model parameters.<br />
Model<br />
Likelihood Sum <str<strong>on</strong>g>of</str<strong>on</strong>g> sample 2 x (sum <str<strong>on</strong>g>of</str<strong>on</strong>g> sample A Critical values for chisquare<br />
statistics at 5%<br />
value A <str<strong>on</strong>g>and</str<strong>on</strong>g> B <str<strong>on</strong>g>and</str<strong>on</strong>g> B - pooled)<br />
First 8 CS -2533.9<br />
Last 8 CS -2414.6 -4948.6<br />
Pooled -4303.5 -1290.13 18.31<br />
Pooled with scal<strong>in</strong>g -4299.7 -1297.81 16.92<br />
This test also shows that the hypothesis <str<strong>on</strong>g>of</str<strong>on</strong>g> equal parameters <strong>in</strong> the two models can be rejected at the<br />
5% level (with a test value at 1298), suggest<strong>in</strong>g that the preference structure is clearly different <strong>in</strong><br />
the last 8 CS, even after an adjustment for differences <strong>in</strong> the error variance. Recall that the scale<br />
parameter is the <strong>in</strong>verse <str<strong>on</strong>g>of</str<strong>on</strong>g> the st<str<strong>on</strong>g>and</str<strong>on</strong>g>ard deviati<strong>on</strong> <str<strong>on</strong>g>of</str<strong>on</strong>g> the error term (Swait & Louviere 1993). <str<strong>on</strong>g>The</str<strong>on</strong>g><br />
scale factor <str<strong>on</strong>g>of</str<strong>on</strong>g> 1.14 identified <strong>in</strong> table 2 implies that the variance <str<strong>on</strong>g>of</str<strong>on</strong>g> the error term or “noise” <strong>in</strong> the<br />
model based <strong>on</strong> the last 8 CS is 23% smaller than <strong>in</strong> model based <strong>on</strong> the first 8 CS 3 . <str<strong>on</strong>g>The</str<strong>on</strong>g> appearance<br />
<str<strong>on</strong>g>of</str<strong>on</strong>g> smaller error variance <strong>in</strong> the model based <strong>on</strong> the last 8 CS <strong>in</strong>dicates that resp<strong>on</strong>dents’ preferences<br />
have settled <str<strong>on</strong>g>and</str<strong>on</strong>g> that a learn<strong>in</strong>g effect has taken place dur<strong>in</strong>g the first 8 CS. This corresp<strong>on</strong>ds to the<br />
comparis<strong>on</strong> <str<strong>on</strong>g>of</str<strong>on</strong>g> model fit between the two models (i) <str<strong>on</strong>g>and</str<strong>on</strong>g> (ii), where the model based <strong>on</strong> the last 8<br />
CS clearly provides a better fit to the data. This is equivalent to the f<strong>in</strong>d<strong>in</strong>gs by Holmes & Boyle<br />
(2005).<br />
<str<strong>on</strong>g>The</str<strong>on</strong>g> above tests are jo<strong>in</strong>t tests that dem<strong>on</strong>strate a change <strong>in</strong> the overall preference structure. In a<br />
more detailed analysis <str<strong>on</strong>g>of</str<strong>on</strong>g> how the preferences change, we compare the relative size <str<strong>on</strong>g>of</str<strong>on</strong>g> the attribute<br />
coefficients across sub-samples. In order to avoid the c<strong>on</strong>found<strong>in</strong>g <str<strong>on</strong>g>of</str<strong>on</strong>g> scale <str<strong>on</strong>g>of</str<strong>on</strong>g> the Gumbel error <str<strong>on</strong>g>and</str<strong>on</strong>g><br />
structure <str<strong>on</strong>g>of</str<strong>on</strong>g> utility across the two sub-samples used <strong>in</strong> Models (i) <str<strong>on</strong>g>and</str<strong>on</strong>g> (ii) (Hausman & Ruud 1987,<br />
3 (1/1.14 2 ) = 0.7695, hence there is a 23% difference <strong>in</strong> the variance between the two models.<br />
14