GONG Newsletter #31, August - National Solar Observatory
GONG Newsletter #31, August - National Solar Observatory
GONG Newsletter #31, August - National Solar Observatory

Create successful ePaper yourself
Turn your PDF publications into a flip-book with our unique Google optimized e-Paper software.
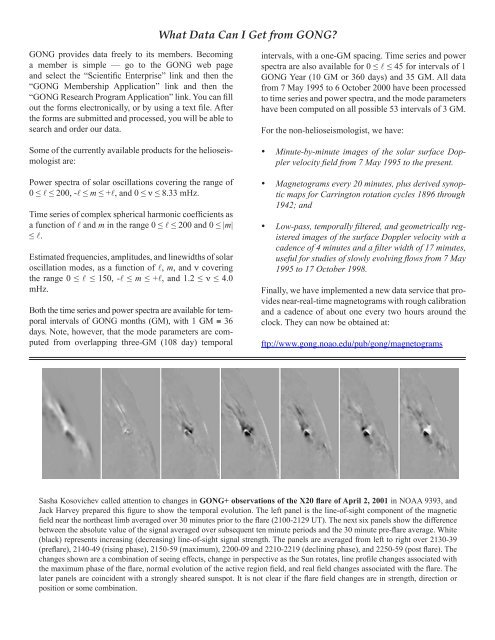
What Data Can I Get from <strong>GONG</strong><br />
<strong>GONG</strong> provides data freely to its members. Becoming<br />
a member is simple — go to the <strong>GONG</strong> web page<br />
and select the “Scientic Enterprise” link and then the<br />
“<strong>GONG</strong> Membership Application” link and then the<br />
“<strong>GONG</strong> Research Program Application” link. You can ll<br />
out the forms electronically, or by using a text le. After<br />
the forms are submitted and processed, you will be able to<br />
search and order our data.<br />
Some of the currently available products for the helioseismologist<br />
are:<br />
Power spectra of solar oscillations covering the range of<br />
0 ≤ l ≤ 200, -l ≤ m ≤ +l, and 0 ≤ ν ≤ 8.33 mHz.<br />
Time series of complex spherical harmonic coefcients as<br />
a function of l and m in the range 0 ≤ l ≤ 200 and 0 ≤ |m|<br />
≤ l.<br />
Estimated frequencies, amplitudes, and linewidths of solar<br />
oscillation modes, as a function of l, m, and ν covering<br />
the range 0 ≤ l ≤ 150, -l ≤ m ≤ +l, and 1.2 ≤ ν ≤ 4.0<br />
mHz.<br />
Both the time series and power spectra are available for temporal<br />
intervals of <strong>GONG</strong> months (GM), with 1 GM ≡ 36<br />
days. Note, however, that the mode parameters are computed<br />
from overlapping three-GM (108 day) temporal<br />
intervals, with a one-GM spacing. Time series and power<br />
spectra are also available for 0 ≤ l ≤ 45 for intervals of 1<br />
<strong>GONG</strong> Year (10 GM or 360 days) and 35 GM. All data<br />
from 7 May 1995 to 6 October 2000 have been processed<br />
to time series and power spectra, and the mode parameters<br />
have been computed on all possible 53 intervals of 3 GM.<br />
For the non-helioseismologist, we have:<br />
• Minute-by-minute images of the solar surface Doppler<br />
velocity eld from 7 May 1995 to the present.<br />
• Magnetograms every 20 minutes, plus derived synoptic<br />
maps for Carrington rotation cycles 1896 through<br />
1942; and<br />
• Low-pass, temporally ltered, and geometrically registered<br />
images of the surface Doppler velocity with a<br />
cadence of 4 minutes and a lter width of 17 minutes,<br />
useful for studies of slowly evolving ows from 7 May<br />
1995 to 17 October 1998.<br />
Finally, we have implemented a new data service that provides<br />
near-real-time magnetograms with rough calibration<br />
and a cadence of about one every two hours around the<br />
clock. They can now be obtained at:<br />
ftp://www.gong.noao.edu/pub/gong/magnetograms<br />
Sasha Kosovichev called attention to changes in <strong>GONG</strong>+ observations of the X20 are of April 2, 2001 in NOAA 9393, and<br />
Jack Harvey prepared this gure to show the temporal evolution. The left panel is the line-of-sight component of the magnetic<br />
eld near the northeast limb averaged over 30 minutes prior to the are (2100-2129 UT). The next six panels show the difference<br />
between the absolute value of the signal averaged over subsequent ten minute periods and the 30 minute pre-are average. White<br />
(black) represents increasing (decreasing) line-of-sight signal strength. The panels are averaged from left to right over 2130-39<br />
(preare), 2140-49 (rising phase), 2150-59 (maximum), 2200-09 and 2210-2219 (declining phase), and 2250-59 (post are). The<br />
changes shown are a combination of seeing effects, change in perspective as the Sun rotates, line prole changes associated with<br />
the maximum phase of the are, normal evolution of the active region eld, and real eld changes associated with the are. The<br />
later panels are coincident with a strongly sheared sunspot. It is not clear if the are eld changes are in strength, direction or<br />
position or some combination.