Offering Circular. - SFM
Offering Circular. - SFM
Offering Circular. - SFM

You also want an ePaper? Increase the reach of your titles
YUMPU automatically turns print PDFs into web optimized ePapers that Google loves.
through 2008. The Region has established a representative office in Brussels to promote directly the interests<br />
of the Region within the various institutions of the EU.<br />
The Region has been allocated funds for the six-year period 2000-2006 under the Rural Development Plan<br />
(the “RDP”). The RDP is designed to develop rural areas in the Region. The funds will be used to help<br />
maintain and diversify agricultural activities, create jobs and protect the environment. The EU fund which<br />
contributes to the RDP is the European Agricultural Guidance and Guaranteed Fund. Total committed<br />
funding to the Region from public sources under the RDP is equal to h586 million (of which approximately<br />
44 per cent. is provided by the EU and 46 per cent. is provided by the Central Government) and is expected<br />
to be paid through 2008 to the Region in varying amounts up to h107 million per year. Private source funding<br />
under the RDP is estimated to provide an additional aggregate total amount of h257 million through 2008.<br />
Funds have also been allocated for the six-year period 2000-2006 under the Leader Plus programme<br />
(“Leader Plus”). Leader Plus is designed to promote the development of rural areas in the Region through<br />
the provision of integrated services related to the agricultural industry (such as, for example, agro-business<br />
services). The funds will be used to promote strategic development projects and technical assistance<br />
programmes and to foster cooperation among rural areas in the Region. Funding for Leader Plus is provided<br />
by the European Agricultural Guidance and Guaranteed Fund. Total committed funding to the Region from<br />
public sources under Leader Plus through 2006 is equal to h29 million (of which approximately 47 per cent.<br />
is provided by the EU and 33 per cent. is provided by the Central Government) and is expected to be paid<br />
each year between 2002 and 2008 to the Region in varying amounts up to h5 million per year. Private source<br />
funding under the RDP is estimated to provide an additional h22 million through 2008.<br />
Funds committed by the EU are allocated to specific projects and amounts to be paid each year are<br />
contingent upon the Region having spent the prior year’s allocation on such projects in the manner<br />
determined by the EU. If within a determined grace period after 2006, all funds allocated to the Region have<br />
not been spent on the relevant projects in accordance with EU specifications, the unpaid allocations will be<br />
forfeited and any prepaid funds must be returned to the EU. Funds allocated to the Region by the EU for the<br />
six-year period 1994-1999 pursuant to EU programmes Objective 2 and Objective 5b (the latter provided for<br />
financial assistance to rural areas and terminated in 1999) totalled h261 million. Approximately 90 per cent.<br />
(or h235 million) of such funds were spent on the related projects within the established deadline of 31<br />
December 2001. The balance of h26 million is required to be returned to the EU.<br />
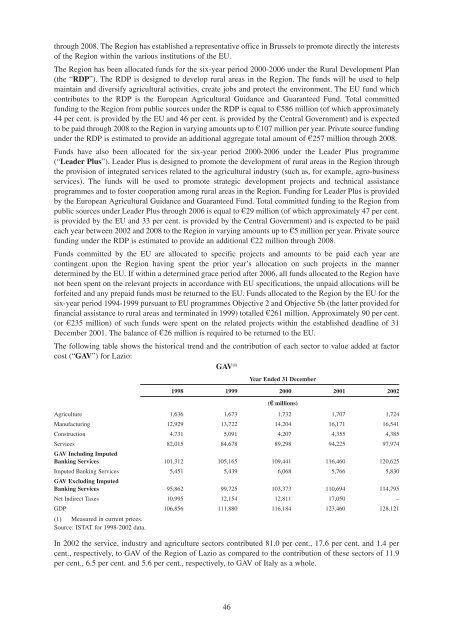
The following table shows the historical trend and the contribution of each sector to value added at factor<br />
cost (“GAV”) for Lazio:<br />
GAV (1)<br />
Year Ended 31 December<br />
1998 1999 2000 2001 2002<br />
(h millions)<br />
Agriculture 1,636 1,673 1,732 1,707 1,724<br />
Manufacturing 12,929 13,722 14,204 16,171 16,541<br />
Construction 4,731 5,091 4,207 4,355 4,385<br />
Services 82,015 84,678 89,298 94,225 97,974<br />
GAV Including Imputed<br />
Banking Services 101,312 105,165 109,441 116,460 120,625<br />
Imputed Banking Services 5,451 5,439 6,068 5,766 5,830<br />
GAV Excluding Imputed<br />
Banking Services 95,862 99,725 103,373 110,694 114,795<br />
Net Indirect Taxes 10,995 12,154 12,811 17,050 –<br />
GDP 106,856 111,880 116,184 123,460 128,121<br />
(1) Measured in current prices.<br />
Source: ISTAT for 1998-2002 data.<br />
In 2002 the service, industry and agriculture sectors contributed 81.0 per cent., 17.6 per cent. and 1.4 per<br />
cent., respectively, to GAV of the Region of Lazio as compared to the contribution of these sectors of 11.9<br />
per cent., 6.5 per cent. and 5.6 per cent., respectively, to GAV of Italy as a whole.<br />
46