Monitoring panel performances with g p p the Mixed Assessor Model ...
Monitoring panel performances with g p p the Mixed Assessor Model ...
Monitoring panel performances with g p p the Mixed Assessor Model ...
You also want an ePaper? Increase the reach of your titles
YUMPU automatically turns print PDFs into web optimized ePapers that Google loves.
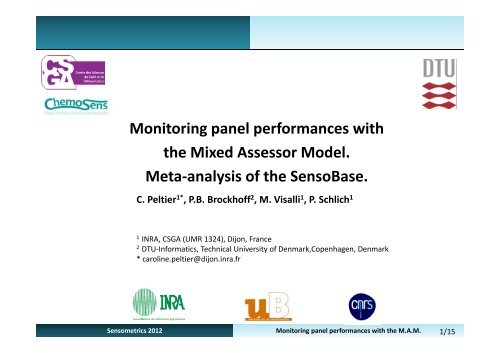
<strong>Monitoring</strong> <strong>panel</strong> <strong>performances</strong> <strong>with</strong><br />
<strong>the</strong> <strong>Mixed</strong> <strong>Assessor</strong> <strong>Model</strong>.<br />
Meta‐analysis analysis of <strong>the</strong> SensoBase.<br />
C. Peltier 1* , P.B. Brockhoff 2 , M. Visalli 1 , P. Schlich 1<br />
1<br />
INRA, CSGA (UMR 1324), Dijon, France<br />
2<br />
DTU‐Informatics, Technical University of Denmark,Copenhagen, Denmark<br />
* caroline.peltier@dijon.inra.fr<br />
l i i Sensometrics 2012 <strong>Monitoring</strong> <strong>panel</strong> <strong>performances</strong> <strong>with</strong> <strong>the</strong> M.A.M. 1/15
The <strong>Mixed</strong> <strong>Assessor</strong> <strong>Model</strong> (M. A.M.)<br />
The M.A.M. C.A.P Table<br />
Application to <strong>the</strong> SensoBase<br />
Context of <strong>the</strong> presentation<br />
CAP Table (Schlich) :<br />
Control <strong>Assessor</strong>s<br />
Performances Table<br />
M.A.M (Brockhoff 1 ) :<br />
New tests of <strong>performances</strong><br />
taking scaling into account<br />
A syn<strong>the</strong>tic table for <strong>panel</strong> and<br />
<strong>panel</strong>list <strong>performances</strong> in <strong>the</strong><br />
classical model (SensoBase project)<br />
MAM CAP Table<br />
• Syn<strong>the</strong>tic table for <strong>panel</strong> and<br />
<strong>panel</strong>list <strong>performances</strong> in <strong>the</strong><br />
MAM<br />
• Intuitive set of colors<br />
1<br />
Brockhoff, P.B. (2012). Accounting for Scaling Differences in Sensory Profile Data: Improved <strong>Mixed</strong> <strong>Model</strong> Analysis of Variance (to be<br />
submitted)<br />
1<br />
Brockhoff, P.B. (2011). <strong>Mixed</strong> <strong>Assessor</strong> <strong>Model</strong>. Pangborn Oral Presentation<br />
1<br />
Brockhoff, P.B. and Skovgaard, I.M. (1994). <strong>Model</strong>ling individual differences between assessors in sensory evaluations, Food Quality<br />
and Preferences 5,215-224<br />
3 Université Sensometrics de Bourgogne, 2012 le 20 Janvier 2012<br />
<strong>Monitoring</strong> <strong>panel</strong> <strong>performances</strong> <strong>with</strong> <strong>the</strong> M.A.M. 3/15
Outline<br />
• The <strong>Mixed</strong> <strong>Assessor</strong> <strong>Model</strong> l(MAM)<br />
• The MAM‐CAP table<br />
• Application of <strong>the</strong> MAM to <strong>the</strong> SensoBase<br />
3 Université Sensometrics de Bourgogne, 2012 le 20 Janvier 2012<br />
<strong>Monitoring</strong> <strong>panel</strong> <strong>performances</strong> <strong>with</strong> <strong>the</strong> M.A.M. 3/15
The <strong>Mixed</strong> <strong>Assessor</strong> <strong>Model</strong> (M. A.M.)<br />
The M.A.M. C.A.P Table<br />
Application to <strong>the</strong> SensoBase<br />
Classical model of ANOVA<br />
: <strong>panel</strong>list effect<br />
: product effect<br />
: interaction effect<br />
I : number of <strong>panel</strong>lists<br />
J : number of products<br />
K : number of replicates<br />
Interaction term: compares <strong>panel</strong>list means deviations and <strong>panel</strong> deviations<br />
These deviations can be explained by:<br />
• a disagreement <strong>with</strong> <strong>the</strong> <strong>panel</strong><br />
• a different use of scale = scaling effect<br />
3<br />
Université Sensometrics de Bourgogne, 2012 le 20 Janvier 2012 <strong>Monitoring</strong> Méthodes <strong>panel</strong> statistiques <strong>performances</strong> en analyse <strong>with</strong>sensorielle<br />
<strong>the</strong> M.A.M. 4/15
The <strong>Mixed</strong> <strong>Assessor</strong> <strong>Model</strong> (M. A.M.)<br />
The M.A.M. C.A.P Table<br />
Application to <strong>the</strong> SensoBase<br />
The scaling effect<br />
Panellist<br />
Panel<br />
Disagreement<br />
A B C A B C<br />
A A B B C C<br />
‐4 ‐2 5<br />
However <strong>the</strong> <strong>panel</strong>list seems<br />
to agree <strong>with</strong> <strong>the</strong> <strong>panel</strong>. He<br />
just uses a larger scale.<br />
How to get rid of <strong>the</strong> scaling<br />
effect <br />
We search <strong>the</strong> number by<br />
which we multiply <strong>the</strong> scores<br />
of <strong>panel</strong> to be as near as<br />
possible of <strong>the</strong> <strong>panel</strong>list<br />
scores.<br />
2 is <strong>the</strong> coefficient of scaling.<br />
‐2 ‐10 3<br />
Strong disagreement<br />
X 2<br />
Pure disagreement<br />
Panel<br />
Disagreement<br />
A B C AA BB C C<br />
‐4 ‐2 0 6<br />
3<br />
Université Sensometrics de Bourgogne, 2012 le 20 Janvier 2012<br />
<strong>Monitoring</strong> <strong>panel</strong> <strong>performances</strong> <strong>with</strong> <strong>the</strong> M.A.M. 5/15
The <strong>Mixed</strong> <strong>Assessor</strong> <strong>Model</strong> (M. A.M.)<br />
The M.A.M. C.A.P Table<br />
Application to <strong>the</strong> SensoBase<br />
A new interaction decomposition<br />
• If <strong>the</strong> <strong>panel</strong>list i differently uses <strong>the</strong> scale, <strong>the</strong>re exists (scaling coefficient obtained<br />
by linear regression) and (pure disagreement) such as :<br />
• And so, <strong>the</strong> interaction is decomposed such as :<br />
3 Université Sensometrics de Bourgogne, 2012 le 20 Janvier 2012<br />
<strong>Monitoring</strong> <strong>panel</strong> <strong>performances</strong> <strong>with</strong> <strong>the</strong> M.A.M. 6/15
The <strong>Mixed</strong> <strong>Assessor</strong> <strong>Model</strong> (M. A.M.)<br />
The M.A.M. C.A.P Table<br />
Application to <strong>the</strong> SensoBase<br />
The <strong>Mixed</strong> <strong>Assessor</strong> <strong>Model</strong><br />
: <strong>panel</strong>list effect<br />
:<br />
: pure disagreement<br />
: product effect<br />
: scaling coefficient effect<br />
This new model implies new <strong>performances</strong> tests.<br />
3 Université Sensometrics de Bourgogne, 2012 le 20 Janvier 2012<br />
<strong>Monitoring</strong> <strong>panel</strong> <strong>performances</strong> <strong>with</strong> <strong>the</strong> M.A.M. 7/15
The <strong>Mixed</strong> <strong>Assessor</strong> <strong>Model</strong> (M. A.M.)<br />
The M.A.M. C.A.P Table<br />
Application to <strong>the</strong> SensoBase<br />
Panellist <strong>performances</strong> <strong>with</strong> <strong>the</strong> <strong>Mixed</strong> <strong>Assessor</strong> <strong>Model</strong><br />
Classical <strong>panel</strong>list <strong>performances</strong><br />
• Discrimination: to give different scores to different products<br />
• Agreement: for a judge to agree <strong>with</strong> <strong>the</strong> group;<br />
for a group not to include too many judges in disagreement<br />
• Repeatability: to give <strong>the</strong> same score to a same product presented twice<br />
• Scaling: to spread <strong>the</strong> scores as <strong>the</strong> <strong>panel</strong><br />
Tests of <strong>performances</strong> <strong>with</strong> <strong>the</strong> usual model and <strong>the</strong> M.A.M.<br />
Discrimination<br />
effect<br />
Disag. effect<br />
Panellist<br />
Panel<br />
Usual <strong>Model</strong> M.A.M Usual <strong>Model</strong> M.A.M<br />
Scaling effect<br />
We use <strong>the</strong> pure disagreement where we used to use <strong>the</strong> interaction.<br />
3 Université Sensometrics de Bourgogne, 2012 le 20 Janvier 2012<br />
<strong>Monitoring</strong> <strong>panel</strong> <strong>performances</strong> <strong>with</strong> <strong>the</strong> M.A.M. 8/15
The <strong>Mixed</strong> <strong>Assessor</strong> <strong>Model</strong> (M. A.M.)<br />
The M.A.M. C.A.P Table<br />
Application to <strong>the</strong> SensoBase<br />
MAM CAP Table<br />
Panel Performances<br />
Panellist <strong>performances</strong><br />
Attribute Mean F‐Prod F‐Scal F‐Disa RMSE S2 S4 … S1 S12<br />
Sweet 4.89 37.80 1.44 0.55 1.91 |‐‐‐| | > < … | | | |<br />
Sour 7.24 34.63 1.95 0.45 1.47 |‐‐| >‐‐‐< … | | | |<br />
Chocolate 3.42 8.12 0.76 1.26 1.51 |‐‐‐| |‐‐‐| … |‐| | |<br />
… … … … … … … … … … …<br />
Lemon 2.98 0.17 1.79 2.86 0.98 |‐‐‐| | | … |‐‐| <br />
F‐rank ‐ ‐ ‐ ‐ ‐ 2.1 2.7 4.2 5.7<br />
Panel <strong>performances</strong><br />
F‐Prod :<br />
p0.05<br />
Panellist <strong>performances</strong><br />
Product discrimination :<br />
‐‐‐ p
The <strong>Mixed</strong> <strong>Assessor</strong> <strong>Model</strong> (M. A.M.)<br />
The M.A.M. C.A.P Table<br />
Application to <strong>the</strong> SensoBase<br />
MAM CAP Table<br />
Panel Performances<br />
Panellist <strong>performances</strong><br />
Attribute Mean F‐Prod F‐Scal F‐Disa RMSE S2 S4 … S1 S12<br />
Sweet 4.89 37.80 1.44 0.55 1.91 |‐‐‐| | > < … | | | |<br />
Sour 7.24 34.63 1.95 0.45 1.47 |‐‐| >‐‐‐< … | | | |<br />
Chocolate 3.42 8.12 0.76 1.26 1.51 |‐‐‐| |‐‐‐| … |‐| | |<br />
… … … … … … … … … … …<br />
Lemon 2.98 0.17 1.79 2.86 0.98 |‐‐‐| | | … |‐‐| <br />
F‐rank ‐ ‐ ‐ ‐ ‐ 2.1 2.7 4.2 5.7<br />
Discrimination<br />
Scaling<br />
Disagreement<br />
Panel <strong>performances</strong><br />
F‐Prod : p0.05<br />
F‐Scal :<br />
F‐Disag:<br />
p0.05<br />
Attributes sorted from <strong>the</strong> more<br />
discriminative to <strong>the</strong> less discriminative<br />
Panellist <strong>performances</strong><br />
Product discrimination :<br />
‐‐‐ p
The <strong>Mixed</strong> <strong>Assessor</strong> <strong>Model</strong> (M. A.M.)<br />
The M.A.M. C.A.P Table<br />
Application to <strong>the</strong> SensoBase<br />
MAM CAP Table<br />
Panel Performances<br />
Panellist <strong>performances</strong><br />
Attribute Mean F‐Prod F‐Scal F‐Disa RMSE S2 S4 … S1 S12<br />
Sweet 4.89 37.80 1.44 0.55 1.91 |‐‐‐| | > < … | | | |<br />
Sour 7.24 34.63 1.95 0.45 1.47 |‐‐| >‐‐‐< … | | | |lr<br />
Chocolate 3.42 8.12 0.76 1.26 1.51 |‐‐‐| |‐‐‐| … |‐| | |<br />
… … … … … … … … … … …<br />
Lemon 2.98 0.17 1.79 2.86 0.98 |‐‐‐| | | … |‐‐| <br />
F‐rank ‐ ‐ ‐ ‐ ‐ 2.1 2.7 4.2 5.7<br />
3<br />
Average rank of<br />
individual product F‐<br />
ratio. The smaller is<br />
F‐rank, <strong>the</strong> better is<br />
<strong>the</strong> <strong>panel</strong>list.<br />
Panel <strong>performances</strong><br />
Panellist <strong>performances</strong><br />
F‐Prod: p0.05<br />
Product discrimination:<br />
Discrimination<br />
‐‐‐ p
The <strong>Mixed</strong> <strong>Assessor</strong> <strong>Model</strong> (M. A.M.)<br />
The M.A.M. C.A.P Table<br />
Application to <strong>the</strong> SensoBase<br />
Application of <strong>the</strong> MAM to <strong>the</strong><br />
SensoBase contains data from :<br />
• 1030 sensory descriptive<br />
studies<br />
• 50 laboratories in 24 countries<br />
• 4 734 <strong>panel</strong>lists<br />
• 6 234 products<br />
• 17 275 descriptors<br />
• 4 988 880 scores<br />
A first study has been presented<br />
by Per B. Brockhoff in 2011.<br />
Selection of <strong>the</strong> data sets <strong>with</strong> :<br />
• At least 2 replicates<br />
• At least 3 products<br />
• Balanced<br />
A study on 235 data sets.<br />
• Are scaling differences among <strong>panel</strong>lists a<br />
reality or not <br />
• Does MAM provide us <strong>with</strong> better product<br />
discrimination and <strong>panel</strong>list agreement <br />
• Is <strong>the</strong>re an effect of age, gender and<br />
education level on <strong>performances</strong> <br />
3 Université Sensometrics de Bourgogne, 2012 le 20 Janvier 2012<br />
<strong>Monitoring</strong> <strong>panel</strong> <strong>performances</strong> <strong>with</strong> <strong>the</strong> M.A.M. 10/15
The <strong>Mixed</strong> <strong>Assessor</strong> <strong>Model</strong> (M. A.M.)<br />
The M.A.M. C.A.P Table<br />
Application to <strong>the</strong> SensoBase<br />
Are scaling differences among <strong>panel</strong>lists a reality <br />
‣ A significant scaling heterogenity among <strong>panel</strong>lists was found in 45% of<br />
attributes<br />
‣ A significant individual scaling effect was found in 23% of <strong>the</strong> <strong>panel</strong>lists by<br />
attribute pairs<br />
‣ 92% of <strong>the</strong> <strong>panel</strong>lists had at least one significant scaling effect<br />
3 Université Sensometrics de Bourgogne, 2012 le 20 Janvier 2012<br />
<strong>Monitoring</strong> <strong>panel</strong> <strong>performances</strong> <strong>with</strong> <strong>the</strong> M.A.M. 11/15
The <strong>Mixed</strong> <strong>Assessor</strong> <strong>Model</strong> (M. A.M.)<br />
The M.A.M. C.A.P Table<br />
Application to <strong>the</strong> SensoBase<br />
Discrimination of <strong>panel</strong> for <strong>the</strong> classical model and <strong>the</strong> MAM<br />
‣ With MAM, <strong>the</strong> product effect was significant (p=0.05) 05) for 64.44 % of <strong>the</strong> attributes, whereas it<br />
was only 58.5 % <strong>with</strong> <strong>the</strong> classical model.<br />
Classical <strong>Model</strong><br />
MAM<br />
96.1%<br />
S<br />
S<br />
58.5% 3.9%<br />
NS<br />
S<br />
41.5% 19.2% 1/5 NS attributes becomes<br />
NS<br />
significant.<br />
80.8% The <strong>Mixed</strong> <strong>Assessor</strong> <strong>Model</strong><br />
NS<br />
moderatly improves <strong>the</strong><br />
S : significant<br />
discrimination of <strong>the</strong> <strong>panel</strong><br />
NS : not significant<br />
3 Université Sensometrics de Bourgogne, 2012 le 20 Janvier 2012<br />
<strong>Monitoring</strong> <strong>panel</strong> <strong>performances</strong> <strong>with</strong> <strong>the</strong> M.A.M.<br />
12/15
The <strong>Mixed</strong> <strong>Assessor</strong> <strong>Model</strong> (M. A.M.)<br />
The M.A.M. C.A.P Table<br />
Application to <strong>the</strong> SensoBase<br />
Disagreement of <strong>panel</strong> for <strong>the</strong> classical model and <strong>the</strong> MAM<br />
‣ With MAM, <strong>the</strong> disagreement effect was significant (p=0.05) 05) for 28.9% of <strong>the</strong> attributes,<br />
whereas it was 48.3% <strong>with</strong> <strong>the</strong> classical model.<br />
Classical <strong>Model</strong><br />
MAM<br />
55.9%<br />
S<br />
S<br />
48.3% 44.1%<br />
51.7% 3.6%<br />
NS<br />
NS<br />
S<br />
1/2 significant attributes for<br />
disagreement becomes non<br />
significant.<br />
96.4% The <strong>Mixed</strong> <strong>Assessor</strong> <strong>Model</strong><br />
NS<br />
dramatically improves <strong>the</strong><br />
S : significant<br />
agreement of <strong>the</strong> <strong>panel</strong><br />
NS : not significant<br />
3 Université Sensometrics de Bourgogne, 2012 le 20 Janvier 2012<br />
<strong>Monitoring</strong> <strong>panel</strong> <strong>performances</strong> <strong>with</strong> <strong>the</strong> M.A.M.<br />
13/15
The <strong>Mixed</strong> <strong>Assessor</strong> <strong>Model</strong> (M. A.M.)<br />
The M.A.M. C.A.P Table<br />
Application to <strong>the</strong> SensoBase<br />
Percent of <strong>the</strong> significant attributes for <strong>the</strong> different effects<br />
according to <strong>the</strong> subject characteristics<br />
Charact. Level N Product Scaling Disag Repet.<br />
Gender Male 9266 33.06 19.80 14.27 14.15<br />
Level of<br />
Education<br />
(12 datasets)<br />
Female 23436 29.78 20.69 14.01 13.3838<br />
Secondary and<br />
Low<br />
1199 37.95 41.00 20.60 13.43<br />
Sup 4955 44.04 44.00 23.23 19.60<br />
Age ‐30 4335 28.65 b 31.81 a 15.09 a 18.15 a<br />
30‐60 45019 31.27 a 20.0101 b 16.01 a 13.90 b<br />
+60 13010 27.86 c 18.38 c 11.19 b 9.84 c<br />
Total 68998 32.00 23.14 16.13 13.94<br />
‣ Men are more discriminative than women<br />
P
The <strong>Mixed</strong> <strong>Assessor</strong> <strong>Model</strong> (M. A.M.)<br />
The M.A.M. C.A.P Table<br />
Application to <strong>the</strong> SensoBase<br />
Percent of <strong>the</strong> significant attributes for <strong>the</strong> different effects<br />
according to <strong>the</strong> subject characteristics<br />
Charact. Level N Product Scaling Disag Repet.<br />
Gender Male 9266 33.06 19.80 14.27 14.15<br />
Level of<br />
Education<br />
(12 datasets)<br />
Female 23436 29.78 20.69 14.01 13.3838<br />
Secondary and<br />
Low<br />
1199 37.95 41.00 20.60 13.43<br />
Sup 4955 44.04 44.00 23.23 19.60<br />
Age ‐30 4335 28.65 b 31.81 a 15.09 a 18.15 a<br />
30‐60 45019 31.27 a 20.0101 b 16.01 a 13.90 b<br />
+60 13010 27.86 c 18.38 c 11.19 b 9.84 c<br />
Total 68998 32.00 23.14 16.13 13.94<br />
P
Conclusion<br />
• The <strong>Mixed</strong> <strong>Assessor</strong> <strong>Model</strong> is a model taking <strong>the</strong> scaling effect into account<br />
• The MAM CAP table sums up all <strong>the</strong> <strong>performances</strong> (<strong>panel</strong> and <strong>panel</strong>list) thanks to a<br />
intuitive set of colors<br />
• With <strong>the</strong> SensoBase study, we have seen that :<br />
• The MAM improves <strong>the</strong> classical model (Panel <strong>performances</strong> : more discriminative,<br />
less disagreement)<br />
• Men, people <strong>with</strong> higher level of education and 30‐60 years‐old are more<br />
discriminative than <strong>the</strong> o<strong>the</strong>rs<br />
• The effect of scaling decreases <strong>with</strong> <strong>the</strong> age whereas repeatability increases<br />
Future prospects<br />
• Extension of <strong>the</strong> M.A.M. to o<strong>the</strong>r cases (multi‐dimensional, non balanced <strong>panel</strong>s…)<br />
3 Université Sensometrics de Bourgogne, 2012 le 20 Janvier 2012<br />
<strong>Monitoring</strong> <strong>panel</strong> <strong>performances</strong> <strong>with</strong> <strong>the</strong> M.A.M.<br />
15/15
Thanks for your attention<br />
3 Université Sensometrics de Bourgogne, 2012 le 20 Janvier 2012<br />
<strong>Monitoring</strong> <strong>panel</strong> <strong>performances</strong> <strong>with</strong> <strong>the</strong> M.A.M.


