The Calgary Industrial Perspective - Colliers International
The Calgary Industrial Perspective - Colliers International
The Calgary Industrial Perspective - Colliers International

You also want an ePaper? Increase the reach of your titles
YUMPU automatically turns print PDFs into web optimized ePapers that Google loves.
CMN CALGARY INC. I<br />
COMMERCIAL REAL ESTATE<br />
<strong>The</strong> <strong>Calgary</strong> <strong>Industrial</strong> <strong>Perspective</strong><br />
INDUSTRIAL I SECOND QUARTER 2010 I JULY 2010<br />
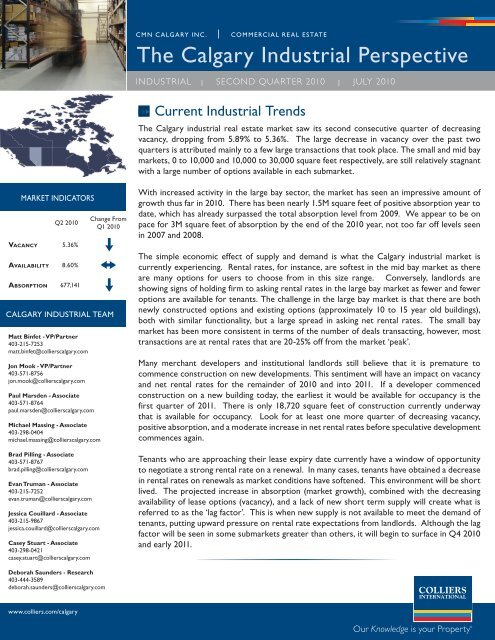
Current <strong>Industrial</strong> Trends<br />
<strong>The</strong> <strong>Calgary</strong> industrial real estate market saw its second consecutive quarter of decreasing<br />
vacancy, dropping from 5.89% to 5.36%. <strong>The</strong> large decrease in vacancy over the past two<br />
quarters is attributed mainly to a few large transactions that took place. <strong>The</strong> small and mid bay<br />
markets, 0 to 10,000 and 10,000 to 30,000 square feet respectively, are still relatively stagnant<br />
with a large number of options available in each submarket.<br />
MARKET INDICATORS<br />
Q2 2010<br />
Va c a n c y 5.36%<br />
Availability 8.60%<br />
Ab s o r p t i o n 677,141<br />
CALGARY INDUSTRIAL TEAM<br />
Matt Binfet - VP/Partner<br />
403-215-7253<br />
matt.binfet@collierscalgary.com<br />
Jon Mook - VP/Partner<br />
403-571-8756<br />
jon.mook@collierscalgary.com<br />
Paul Marsden - Associate<br />
403-571-8764<br />
paul.marsden@collierscalgary.com<br />
Michael Massing - Associate<br />
403-298-0404<br />
michael.massing@collierscalgary.com<br />
Brad Pilling - Associate<br />
403-571-8767<br />
brad.pilling@collierscalgary.com<br />
Evan Truman - Associate<br />
403-215-7252<br />
evan.truman@collierscalgary.com<br />
Jessica Couillard - Associate<br />
403-215-9867<br />
jessica.couillard@collierscalgary.com<br />
Casey Stuart - Associate<br />
403-298-0421<br />
casey.stuart@collierscalgary.com<br />
Change From<br />
Q1 2010<br />
With increased activity in the large bay sector, the market has seen an impressive amount of<br />
growth thus far in 2010. <strong>The</strong>re has been nearly 1.5M square feet of positive absorption year to<br />
date, which has already surpassed the total absorption level from 2009. We appear to be on<br />
pace for 3M square feet of absorption by the end of the 2010 year, not too far off levels seen<br />
in 2007 and 2008.<br />
<strong>The</strong> simple economic effect of supply and demand is what the <strong>Calgary</strong> industrial market is<br />
currently experiencing. Rental rates, for instance, are softest in the mid bay market as there<br />
are many options for users to choose from in this size range. Conversely, landlords are<br />
showing signs of holding firm to asking rental rates in the large bay market as fewer and fewer<br />
options are available for tenants. <strong>The</strong> challenge in the large bay market is that there are both<br />
newly constructed options and existing options (approximately 10 to 15 year old buildings),<br />
both with similar functionality, but a large spread in asking net rental rates. <strong>The</strong> small bay<br />
market has been more consistent in terms of the number of deals transacting, however, most<br />
transactions are at rental rates that are 20-25% off from the market ‘peak’.<br />
Many merchant developers and institutional landlords still believe that it is premature to<br />
commence construction on new developments. This sentiment will have an impact on vacancy<br />
and net rental rates for the remainder of 2010 and into 2011. If a developer commenced<br />
construction on a new building today, the earliest it would be available for occupancy is the<br />
first quarter of 2011. <strong>The</strong>re is only 18,720 square feet of construction currently underway<br />
that is available for occupancy. Look for at least one more quarter of decreasing vacancy,<br />
positive absorption, and a moderate increase in net rental rates before speculative development<br />
commences again.<br />
Tenants who are approaching their lease expiry date currently have a window of opportunity<br />
to negotiate a strong rental rate on a renewal. In many cases, tenants have obtained a decrease<br />
in rental rates on renewals as market conditions have softened. This environment will be short<br />
lived. <strong>The</strong> projected increase in absorption (market growth), combined with the decreasing<br />
availability of lease options (vacancy), and a lack of new short term supply will create what is<br />
referred to as the ‘lag factor’. This is when new supply is not available to meet the demand of<br />
tenants, putting upward pressure on rental rate expectations from landlords. Although the lag<br />
factor will be seen in some submarkets greater than others, it will begin to surface in Q4 2010<br />
and early 2011.<br />
Deborah Saunders - Research<br />
403-444-3589<br />
deborah.saunders@collierscalgary.com<br />
www.colliers.com/calgary<br />
Our Knowledge is your Property ®
CALGARY PERSPECTIVE I SECOND QUARTER 2010 I INDUSTRIAL<br />
Vacancy and Availability<br />
District Total Inventory (Sq. Ft.) Total Available (Sq. Ft.) % Available % Vacant<br />
Alyth-Inglewood 2,897,296 3,163 0.11% 0.11%<br />
Beltline 326,756 56,377 17.25% 14.29%<br />
Bonnybrook 2,872,915 72,102 2.51% 2.51%<br />
Burns 1,834,271 121,345 6.62% 3.92%<br />
East Fairview 3,100,726 112,310 3.62% 2.86%<br />
Fairview 1,691,092 71,987 4.26% 0.36%<br />
Haysboro 378,894 2,506 0.66% 0.66%<br />
Highfield 5,831,878 180,409 3.09% 2.60%<br />
North Manchester 3,622,965 221,161 6.10% 6.10%<br />
Riverview 980,225 17,024 1.74% 1.74%<br />
South Manchester 5,043,448 102,834 2.04% 1.67%<br />
Total Central Market 28,580,466 961,218 3.36% 2.68%<br />
Airways 2,232,680 86,696 3.88% 3.60%<br />
Beaverdam 661,709 21,479 3.25% 3.25%<br />
Deerfoot Bus. Park 3,513,465 399,120 11.36% 9.66%<br />
Freeport 1,168,667 80,999 6.93% 6.93%<br />
Greenview 2,470,604 56,763 2.30% 1.86%<br />
Horizon 4,188,210 226,373 5.41% 2.04%<br />
VACANCY<br />
Region<br />
April 2010 July 2010 April 2010 July 2010<br />
(Sq. Ft.) (Sq. Ft.) (%) (%)<br />
Central 780,371 764,997 2.73 2.68<br />
Northeast 2,037.174 2,028,610 5.77 5.75<br />
Southeast 3,441,788 2,886,163 6.85 5.69<br />
Total 6,893,934 6,339,225 5.89 5.36<br />
AVAILABILITY<br />
Region<br />
April 2010 July 2010 April 2010 July 2010<br />
(Sq. Ft.) (Sq. Ft.) (%) (%)<br />
Central 939,542 961,218 3.28 3.36<br />
Northeast 2,802,537 3,311,840 7.83 9.14<br />
Southeast 5,849,497 5,454,171 11.39 10.48<br />
Total 10,253,119 10,408,531 8.60 8.60<br />
Mayland 1,739,798 53,832 3.09% 3.09%<br />
McCall 3,649,921 318,045 8.71% 8.71%<br />
Meridian-Franklin 5,283,755 376,955 7.13% 5.93%<br />
Pegasus 678,261 49,828 7.35% 1.68%<br />
Saddleridge 27,119 9,275 34.20% -<br />
Skyline 1,846,819 65,781 3.56% 3.56%<br />
South Airways 3,923,479 170,531 4.35% 3.50%<br />
Stoney 1,981,192 1,193,880 60.26% 28.67%<br />
Sunridge 1,320,776 112,152 8.49% 8.49%<br />
Westwinds 1,541,401 90,131 5.85% 3.18%<br />
Total NE Market 36,227,856 3,311,840 9.14% 5.75%<br />
Douglasdale 1,321,767 104,026 7.87% 3.17%<br />
Dufferin 2,950,743 505,737 17.14% 3.99%<br />
Eastfield 2,415,844 181,117 7.50% 4.67%<br />
Eastlake 3,654,800 478,173 13.08% 11.06%<br />
Foothills 22,327,068 1,897,623 8.50% 5.83%<br />
Forest Lawn 1,392,750 2,400 0.17% 0.17%<br />
Golden Triangle 756,635 18,164 2.40% 2.40%<br />
Great Plains 4,701,413 1,090,616 23.20% 14.97%<br />
Mountainview 288,916 - - -<br />
Ogden 345,730 - - -<br />
Rangewinds 776,672 34,711 4.47% 4.47%<br />
Availability Vacancy Total Occupied Space<br />
Fully Serviced Land Values<br />
Section 23 2,683,740 60,540 2.26% -<br />
Shepard 656,056 - - -<br />
Shepard Business Park 1,069,635 139,313 13.02% 8.48%<br />
South Foothills 2,518,493 51,876 2.06% 1.81%<br />
Southbend 1,195,840 68,518 5.73% 5.73%<br />
Starfield 2,017,118 788,063 39.07% 1.36%<br />
Valleyfield 955,592 33,294 3.48% 3.48%<br />
Total SE Market 52,028,812 5,454,171 10.48% 5.69%<br />
Airdrie 1,272,609 418,090 32.85% 32.85%<br />
Balzac 775,500 127,500 16.44% 33.95%<br />
Cochrane 45,865 - - -<br />
MD of Foothills 6,000 - - -<br />
MD of Rockyview 1,913,686 119,339 6.24% 5.58%<br />
North West 159,415 16,373 10.27% 5.93%<br />
Total Other Districts 4,173,075 681,302 18.66% 17.86%<br />
Overall Market 121,010,209 10,408,531 8.60% 5.36%<br />
2 COLLIERS INTERNATIONAL
CALGARY PERSPECTIVE I SECOND QUARTER 2010 I INDUSTRIAL<br />
Current Freestanding / Land / Condo Trends<br />
<strong>The</strong> freestanding owner/user sales market continued to be strong through the second quarter of 2010. Driven by low<br />
interest rates, more favorable financing and a general opinion that sale values have hit bottom and are beginning to<br />
rebound has resulted in strong activity. <strong>The</strong> number of quality freestanding buildings currently on the market is very<br />
limited which should result in more land sales. Users will determine that purchasing an existing suitable property is not an<br />
option and focus on new build to suits, which we are beginning to see now on requirements under 15,000 square feet that<br />
has resulted in more land sales within <strong>Calgary</strong> after a slow 2009. <strong>The</strong> City of <strong>Calgary</strong> owns and is offering the majority<br />
of the fully serviced industrial land available in the southeast for sale. <strong>The</strong> City remained relatively firm on asking prices<br />
despite the large inventory available when compared to private owners and developers who have reacted to the changing<br />
land market in 2009 and 2010 with lower prices.<br />
All eight of the lots in Phase I of the City’s Great Plains <strong>Industrial</strong> Park remain available at asking prices from $550,000 -<br />
$675,000 per acre with only two lots available that are less than 2 acres in size. All remaining lots available from the City<br />
in Eastlake <strong>Industrial</strong> Park are over 2 acres although there are smaller lots available from private owners. Average selling<br />
prices in the southeast remained at approximately $510,000 - $540,000 per acre. Remaining lots in Eastlake have asking<br />
prices from $560,000 - $625,000 per acre.<br />
Asking prices for partially serviced industrial land along the 84th Street Corridor remain stable in the second quarter with<br />
prices from $265,000 - $350,000 per acre and sales transacting in the same range.<br />
Springbank Commercial Park on the west side of <strong>Calgary</strong> which rarely sees transactions due to the small inventory of<br />
land saw three separate land sales. A total of seven acres sold in Springbank at approximately $350,000 per acre. <strong>The</strong>se<br />
sales all occured in the second quarter.<br />
<strong>The</strong> northeast and central industrial land prices remained relatively unchanged at approximately $800,000 - $1,000,000<br />
per acre given the lack of immediate inventory available.<br />
<strong>The</strong> industrial condo market saw a resurgence in the second quarter of 2010. Virtually all of the existing condo bays in<br />
Eastlake <strong>Industrial</strong> Park that were constructed in 2008/2009 and remained on the market during the downturn in 2009<br />
have now sold. This is a positive sign of a more active industrial sales market as small bay condo sales are typically the<br />
first to slow in a downturn and the last to come back in an improving market. Selling prices for “shell” condo bays are<br />
$150 - $185 per square foot for units of approximately 3,000 square feet. This is off of peak pricing of $185 - $200 per<br />
square foot seen in 2008.<br />
Notable transactions<br />
LEASED - 220,000 square feet<br />
Landlord: <strong>The</strong> Beedie Group<br />
Tenant: TransCanada Turbines<br />
SOLD - 4.04 acres<br />
Vendor: Jayben Holdings Ltd.<br />
Purchaser: ASC Springbank Inc. - Lot 4<br />
Purchaser: Outer Edges Landscaping Inc. - Lot 5<br />
COLLIERS INTERNATIONAL 3
CALGARY PERSPECTIVE I SECOND QUARTER 2010 I INDUSTRIAL<br />
Featured Listings<br />
Fo r Sa l e<br />
/Le a s e<br />
Fo r Sa l e<br />
6835 - 8th Street NE<br />
38,577 square feet on 3.03 acres<br />
Contact: Jon Mook, & Casey Stuart<br />
Highland <strong>Industrial</strong> Park<br />
Design Build Opportunities<br />
Contact: Matt Binfet, Paul Marsden<br />
& Jessica Couillard<br />
Notable Transactions Co n t i n u e d...<br />
LEASED - 16,309 square feet<br />
Landlord: Norgar Management Limited<br />
Tenant: Wildwood Cabinets<br />
Fo r Sa l e<br />
70 Commercial Court<br />
13,106 square feet on 7.6 acres<br />
Contact: Michael Massing & EvanTruman<br />
Fo r Sa l e<br />
Freeport <strong>Industrial</strong> Park<br />
4 parcels (2.29 - 2.92 acres)<br />
Contact: Brad Pilling<br />
SOLD - 11,450 square feet on 3.05 acres<br />
Vendor: RPM Trailer<br />
Purchaser: <strong>The</strong> Motor Company Inc.<br />
<strong>Colliers</strong> <strong>Calgary</strong> <strong>Industrial</strong> Division<br />
would like to thank the following for<br />
their business this 2nd Quarter of 2010:<br />
19th Wife Productions Inc.<br />
72nd Avenue Limited Partnership<br />
1166444 Alberta Ltd.<br />
1289048 Alberta Ltd.<br />
AGAT Laboratories Ltd.<br />
ASC Springbank Inc.<br />
Albright Lighting Ltd.<br />
Arctica Showcase Canada Inc.<br />
Atlantis Realty Services Inc.<br />
bcIMC Realty Corporation<br />
C3 Integrated Solutions Ltd.<br />
<strong>Calgary</strong> <strong>Industrial</strong> Properties Ltd.<br />
Capital Paper Recycling Ltd.<br />
Carshacks Inc.<br />
Cathedral Energy Services Ltd.<br />
Crossroads C & I Disbributors<br />
Crown Granite & Marble<br />
DIRTT Environmental Solutions Ltd.<br />
Enerflex Systems Ltd.<br />
Enersul Inc.<br />
Fairfield Watson & Company Inc.<br />
Farm Air Properties Inc.<br />
Foothills Equities Inc. c/o Tonko Realty Advisors<br />
Gamma Dynacare Medical Laboratories<br />
Great West Resources Ltd.<br />
H & H Northwest Ltd. Construction Management<br />
Hampton Developments Ltd.<br />
Highline Electrical Constructions Ltd.<br />
Home Flooring Design Centre Corporation<br />
Hopewell Airport (Cgy) Developments Inc.<br />
Hyatt Auto Sales Ltd.<br />
ING Real Estate Canada<br />
Jayben Holdings Ltd.<br />
Kohl & Frisch Limited<br />
Lance Holdings Ltd.<br />
Metro Hardwood Floors Ltd.<br />
Nordic Investments Ltd.<br />
Norberg Properties Ltd.<br />
Outer Edges Landscaping Inc.<br />
Prospect Canada Inc.<br />
RCX Logistics Ltd.<br />
Redcliffe Realty Advisors Inc.<br />
Relwin Holdings Ltd.<br />
Siemens Laserworks Inc.<br />
Spectrum Supply Chain Solutions Inc.<br />
SREIT (Quest Foothills) Ltd.<br />
Strategic Group<br />
Trueman Distribution Ltd.<br />
Supreme Windows<br />
United Agri Products Canada Inc.<br />
Voit Real Estate Services<br />
Weston Bakery Limited<br />
WestRim Contractors Ltd..<br />
CMN <strong>Calgary</strong> Inc.<br />
200, 10500 - 48th Street SE • <strong>Calgary</strong>, AB • T2C 2B8 • T (403) 266-5544 F (403) 705-0477<br />
Our Knowledge is your Property ®<br />
This report and other research materials may be found on our website at www.colliers.com. Questions related to information herein should be directed to the Research Department at the<br />
number indicated above. This document has been prepared by <strong>Colliers</strong> <strong>International</strong> for advertising and general information only. <strong>Colliers</strong> <strong>International</strong> makes no guarantees, representations or<br />
warranties of any kind, express or implied, regarding the information including, but not limited to, warranties of content, accuracy and reliability. Any interested party should undertake their own<br />
inquiries as to the accuracy of the information. <strong>Colliers</strong> <strong>International</strong> excludes unequivocally all inferred or implied terms, conditions and warranties arising out of this document and excludes<br />
all liability for loss and damages arising there from.