Varian Cary Eclipse Fluorescence Spectrophotometer ... - (MISC) Lab
Varian Cary Eclipse Fluorescence Spectrophotometer ... - (MISC) Lab
Varian Cary Eclipse Fluorescence Spectrophotometer ... - (MISC) Lab

Create successful ePaper yourself
Turn your PDF publications into a flip-book with our unique Google optimized e-Paper software.
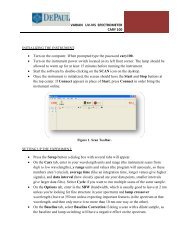
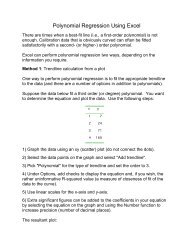
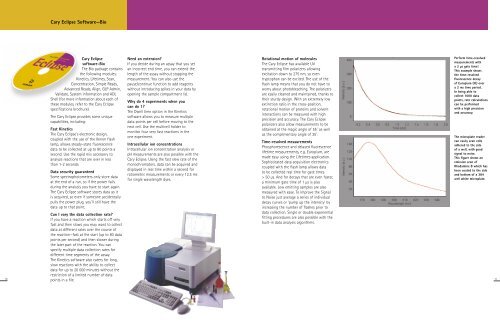
<strong>Cary</strong> <strong>Eclipse</strong> Software—<br />
something for everyone<br />
Single window<br />
operation: All controls<br />
can be accessed from<br />
this window, making<br />
operation quick<br />
and easy.<br />
Having trouble figuring<br />
out what a particular<br />
button or control does<br />
Just hold the mouse<br />
pointer over the object<br />
until the hint text pops<br />
up with an explanation.<br />
Power-users can use<br />
the built-in<br />
spectroscopy language,<br />
the Applications<br />
Development Language<br />
(ADL), to automate<br />
your laboratory’s<br />
measurements.<br />
Not-so-power-users<br />
can download these<br />
highly customized<br />
methods from<br />
<strong>Varian</strong>’s website<br />
www.varianinc.com<br />
Create an icon for your<br />
common measurements.<br />
A double-click on the<br />
icon loads the<br />
appropriate application<br />
and method.<br />
The <strong>Cary</strong> <strong>Eclipse</strong> can<br />
email you when the<br />
data collection is<br />
finished-with or without<br />
the data file attached.<br />
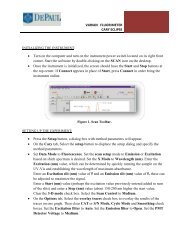
The <strong>Cary</strong> <strong>Eclipse</strong><br />
software features<br />
toolbars to give you<br />
quick access to the<br />
most common graphics<br />
and report operations,<br />
including: zooming,<br />
cursor, adding text,<br />
changing axis ranges,<br />
drawing contours, and<br />
previewing reports.<br />
Status display shows<br />
you the current<br />
instrument parameters<br />
at a glance.<br />
You can store all<br />
method and report<br />
parameters,<br />
calculations and<br />
graphical displays and<br />
the actual data in one<br />
file. This saves time as<br />
you simply recall one<br />
file instead of several.<br />
Data can be<br />
automatically exported<br />
to a spread sheet at the<br />
end of the measurement.<br />
Prepare to publish!<br />
You can cut and paste<br />
graphs from the <strong>Cary</strong><br />
<strong>Eclipse</strong> software into<br />
any word processing<br />
package, including any<br />
bitmaps or text you<br />
may have added to<br />
the graph.<br />
The <strong>Cary</strong> <strong>Eclipse</strong><br />
software includes<br />
step-by-step video<br />
clips for hardware<br />
installation and use.<br />
6 7