Preparation of iron oxide nanoparticles supported ... - ScienceDirect
Preparation of iron oxide nanoparticles supported ... - ScienceDirect
Preparation of iron oxide nanoparticles supported ... - ScienceDirect

You also want an ePaper? Increase the reach of your titles
YUMPU automatically turns print PDFs into web optimized ePapers that Google loves.
Wei-Wen Liu et al. / New Carbon Materials, 2011, 26(4): 255–261<br />
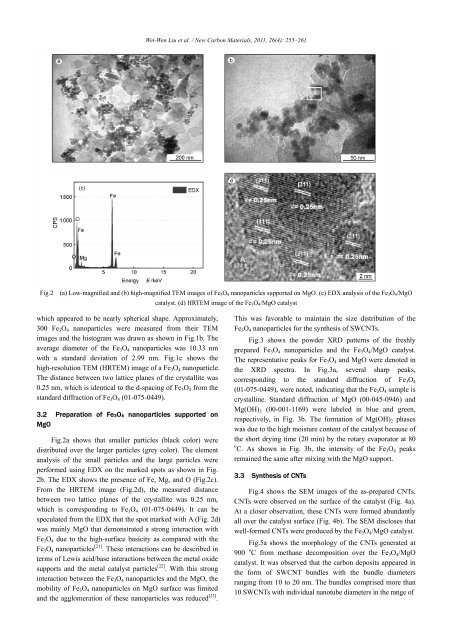
Fig.2 (a) Low-magnified and (b) high-magnified TEM images <strong>of</strong> Fe 3 O 4 <strong>nanoparticles</strong> <strong>supported</strong> on MgO. (c) EDX analysis <strong>of</strong> the Fe 3 O 4 /MgO<br />
catalyst. (d) HRTEM image <strong>of</strong> the Fe 3 O 4 /MgO catalyst<br />
which appeared to be nearly spherical shape. Approximately,<br />
300 Fe 3 O 4 <strong>nanoparticles</strong> were measured from their TEM<br />
images and the histogram was drawn as shown in Fig.1b. The<br />
average diameter <strong>of</strong> the Fe 3 O 4 <strong>nanoparticles</strong> was 10.33 nm<br />
with a standard deviation <strong>of</strong> 2.99 nm. Fig.1c shows the<br />
high-resolution TEM (HRTEM) image <strong>of</strong> a Fe 3 O 4 nanoparticle.<br />
The distance between two lattice planes <strong>of</strong> the crystallite was<br />
0.25 nm, which is identical to the d-spacing <strong>of</strong> Fe 3 O 4 from the<br />
standard diffraction <strong>of</strong> Fe 3 O 4 (01-075-0449).<br />
3.2 <strong>Preparation</strong> <strong>of</strong> Fe3O4 <strong>nanoparticles</strong> <strong>supported</strong> on<br />
MgO<br />
Fig.2a shows that smaller particles (black color) were<br />
distributed over the larger particles (grey color). The element<br />
analysis <strong>of</strong> the small particles and the large particles were<br />
performed using EDX on the marked spots as shown in Fig.<br />
2b. The EDX shows the presence <strong>of</strong> Fe, Mg, and O (Fig.2c).<br />
From the HRTEM image (Fig.2d), the measured distance<br />
between two lattice planes <strong>of</strong> the crystallite was 0.25 nm,<br />
which is corresponding to Fe 3 O 4 (01-075-0449). It can be<br />
speculated from the EDX that the spot marked with A (Fig. 2d)<br />
was mainly MgO that demonstrated a strong interaction with<br />
Fe 3 O 4 due to the high-surface basicity as compared with the<br />
Fe 3 O 4 <strong>nanoparticles</strong> [21] . These interactions can be described in<br />
terms <strong>of</strong> Lewis acid/base interactions between the metal <strong>oxide</strong><br />
supports and the metal catalyst particles [22] . With this strong<br />
interaction between the Fe 3 O 4 <strong>nanoparticles</strong> and the MgO, the<br />
mobility <strong>of</strong> Fe 3 O 4 <strong>nanoparticles</strong> on MgO surface was limited<br />
and the agglomeration <strong>of</strong> these <strong>nanoparticles</strong> was reduced [23] .<br />
This was favorable to maintain the size distribution <strong>of</strong> the<br />
Fe 3 O 4 <strong>nanoparticles</strong> for the synthesis <strong>of</strong> SWCNTs.<br />
Fig.3 shows the powder XRD patterns <strong>of</strong> the freshly<br />
prepared Fe 3 O 4 <strong>nanoparticles</strong> and the Fe 3 O 4 /MgO catalyst.<br />
The representative peaks for Fe 3 O 4 and MgO were denoted in<br />
the XRD spectra. In Fig.3a, several sharp peaks,<br />
corresponding to the standard diffraction <strong>of</strong> Fe 3 O 4<br />
(01-075-0449), were noted, indicating that the Fe 3 O 4 sample is<br />
crystalline. Standard diffraction <strong>of</strong> MgO (00-045-0946) and<br />
Mg(OH) 2 (00-001-1169) were labeled in blue and green,<br />
respectively, in Fig. 3b. The formation <strong>of</strong> Mg(OH) 2 phases<br />
was due to the high moisture content <strong>of</strong> the catalyst because <strong>of</strong><br />
the short drying time (20 min) by the rotary evaporator at 80<br />
o C. As shown in Fig. 3b, the intensity <strong>of</strong> the Fe 3 O 4 peaks<br />
remained the same after mixing with the MgO support.<br />
3.3 Synthesis <strong>of</strong> CNTs<br />
Fig.4 shows the SEM images <strong>of</strong> the as-prepared CNTs.<br />
CNTs were observed on the surface <strong>of</strong> the catalyst (Fig. 4a).<br />
At a closer observation, these CNTs were formed abundantly<br />
all over the catalyst surface (Fig. 4b). The SEM discloses that<br />
well-formed CNTs were produced by the Fe 3 O 4 /MgO catalyst.<br />
Fig.5a shows the morphology <strong>of</strong> the CNTs generated at<br />
900 o C from methane decomposition over the Fe 3 O 4 /MgO<br />
catalyst. It was observed that the carbon deposits appeared in<br />
the form <strong>of</strong> SWCNT bundles with the bundle diameters<br />
ranging from 10 to 20 nm. The bundles comprised more than<br />
10 SWCNTs with individual nanotube diameters in the range <strong>of</strong>