Comparison of TOA and Surface Radiation between ... - ceres - NASA
Comparison of TOA and Surface Radiation between ... - ceres - NASA
Comparison of TOA and Surface Radiation between ... - ceres - NASA

Create successful ePaper yourself
Turn your PDF publications into a flip-book with our unique Google optimized e-Paper software.
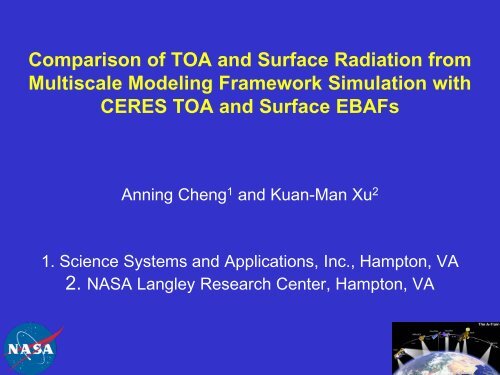
<strong>Comparison</strong> <strong>of</strong> <strong>TOA</strong> <strong>and</strong> <strong>Surface</strong> <strong>Radiation</strong> from<br />
Multiscale Modeling Framework Simulation with<br />
CERES <strong>TOA</strong> <strong>and</strong> <strong>Surface</strong> EBAFs<br />
Anning Cheng 1 <strong>and</strong> Kuan-Man Xu 2<br />
1. Science Systems <strong>and</strong> Applications, Inc., Hampton, VA<br />
2. <strong>NASA</strong> Langley Research Center, Hampton, VA
Multiscale Modeling Framework<br />
(Grabowski 2001; Khairoutdinov <strong>and</strong> R<strong>and</strong>all 2001)<br />
A CRM is embedded at each grid<br />
column (~100s km) <strong>of</strong> the host GCM to<br />
represent cloud physical processes<br />
The CRM explicitly simulates cloudscale<br />
dynamics (~1s km) <strong>and</strong><br />
processes<br />
Periodic lateral boundary condition for<br />
CRM (not extend to the edges)<br />
Upgraded CRM with a third-order turbulence closure (IPHOC):<br />
Double-Gaussian distribution <strong>of</strong> liquid-water potential temperature, total water mixing<br />
ratio <strong>and</strong> vertical velocity<br />
Skewnesses, i.e., the three third-order moments, predicted<br />
All first-, second-, third- <strong>and</strong> fourth-order moments, subgrid-scale condensation <strong>and</strong><br />
buoyancy based on the same PDF<br />
G(q t )<br />
q s<br />
q t
MMF climate simulation<br />
• The model, SPCAM-IPHOC, is Community Atmosphere Model<br />
version 3.5 with finite-volume dynamic core as the host GCM.<br />
• The CRM is the 2-D version <strong>of</strong> System for Atmospheric Modeling<br />
(SAM) with IPHOC higher-order turbulence closure, the grid<br />
spacing is 4 km, with 32 columns within a GCM grid box.<br />
• Simulation IP-12L: SPCAM-IPHOC with grid spacing <strong>of</strong> 1.9°x2.5°;<br />
doubling the number <strong>of</strong> levels below 700 hPa (6 to 12); the total<br />
number <strong>of</strong> vertical layers is 32. The simulation is forced with<br />
climatological SST <strong>and</strong> sea ice distributions.<br />
• Simulation duration is 10 years; with last nine years analyzed (Xu<br />
<strong>and</strong> Cheng 2012; J. Climate, submitted).<br />
.
Annual mean biases vs CMIP3 & CMIP5<br />
Biases relative to CERES-EBAF version 2.6<br />
CMIP3 (IPCC AR4) <strong>and</strong> CMIP5 (IPCC AR5) model ensembles; plots<br />
were provided by Frank Li <strong>of</strong> JPL.<br />
Liquid water path is compared with SSM/I.<br />
Total cloud amount is compared with CloudSat, CALIPSO, CERES<br />
<strong>and</strong> MODIS merged data (C3M; Kato et al. 2010, 2011).
LW radiative flux biases @ <strong>TOA</strong>
SW radiative flux biases @ <strong>TOA</strong>
Liquid water paths: CMIP3, CMIP5, MMF
Total cloud amount from MMF <strong>and</strong> C3M
Global Seasonal Climatology<br />
December-February (DJF) <strong>and</strong> June-August (JJA)<br />
Cloud radiative effects at the <strong>TOA</strong> <strong>and</strong> surface: CERES EBAF<br />
version 2.6 (<strong>TOA</strong>) <strong>and</strong> surface EBAF2.6<br />
Move your eyelids up & down: top panel for MMF, bottom panel for<br />
EBAF<br />
Global means, correlations <strong>and</strong> root-mean-square (RMS) errors
SW cloud radiative effect @ <strong>TOA</strong>
LW cloud radiative effect @ <strong>TOA</strong>
SW cloud radiative effect @ surface
LW cloud radiative effect @ surface
The Eastern Pacific Seasonal Cycle<br />
All four seasons (DJF, MAM, JJA, <strong>and</strong> SON)<br />
Precipitation observations: Global Precipitation Climatology Project<br />
(GPCP; Adler et al. 2003)<br />
Low-level cloud amount: CloudSat, CALIPSO, CERES <strong>and</strong> MODIS<br />
merged data (C3M; Kato et al. 2010, 2011)<br />
Cloud radiative effects at the <strong>TOA</strong> <strong>and</strong> surface: CERES EBAF<br />
version 2.6 (<strong>TOA</strong>) <strong>and</strong> surface EBAF2.6<br />
MMF simulation, top panel; Observations, bottom panel.<br />
Domain means, correlation <strong>and</strong> root-mean-square (RMS) errors
E. Pac. surface precipitation, MMF v GPCP
E. Pac. low cloud amount, MMF vs. C3M
E. Pac. SW cloud radiative effect @ <strong>TOA</strong>
E. Pac. LW cloud radiative effect @ <strong>TOA</strong>
E. Pac. SW cloud radia. effect @ surface
Wind, SST <strong>and</strong> SST difference
E. Pac. LW cloud radia. effect @ surface
Summary <strong>and</strong> conclusions<br />
• The MMF climate simulation has biases that are<br />
comparable to (slightly smaller) CMIP3 <strong>and</strong> CMIP5<br />
ensembles; but it reduces regional biases associated<br />
with low-level clouds.<br />
• The seasonal climatology agrees with both <strong>TOA</strong><br />
EBAF <strong>and</strong> surface EBAF very well, but noticeable<br />
differences exist in the high latitudes when compared<br />
to surface EBAF-beta.<br />
• The seasonal cycle <strong>of</strong> the eastern Pacific is rather<br />
well simulated, except for the exact locations <strong>of</strong> lowlevel<br />
clouds in the southeastern Pacific <strong>and</strong><br />
overestimated intensity <strong>of</strong> deep convection.