New Analysis of a Rat Feeding Study with a Genetically Modified ...
New Analysis of a Rat Feeding Study with a Genetically Modified ...
New Analysis of a Rat Feeding Study with a Genetically Modified ...

Create successful ePaper yourself
Turn your PDF publications into a flip-book with our unique Google optimized e-Paper software.
10.1007/s00244-006-0149-5<br />
16.03.2007 11:31 Uhr<br />
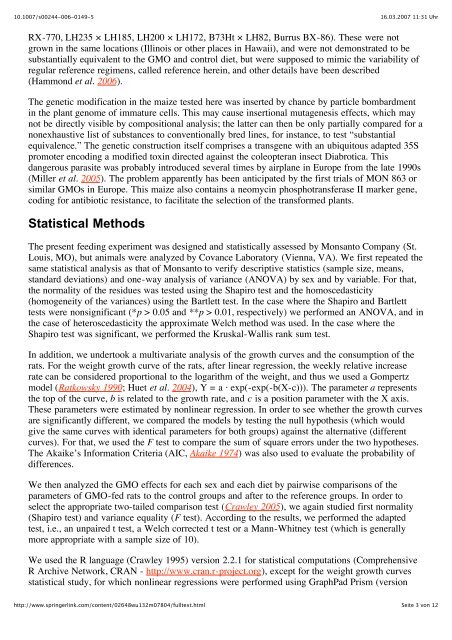
RX-770, LH235 × LH185, LH200 × LH172, B73Ht × LH82, Burrus BX-86). These were not<br />
grown in the same locations (Illinois or other places in Hawaii), and were not demonstrated to be<br />
substantially equivalent to the GMO and control diet, but were supposed to mimic the variability <strong>of</strong><br />
regular reference regimens, called reference herein, and other details have been described<br />
(Hammond et al. 2006).<br />
The genetic modification in the maize tested here was inserted by chance by particle bombardment<br />
in the plant genome <strong>of</strong> immature cells. This may cause insertional mutagenesis effects, which may<br />
not be directly visible by compositional analysis; the latter can then be only partially compared for a<br />
nonexhaustive list <strong>of</strong> substances to conventionally bred lines, for instance, to test “substantial<br />
equivalence.” The genetic construction itself comprises a transgene <strong>with</strong> an ubiquitous adapted 35S<br />
promoter encoding a modified toxin directed against the coleopteran insect Diabrotica. This<br />
dangerous parasite was probably introduced several times by airplane in Europe from the late 1990s<br />
(Miller et al. 2005). The problem apparently has been anticipated by the first trials <strong>of</strong> MON 863 or<br />
similar GMOs in Europe. This maize also contains a neomycin phosphotransferase II marker gene,<br />
coding for antibiotic resistance, to facilitate the selection <strong>of</strong> the transformed plants.<br />
Statistical Methods<br />
The present feeding experiment was designed and statistically assessed by Monsanto Company (St.<br />
Louis, MO), but animals were analyzed by Covance Laboratory (Vienna, VA). We first repeated the<br />
same statistical analysis as that <strong>of</strong> Monsanto to verify descriptive statistics (sample size, means,<br />
standard deviations) and one-way analysis <strong>of</strong> variance (ANOVA) by sex and by variable. For that,<br />
the normality <strong>of</strong> the residues was tested using the Shapiro test and the homoscedasticity<br />
(homogeneity <strong>of</strong> the variances) using the Bartlett test. In the case where the Shapiro and Bartlett<br />
tests were nonsignificant (*p > 0.05 and **p > 0.01, respectively) we performed an ANOVA, and in<br />
the case <strong>of</strong> heteroscedasticity the approximate Welch method was used. In the case where the<br />
Shapiro test was significant, we performed the Kruskal-Wallis rank sum test.<br />
In addition, we undertook a multivariate analysis <strong>of</strong> the growth curves and the consumption <strong>of</strong> the<br />
rats. For the weight growth curve <strong>of</strong> the rats, after linear regression, the weekly relative increase<br />
rate can be considered proportional to the logarithm <strong>of</strong> the weight, and thus we used a Gompertz<br />
model (<strong>Rat</strong>kowsky 1990; Huet et al. 2004), Y = a · exp(-exp(-b(X-c))). The parameter a represents<br />
the top <strong>of</strong> the curve, b is related to the growth rate, and c is a position parameter <strong>with</strong> the X axis.<br />
These parameters were estimated by nonlinear regression. In order to see whether the growth curves<br />
are significantly different, we compared the models by testing the null hypothesis (which would<br />
give the same curves <strong>with</strong> identical parameters for both groups) against the alternative (different<br />
curves). For that, we used the F test to compare the sum <strong>of</strong> square errors under the two hypotheses.<br />
The Akaike’s Information Criteria (AIC, Akaike 1974) was also used to evaluate the probability <strong>of</strong><br />
differences.<br />
We then analyzed the GMO effects for each sex and each diet by pairwise comparisons <strong>of</strong> the<br />
parameters <strong>of</strong> GMO-fed rats to the control groups and after to the reference groups. In order to<br />
select the appropriate two-tailed comparison test (Crawley 2005), we again studied first normality<br />
(Shapiro test) and variance equality (F test). According to the results, we performed the adapted<br />
test, i.e., an unpaired t test, a Welch corrected t test or a Mann-Whitney test (which is generally<br />
more appropriate <strong>with</strong> a sample size <strong>of</strong> 10).<br />
We used the R language (Crawley 1995) version 2.2.1 for statistical computations (Comprehensive<br />
R Archive Network, CRAN - http://www.cran.r-project.org), except for the weight growth curves<br />
statistical study, for which nonlinear regressions were performed using GraphPad Prism (version<br />
http://www.springerlink.com/content/02648wu132m07804/fulltext.html<br />
Seite 3 von 12