Financial Statements of - Shoppers Drug Mart
Financial Statements of - Shoppers Drug Mart
Financial Statements of - Shoppers Drug Mart

Create successful ePaper yourself
Turn your PDF publications into a flip-book with our unique Google optimized e-Paper software.
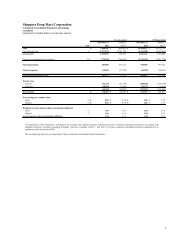
SHOPPERS DRUG MART CORPORATION<br />
Notes to the Condensed Consolidated <strong>Financial</strong> <strong>Statements</strong><br />
(unaudited)<br />
(in thousands <strong>of</strong> Canadian dollars, except per share data)<br />
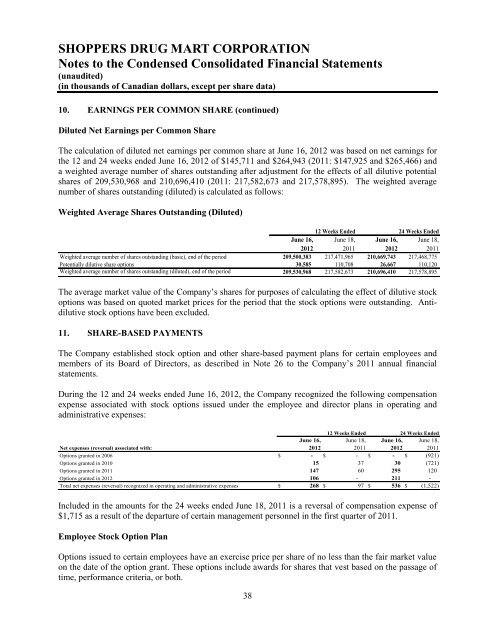
10. EARNINGS PER COMMON SHARE (continued)<br />
Diluted Net Earnings per Common Share<br />
The calculation <strong>of</strong> diluted net earnings per common share at June 16, 2012 was based on net earnings for<br />
the 12 and 24 weeks ended June 16, 2012 <strong>of</strong> $145,711 and $264,943 (2011: $147,925 and $265,466) and<br />
a weighted average number <strong>of</strong> shares outstanding after adjustment for the effects <strong>of</strong> all dilutive potential<br />
shares <strong>of</strong> 209,530,968 and 210,696,410 (2011: 217,582,673 and 217,578,895). The weighted average<br />
number <strong>of</strong> shares outstanding (diluted) is calculated as follows:<br />
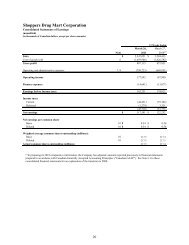
Weighted Average Shares Outstanding (Diluted)<br />
12 Weeks Ended<br />
24 Weeks Ended<br />
June 16, June 18, June 16, June 18,<br />
2012 2011 2012 2011<br />
Weighted average number <strong>of</strong> shares outstanding (basic), end <strong>of</strong> the period 209,500,383 217,471,965 210,669,743 217,468,775<br />
Potentially dilutive share options 30,585 110,708 26,667 110,120<br />
Weighted average number <strong>of</strong> shares outstanding (diluted), end <strong>of</strong> the period 209,530,968 217,582,673 210,696,410 217,578,895<br />
The average market value <strong>of</strong> the Company’s shares for purposes <strong>of</strong> calculating the effect <strong>of</strong> dilutive stock<br />
options was based on quoted market prices for the period that the stock options were outstanding. Antidilutive<br />
stock options have been excluded.<br />
11. SHARE-BASED PAYMENTS<br />
The Company established stock option and other share-based payment plans for certain employees and<br />
members <strong>of</strong> its Board <strong>of</strong> Directors, as described in Note 26 to the Company’s 2011 annual financial<br />
statements.<br />
During the 12 and 24 weeks ended June 16, 2012, the Company recognized the following compensation<br />
expense associated with stock options issued under the employee and director plans in operating and<br />
administrative expenses:<br />
12 Weeks Ended<br />
24 Weeks Ended<br />
June 16, June 18, June 16, June 18,<br />
Net expenses (reversal) associated with:<br />
2012 2011 2012 2011<br />
Options granted in 2006 $ - $ - $ - $ (921)<br />
Options granted in 2010 15 37 30 (721)<br />
Options granted in 2011 147 60 295 120<br />
Options granted in 2012 106 - 211 -<br />
Total net expenses (reversal) recognized in operating and administrative expenses $ 268 $ 97 $ 536 $ (1,522)<br />
Included in the amounts for the 24 weeks ended June 18, 2011 is a reversal <strong>of</strong> compensation expense <strong>of</strong><br />
$1,715 as a result <strong>of</strong> the departure <strong>of</strong> certain management personnel in the first quarter <strong>of</strong> 2011.<br />
Employee Stock Option Plan<br />
Options issued to certain employees have an exercise price per share <strong>of</strong> no less than the fair market value<br />
on the date <strong>of</strong> the option grant. These options include awards for shares that vest based on the passage <strong>of</strong><br />
time, performance criteria, or both.<br />
38