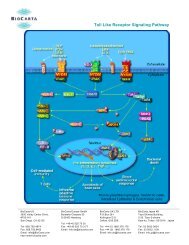
View - BioCarta
View - BioCarta
View - BioCarta

Create successful ePaper yourself
Turn your PDF publications into a flip-book with our unique Google optimized e-Paper software.
STORAGE and STABILITY<br />
Store the kit in the dark at 2 - 8° C (in refrigerator). CELL CULTURE INSERTS and multiwell plates can be stored at room temperature.<br />
The fMLP and vital DNA STAINING SOLUTION have to be discarded after use. The reagents are supplied sterile with a preservative that does<br />
not influence the chemotactic function of granulocytes. The reagents are stable for the period shown on the packaging label, when stored as<br />
described.<br />
ASSAY PROCEDURE<br />
1. Preparations:<br />
1.1. Dilute the stock solutions with INCUBATION BUFFER: - fMLP stock solution, 1 : 200 (volume as needed, e.g., 5 µl in 1 ml, 350 µl<br />
per test). – vital DNA STAINING SOLUTION, 1 : 50 (e.g., 5 µl in 250 µl, 20 µl per test)<br />
1.2. Prewarm water bath to 37°C (precise temperature control!).<br />
1.3. Prepare ice bath.<br />
1.4. Switch on and calibrate the flow cytometer.<br />
2. Leukocyte isolation:<br />
Collect 5 ml of heparinized blood from each patient and control person to be examined. Obtain blood with standard aseptic techniques.<br />
DO NOT USE blood anticoagulated by EDTA or citric acid!<br />
2.1. Carefully overlay 1 ml of heparinized whole blood on top of the leukocyte SEPARATION MEDIUM.<br />
2.2. The vial is left motionless at room temperature. After 40 min the following phases have formed: upper phase containing leukocytes<br />
and platelets (leukocyte-rich plasma = LRP) and lower phase containing erythrocytes. The sedimentation of erythrocytes takes a<br />
longer time when using older blood samples.<br />
2.3. Remove approx. 500 µl of the leukocyte-rich plasma, pipette the cell suspension into one 1 ml or 2 ml test tube. The isolated cells<br />
should be used within 1 hour for the chemotaxis assay.<br />
3. MIGRATEST set-up:<br />
3.1 Prepare the following samples for each patient or control person by pipetting INCUBATION BUFFER or fMLP working solution into<br />
two wells of a multiwell plate:<br />
Negative control sample: 350 µl INCUBATION BUFFER<br />
Positive control (test) sample: 350 µl of the fMLP working solution<br />
3.2 Place cell culture inserts into both wells. Add 100 µl of leukocyte-rich plasma into each cell culture insert.<br />
3.3 Incubation:<br />
The multiwell plate is incubated for 30 min at 37°C in a water bath without shaking.<br />
3.4 Precisely at the end of the incubation time remove the cell culture inserts from the multiwell plate. Add the cell suspensions from both<br />
wells of the multiwell plate to two separate 5 ml tubes (tube 1 and tube 2) and place the tubes on ice. In addition, unstimulated cells<br />
from the leucocyte-rich plasma serve as LECAM-1 control. For this purpose, mix 20 µl of the cell suspension from the cell culture<br />
insert of the negative control sample with 350 µl of INCUBATION BUFFER and transfer this mixture to a third 5 ml tube<br />
(tube 3).<br />
3.5 Labelling with STAINING/COUNTING REAGENT:<br />
Add 20 µl of STAINING/COUNTING REAGENT to each tube<br />
(3 tubes per patient). Vortex and incubate the tubes for 10 min in an ice bath, covered to prevent exposure to light.<br />
3.6 Vital staining:<br />
Add 20 µl of 1 x vital DNA STAINING SOLUTION per tube, mix and incubate 5 min on ice<br />
(light protected in the ice bath). Measure the cell suspension within 120 min.<br />
4. Flow cytometric analysis:<br />
Cells are analysed by flow cytometry using the blue-green excitation light (488 nm argon-ion laser, e.g., FACSCalibur_, CellQuest_ Software).<br />
Measurement:<br />
Acquire data by using fluorescence triggering in the FL3 channel, set a first region 1 on leukocytes and counting beads (dot plot diagram<br />
SSC/FL3, see Fig. 1A, 1B).<br />
After activating a gate on region 1, set a second region 2 around the counting beads (dot plot diagram SSC/FSC, see Fig. 2A, 2B); start<br />
acquisition and end data acquisition by count, acquire exactly 2,000 events so that the amount of granulocytes in the control sample can be<br />
compared with the number of granulocytes in the positive control sample after stimulation with fMLP. Set a third region 3 around the<br />
population of granulocytes (dot plot diagram SSC/FSC, see Fig. 2A, 2B).<br />
For reseach use only. Not for therapeutic or in vitro diagnostic use. Page - 2 -<br />
Revised 6/02