View - BioCarta
View - BioCarta
View - BioCarta

Create successful ePaper yourself
Turn your PDF publications into a flip-book with our unique Google optimized e-Paper software.
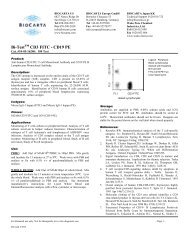
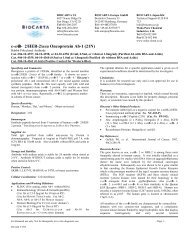
Fig. 3: FL1 histograms during data analysis, gate set on combination of region 1 and 3<br />
A) FL1 histogram of the granulocyte population in region 3, LECAM-1 control sample<br />
B) B) FL1 histogram of the granulocyte population in region 3, test sample<br />
Note: Increase of the percentage of activated cells showing a reduced expression of LECAM-1. FL1 corresponds to green<br />
fluorescence (bandpass filter 530 +/- 15 nm)<br />
3 A 3 B<br />
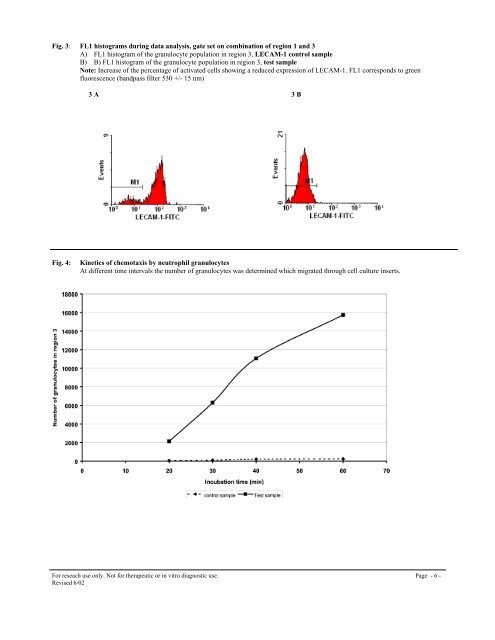
Fig. 4:<br />
Kinetics of chemotaxis by neutrophil granulocytes<br />
At different time intervals the number of granulocytes was determined which migrated through cell culture inserts.<br />
For reseach use only. Not for therapeutic or in vitro diagnostic use. Page - 6 -<br />
Revised 6/02