PHILIPPINES RATTAN VALUE CHAIN STUDY - About the Philippines
PHILIPPINES RATTAN VALUE CHAIN STUDY - About the Philippines
PHILIPPINES RATTAN VALUE CHAIN STUDY - About the Philippines

Create successful ePaper yourself
Turn your PDF publications into a flip-book with our unique Google optimized e-Paper software.
2.5 DESTINATION AND CONCENTRATION OF SALES AMONG<br />
MAJOR BUYERS AND TYPES OF BUYERS<br />
It is estimated that 80 to 90 percent of raw rattan poles go into exported furniture. A decade ago when cheap, low<br />
quality furniture started to flood exports markets from China and Indonesia, <strong>the</strong> <strong>Philippines</strong> successfully positioned its<br />
furniture with customers who care more about quality and fashion than price. The <strong>Philippines</strong> enjoys having skilled<br />
craftsmen who are reputed to be among <strong>the</strong> world’s best. Through excellent design flair, <strong>the</strong> <strong>Philippines</strong> is considered<br />
to be a trendsetter among furniture-producing countries in Asia earning <strong>the</strong> title “Milan of Asia.” This strategy has not<br />
been as successful in <strong>the</strong> past few years. One Cebu-based manufacturer explained that foreign buyers are now shunning<br />
rattan in favor of o<strong>the</strong>r materials. Simply put, rattan is not as fashionable as it used to be and has lost its appeal<br />
among rich aficionados due to <strong>the</strong> cheapening of rattan furniture, which can be found in so many lower priced retail<br />
outlets in <strong>the</strong> West. Table 1 shows <strong>the</strong> main export destinations for <strong>Philippines</strong> furniture.<br />
Table 1: Main Export Destinations of Philippine Furniture (US$1000s)*<br />
Country Year 2002 Percentage<br />
United States 210,028 66.5<br />
Japan 20,063 6.3<br />
United Kingdom 8,671 2.7<br />
Australia 6,549 2.1<br />
Saudi Arabia 6,250 2.0<br />
France 6,001 1.9<br />
Ne<strong>the</strong>rlands 5,611 1.8<br />
O<strong>the</strong>r countries 52,842 16.7<br />
TOTAL 316,015 100.0<br />
* These are overall furniture sales, which include rattan, mixed media with rattan, and nonrattan. Rattan as a contribution to overall<br />
furniture is about 45 to 50 percent.<br />
Although <strong>the</strong> value per unit of rattan furniture has increased, <strong>the</strong> <strong>Philippines</strong> overall has had diminishing market share.<br />
The Philippine world market share is 0.4 percent compared with China’s 12.6 percent. During <strong>the</strong> 1980s, <strong>the</strong> country<br />
was <strong>the</strong> largest exporter of furniture in Sou<strong>the</strong>ast Asia. Today, <strong>the</strong> country ranks a poor fifth among Sou<strong>the</strong>ast Asian<br />
countries behind Malaysia, Indonesia, Thailand, and Vietnam. Furniture ranks seventh among <strong>the</strong> <strong>Philippines</strong>’ nontraditional<br />
exports. The <strong>Philippines</strong>’ domestic sales of rattan furniture have generally been cheap, lower-quality furniture,<br />
given most Filipinos cannot afford <strong>the</strong> high-end designs. The best quality rattan poles flow to export furniture<br />
production that reinforces <strong>the</strong> low quality of domestically available furniture.<br />
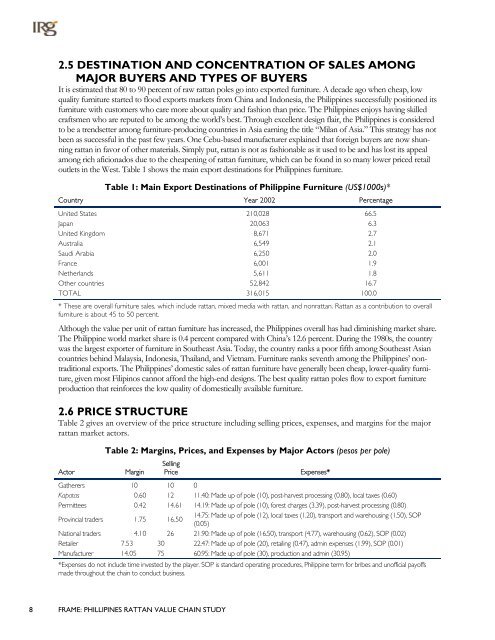
2.6 PRICE STRUCTURE<br />
Table 2 gives an overview of <strong>the</strong> price structure including selling prices, expenses, and margins for <strong>the</strong> major<br />
rattan market actors.<br />
Table 2: Margins, Prices, and Expenses by Major Actors (pesos per pole)<br />
Actor<br />
Margin<br />
Selling<br />
Price<br />
Expenses*<br />
Ga<strong>the</strong>rers 10 10 0<br />
Kapatas 0.60 12 11.40: Made up of pole (10), post-harvest processing (0.80), local taxes (0.60)<br />
Permittees 0.42 14.61 14.19: Made up of pole (10), forest charges (3.39), post-harvest processing (0.80)<br />
Provincial traders 1.75 16.50<br />
14.75: Made up of pole (12), local taxes (1.20), transport and warehousing (1.50), SOP<br />
(0.05)<br />
National traders 4.10 26 21.90: Made up of pole (16.50), transport (4.77), warehousing (0.62), SOP (0.02)<br />
Retailer 7.53 30 22.47: Made up of pole (20), retailing (0.47), admin expenses (1.99), SOP (0.01)<br />
Manufacturer 14.05 75 60.95: Made up of pole (30), production and admin (30.95)<br />
*Expenses do not include time invested by <strong>the</strong> player. SOP is standard operating procedures, Philippine term for bribes and unofficial payoffs<br />
made throughout <strong>the</strong> chain to conduct business.<br />
8 FRAME: PHILLIPINES <strong>RATTAN</strong> <strong>VALUE</strong> <strong>CHAIN</strong> <strong>STUDY</strong>