annual report: air traffic statistics - civil aviation authority of botswana ...
annual report: air traffic statistics - civil aviation authority of botswana ...
annual report: air traffic statistics - civil aviation authority of botswana ...

You also want an ePaper? Increase the reach of your titles
YUMPU automatically turns print PDFs into web optimized ePapers that Google loves.
Released by<br />
Civil Aviation Authority <strong>of</strong> Botswana<br />
Department <strong>of</strong> Air Transport<br />
August 2011<br />
1
Enquiries should be made to:<br />
ANNUAL REPORT:<br />
AIR TRAFFIC STATISTICS - 2010<br />
Civil Aviation Authority <strong>of</strong> Botswana (CAAB)<br />
Department <strong>of</strong> Air Transport<br />
P.O BOX 250<br />
Gaborone, Botswana<br />
Telephone: +267 3688200<br />
Fax: +267 3953517<br />
August 2011<br />
COPYRIGHT RESERVED<br />
Extracts may be published if<br />
source is duly acknowledged<br />
2
TABLE OF CONTENTS<br />
TABLE OF CONTENTS............................................................................................................................................... 3<br />
Section 1: Introduction ............................................................................................................................................... 4<br />
1.1 Introduction ................................................................................................................................................ 4<br />
1.2 Aerodromes index............................................................................................................................................. 5<br />
Section 2: Air Traffic Trends 1999-2010....................................................................................................................... 6<br />
2.1 Aircraft movement trends 1999-2010................................................................................................................ 6<br />
2.2 Passenger movement trends 1999-2010............................................................................................................ 6<br />
2.3 Aircraft movement by <strong>air</strong>port: 1999-2010 ......................................................................................................... 7<br />
2.4 Passenger movement by <strong>air</strong>port: 1999-2010 ..................................................................................................... 8<br />
Section 3: Air Transport activity by <strong>air</strong>port – 2010 ...................................................................................................... 9<br />
Section 4: Seasonal Variation in <strong>air</strong>craft & passenger movement- 2010.................................................................... 10<br />
4.1 Aircraft movement trend by type <strong>of</strong> movement .............................................................................................. 10<br />
4.2 Aircraft movement trend by <strong>air</strong>port................................................................................................................. 10<br />
4.3 Passenger movement trend by type <strong>of</strong> movement .......................................................................................... 11<br />
4.4 Passenger movement trend by <strong>air</strong>port ............................................................................................................ 11<br />
Section 5: Aircraft & Passenger Movement by type <strong>of</strong> Operation -2010 .................................................................... 13<br />
5.1 Aircraft movement by type <strong>of</strong> operation.......................................................................................................... 13<br />
5.2 Aircraft movement by type <strong>of</strong> movement, operation and by <strong>air</strong>port ................................................................ 13<br />
5.3 Passenger movement by type <strong>of</strong> operation ..................................................................................................... 14<br />
5.4 Passenger movement by type <strong>of</strong> movement, operation and by <strong>air</strong>port............................................................ 15<br />
Section 6: Cargo and mail volume ............................................................................................................................. 16<br />
Section 7: Over-flights movement <strong>statistics</strong> - 2010.................................................................................................... 17<br />
7.1 Over flights <strong>air</strong>craft movement <strong>statistics</strong> by month.......................................................................................... 17<br />
7.2 Over flights <strong>air</strong>craft movement <strong>statistics</strong> by flight rule..................................................................................... 17<br />
7.3 Over flights <strong>air</strong>craft movement <strong>statistics</strong> by weight and type <strong>of</strong> operation – 2010 ........................................... 18<br />
3
1.1 Introduction<br />
Section 1: Introduction<br />
This <strong>report</strong> presents Air Traffic Statistics for the year 2010. The <strong>statistics</strong> <strong>report</strong>ed covers <strong>air</strong>craft and<br />
passenger movements, cargo and over flights movement <strong>statistics</strong>.<br />
The <strong>report</strong> covers six main <strong>air</strong>ports operated by Civil Aviation Authority <strong>of</strong> Botswana (CAAB), namely Sir<br />
Seretse Khama International Airport (SSKIA), which is located in the capital city Gaborone, Maun, Ghanzi,<br />
Francistown, Kasane and Selebi Phikwe. Maun and Kasane <strong>air</strong>ports in the northern part <strong>of</strong> the country play<br />
a vital role in providing <strong>air</strong> transport service for tourism in the Okavango Delta and Chobe area. SSKIA is<br />
designed to handle B -747 or equivalent class <strong>air</strong>craft and the terminal building is designed to handle a<br />
Typical Peak Hour Passenger <strong>of</strong> 976, both domestic and international. There are 19 government <strong>air</strong>fields<br />
around the country, however the <strong>statistics</strong> presented in this <strong>report</strong> does not cover such <strong>air</strong>fields.<br />
Five international <strong>air</strong> carriers are operating scheduled passenger services to Botswana, and these are: Air<br />
Botswana, Kenya Airways, South African Airways and South African Express Airways operating at SSKIA,<br />
and Air Namibia operating at Maun <strong>air</strong>port. Domestic <strong>air</strong> transport activity is focused in Gaborone,<br />
Francistown and Maun while international travel is mainly between Gaborone and Johannesburg. Other<br />
international connections are Maun – Johannesburg, Kasane – Johannesburg, Francistown – Johannesburg,<br />
Gaborone –Harare, Gaborone – N<strong>air</strong>obi and Maun – Windhoek.<br />
Aircraft and passenger movement data is received from CAAB‘s <strong>of</strong>fices located at the <strong>air</strong>ports. Data is<br />
recorded daily on the <strong>air</strong>craft movement log sheets. The data is then summarized to monthly <strong>statistics</strong> and is<br />
submitted to CAAB Head Office for collation. International and Domestic <strong>air</strong> <strong>traffic</strong> <strong>statistics</strong> are classified<br />
according to; scheduled, non-scheduled and private operations. Air cargo and mail <strong>statistics</strong> is collected from<br />
Air Botswana at SSKIA where it is mostly concentrated.<br />
4
1.2 Aerodromes index<br />
5
Section 2: Air Traffic Trends 1999-2010<br />
2.1 Aircraft movement trends 1999-2010<br />
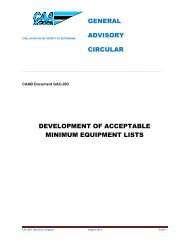
Figure 1 below indicates <strong>air</strong>craft movement <strong>statistics</strong> trend from 1999 -2010 and this covers commercial<br />
scheduled, commercial non-scheduled and private movements. The total number <strong>of</strong> <strong>air</strong>craft movements (all<br />
<strong>air</strong>ports) has been declining from 1999 to 2002. From 2003, the movements grew gradually until 2009. The<br />
graph also indicates a sharp drop from 2009-2010.A sharp decline in 2009-2010 is mainly accounted for by a<br />
decline in non-scheduled commercial movements that resulted from most likely the economic recession<br />
which affect adversely the tourism sector <strong>of</strong> the country.<br />
Figure 1: Aircraft Movement trends: 1999-2010<br />
no o f ai r c r a f t m o v e m e n t s<br />
1 2 0 ,0 0 0<br />
1 0 0 ,0 0 0<br />
8 0 ,0 0 0<br />
6 0 ,0 0 0<br />
4 0 ,0 0 0<br />
2 0 ,0 0 0<br />
-<br />
1 9 9 9 2 0 0 0 2 0 0 1 2 0 0 2 2 0 0 3 2 0 0 4 2 0 0 5 2 0 0 6 2 0 0 7 2 0 0 8 2 0 0 9 2 0 1 0<br />
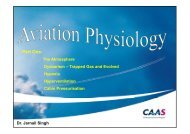
2.2 Passenger movement trends 1999-2010<br />
Passenger movement trend shows that the number <strong>of</strong> passengers using <strong>air</strong> transport has been increasing<br />
gradually since 1999 from around 400,000 in 1999 to about 700, 000 in 2010.<br />
Figure 2: Passenger Movement trends: 1999-2010<br />
no <strong>of</strong> p a s s e n g e r m o v e m e n t s<br />
9 0 0 ,0 0 0<br />
8 0 0 ,0 0 0<br />
7 0 0 ,0 0 0<br />
6 0 0 ,0 0 0<br />
5 0 0 ,0 0 0<br />
4 0 0 ,0 0 0<br />
3 0 0 ,0 0 0<br />
2 0 0 ,0 0 0<br />
1 0 0 ,0 0 0<br />
-<br />
Y e ar<br />
<strong>air</strong>c raft m o ve m e n ts<br />
1 9 9 9 2 0 0 0 2 0 0 1 2 0 0 2 2 0 0 3 2 0 0 4 2 0 0 5 2 0 0 6 2 0 0 7 2 0 0 8 2 0 0 9 2 0 1 0<br />
ye ar<br />
no <strong>of</strong> passe nge r move me nts<br />
6
2.3 Aircraft movement by <strong>air</strong>port: 1999-2010<br />
Table 1a shows the total <strong>air</strong>craft movement by <strong>air</strong>port from 1999- 2000 whereas Table 1b reveals <strong>air</strong>craft<br />
movement <strong>annual</strong> growth rate for each <strong>air</strong>port. From 1999-2002 <strong>air</strong>craft movements generally declined in all<br />
<strong>air</strong>ports and grew steadily from 2003 to 2009. The total <strong>air</strong>craft movements declined by 25.7% in 2010 as a<br />
result <strong>of</strong> a significant drop in Maun <strong>air</strong>port <strong>of</strong> 40.6%. The decline in Maun is mainly attributed to a decline in<br />
non-scheduled commercial movements that resulted from most likely the economic recession which affect<br />
adversely the tourism sector <strong>of</strong> the country.<br />
Table 1a: Aircraft movement by <strong>air</strong>port: 1999 – 2010<br />
Airport<br />
Year SSKIA Maun Kasane F/Town S/Phikwe Ghanzi Total<br />
1999 18,193 36,615 9,072 3,778 1,455 721 69,834<br />
2000 17,471 36,205 7,964 3,715 1,066 530 66,951<br />
2001 16,187 34,364 7,805 4,018 935 530 63,839<br />
2002 17,041 29,887 7,987 3,042 734 421 59,112<br />
2003 16,591 30,854 9,502 3,986 732 461 62,126<br />
2004 17,593 35,176 10,568 3,824 727 461 68,349<br />
2005 19,632 32,907 8,581 3,973 689 436 66,218<br />
2006 18,737 39,430 12,920 4,520 459 324 76,390<br />
2007 15,848 41,781 13,068 4,838 496 376 76,407<br />
2008 15,238 59,982 12,951 4,417 517 385 93,490<br />
2009 14,645 69,485 10,335 3,363 451 296 98,586<br />
2010 15,719 41,245 12,279 3,296 413 309 73,261<br />
N:B <strong>statistics</strong> exclude millitary movements<br />
Table 1b Annual growth rates by <strong>air</strong>port - Aircraft movements: 2000 – 2010<br />
Airport<br />
Year SSKIA Maun Kasane F/Town S/Phikwe Ghanzi Total<br />
2000 -4.0 -1.1 -12.2 -1.7 -26.7 -26.5 -4.1<br />
2001 -7.3 -5.1 -2.0 8.2 -12.3 0.0 -4.6<br />
2002 5.3 -13.0 2.3 -24.3 -21.5 -20.6 -7.4<br />
2003 -2.6 3.2 19.0 31.0 -0.3 9.5 5.1<br />
2004 6.0 14.0 11.2 -4.1 -0.7 0.0 10.0<br />
2005 11.6 -6.5 -18.8 3.9 -5.2 -5.4 -3.1<br />
2006 -4.6 19.8 50.6 13.8 -33.4 -25.7 15.4<br />
2007 -15.4 6.0 1.1 7.0 8.1 16.0 0.0<br />
2008 -3.8 43.6 -0.9 -8.7 4.2 2.4 22.4<br />
2009 -3.9 15.8 -20.2 -23.9 -12.8 -23.1 5.5<br />
2010 7.3 -40.6 18.8 -2.0 -8.4 4.4 -25.7<br />
7
2.4 Passenger movement by <strong>air</strong>port: 1999-2010<br />
Table 2a shows the total passenger movement by <strong>air</strong>port from 1999- 2000 and Table 2b shows the passenger<br />
movement <strong>annual</strong> growth rate by <strong>air</strong>port. Sir Seretse Khama International Airport (SSKIA) is generally<br />
growing <strong>annual</strong>ly as shown in Table 2b. A decline <strong>of</strong> 2.1% is observed only in 2006. The smallest <strong>air</strong>ports,<br />
Selibe -Phikwe and Ghanzi experienced a serious <strong>annual</strong> decline in passenger movement during the <strong>report</strong>ing<br />
period. The decline in <strong>traffic</strong> for Selibe Phikwe is attributed to production decline at a nearby copper mine<br />
and the removal <strong>of</strong> <strong>air</strong> services by Air Botswana. In case <strong>of</strong> Ghanzi the decline is probably due to the<br />
completion <strong>of</strong> the trans-Kalahari highway as well as the removal <strong>of</strong> <strong>air</strong> services by Air Botswana.<br />
Table 2a Passenger movement by <strong>air</strong>port: 1999 – 2010<br />
Airport<br />
Year SSKIA Maun Kasane F/Town S/Phikwe Ghanzi Total<br />
1999 227,181 139,377 30,674 23,639 3,954 2,531 427,356<br />
2000 237,493 154,485 30,879 25,219 3,605 1,809 453,490<br />
2001 238,935 151,817 34,300 26,277 3,474 1,473 456,276<br />
2002 265,658 143,077 38,531 26,907 2,554 1,413 478,140<br />
2003 270,020 138,289 40,837 29,796 2,342 1,456 482,740<br />
2004 290,464 156,043 48,206 35,047 2,406 1,518 533,684<br />
2005 295,891 168,834 52,226 32,574 1,826 999 552,350<br />
2006 289,550 183,580 57,985 33,243 1,584 1,116 567,058<br />
2007 314,669 191,928 57,320 42,732 1,654 1,382 609,685<br />
2008 337,969 238,542 62,162 49,453 1,546 725 690,397<br />
2009 374,214 270,750 55,757 45,277 1,389 676 748,063<br />
2010 425,845 207,671 67,633 47,332 1,248 533 750,262<br />
N:B <strong>statistics</strong> exclude millitary movements<br />
Table 2b Annual growth rates by <strong>air</strong>port- Passenger movements: 2000 – 2010<br />
Year SSKIA Maun<br />
Airport<br />
Kasane F/Town S/Phikwe Ghanzi Total<br />
2000 4.5 10.8 0.7 6.7 -8.8 -28.5 6.1<br />
2001 0.6 -1.7 11.1 4.2 -3.6 -18.6 0.6<br />
2002 11.2 -5.8 12.3 2.4 -26.5 -4.1 4.8<br />
2003 1.6 -3.3 6.0 10.7 -8.3 3.0 1.0<br />
2004 7.6 12.8 18.0 17.6 2.7 4.3 10.6<br />
2005 1.9 8.2 8.3 -7.1 -24.1 -34.2 3.5<br />
2006 -2.1 8.7 11.0 2.1 -13.3 11.7 2.7<br />
2007 8.7 4.5 -1.1 28.5 4.4 23.8 7.5<br />
2008 7.4 24.3 8.4 15.7 -6.5 -47.5 13.2<br />
2009 10.7 13.5 -10.3 -8.4 -10.2 -6.8 8.4<br />
2010 13.8 -23.3 21.3 4.5 -10.2 -21.2 0.3<br />
8
Section 3: Air Transport activity by <strong>air</strong>port – 2010<br />
Table 3 shows that commercial domestic movements accounted for 72% while commercial international<br />
<strong>air</strong>craft movements stands at 22.5% <strong>of</strong> the total movements in 2010. Non - commercial <strong>air</strong>craft movements<br />
were only 5.4% <strong>of</strong> the total movements.<br />
Maun recorded the largest number <strong>of</strong> commercial domestic <strong>air</strong>craft movements (37,860) followed by Kasane<br />
<strong>air</strong>port. This is attributed to a higher number <strong>of</strong> non-scheduled <strong>air</strong>craft movements in Maun due to tourist<br />
activities in the region. Sir Seretse Khama International Airport dominates the commercial international<br />
<strong>air</strong>craft movements by a total <strong>of</strong> 9,009 movements. Selibe Phikwe and Ghanzi had the least total number<br />
<strong>air</strong>craft movements compared to other <strong>air</strong>ports. Overall Maun had the highest number <strong>of</strong> <strong>air</strong>craft movements.<br />
The total commercial domestic passenger movements accounted for 46.5% compared to commercial<br />
international movements (52.4%) and non commercial movements (1.1%).<br />
Maun handled the largest proportion <strong>of</strong> the commercial domestic passenger movements with a total <strong>of</strong><br />
163,186 followed by SSKIA. SSKIA dominates the commercial international passenger movements by a<br />
total <strong>of</strong> 323,707 movements. The second highest is Maun <strong>air</strong>port with a total <strong>of</strong> 44,287 passengers in 2010.<br />
The pattern <strong>of</strong> passenger movement mirrors that <strong>of</strong> <strong>air</strong>craft movements, showing SSKIA dominating the<br />
international movements and Maun dominating the domestic movements.<br />
Table 3: Air <strong>traffic</strong> <strong>statistics</strong> by type <strong>of</strong> movement & <strong>air</strong>port -2010<br />
Airport Aircraft movement Passenger movement<br />
Commercial Non Grand % <strong>of</strong> Commercial Non Grand % <strong>of</strong><br />
Dome. Int'l. Total comm. Total total Dome. Int'l. Total comm. Total total<br />
SSKIA 4,397 9,009 13,406 2,313 15,719 22.0 97,239 323,707 420,946 4,899 425,845 55.8<br />
Maun 37,860 3,205 41,065 180 41,245 54.5 163,186 44,287 207,473 198 207,671 27.3<br />
Kasane 8,521 3,464 11,985 294 12,279 17.0 50,437 16,910 67,347 286 67,633 9.3<br />
F/Town 1,745 767 2,512 784 3,296 5.3 37,229 8,138 45,367 1,965 47,332 7.1<br />
S/Phikwe 43 43 86 327 413 0.7 156 145 301 947 1,248 0.4<br />
Ghanzi 207 13 220 89 309 0.4 362 56 418 115 533 0.1<br />
Total 52,773 16,501 69,274 3,987 73,261 100.0 348,609 393,243 741,852 8,410 750,262 100.0<br />
% <strong>of</strong> total 72.0 22.5 5.4 100 46.5 52.4 1.1 100<br />
non-commercial covers private movements only<br />
9
Section 4: Seasonal Variation in <strong>air</strong>craft & passenger movement- 2010<br />
4.1 Aircraft movement trend by type <strong>of</strong> movement<br />
Figure 3 shows the trend in <strong>air</strong>craft movement from January 2010 to December 2010. There has been an<br />
increase in the number <strong>of</strong> <strong>air</strong>craft movements from March – May 2010. This was attributed to a significant<br />
growth for domestic movements. Both International and domestic movements peaked in August and then<br />
dropped until December 2010.<br />
Figure 3: Aircraft movement trend<br />
A i r c r a f t m o v e m e n t<br />
1 2 0 0 0<br />
1 0 0 0 0<br />
8 0 0 0<br />
6 0 0 0<br />
4 0 0 0<br />
2 0 0 0<br />
0<br />
Jan Fe b M ar A p r M ay Ju n Ju l A u g S e p O c t N o v D e c<br />
4.2 Aircraft movement trend by <strong>air</strong>port<br />
Figure 4a and 4b below indicates the trend in <strong>air</strong>craft movement by <strong>air</strong>port during the <strong>report</strong>ing period.<br />
Maun, Kasane and SSKIA reached a peak in August 2010. Maun then declined sharply in September. The<br />
lowest movements were in February 2010 in most <strong>of</strong> the <strong>air</strong>ports and this is also reflected by the overall total<br />
in Figure 1. In Selibe phikwe and Ghanzi the movements peaked in November and February respectively.<br />
Figure 4a: Aircraft movement trend by <strong>air</strong>port<br />
A i r c r a f t m o v e m e n t<br />
7 0 0 0<br />
6 0 0 0<br />
5 0 0 0<br />
4 0 0 0<br />
3 0 0 0<br />
2 0 0 0<br />
1 0 0 0<br />
0<br />
m o n t h 2 0 1 0<br />
In te r n atio n al D o m e stic To tal<br />
Ja n-10 F eb-10 M a r-10 A pr-10 M a y-10 Jun-10 Jul-10 A ug -10 S ep-10 O ct-10 N ov-10 Dec-10<br />
M onth Y e ar<br />
F/town K asan e M au n SSK IA<br />
10
Figure 4b: Aircraft movement trend by <strong>air</strong>port<br />
4.3 Passenger movement trend by type <strong>of</strong> movement<br />
Passenger movement pattern is slightly similar to that <strong>of</strong> <strong>air</strong>craft movements. Figure 5 shows that both<br />
domestic and international passenger movements reached a peak in August and declined gradually until<br />
December 2010. The graph further reveals that the lowest number <strong>of</strong> passenger movements were in February<br />
for international movements and May for domestic movements.<br />
Figure 5: Passenger movement trend -2010<br />
P a s s e n g e r m o v e m e n t<br />
ai rcr af t mo v e m e n t<br />
70<br />
60<br />
50<br />
40<br />
30<br />
20<br />
10<br />
0<br />
1 2 0 ,0 0 0<br />
1 0 0 ,0 0 0<br />
8 0 ,0 0 0<br />
6 0 ,0 0 0<br />
4 0 ,0 0 0<br />
2 0 ,0 0 0<br />
-<br />
Jan-10 Feb-10 Mar-10 Apr-10 May-10 Jun-10 Jul-10 Aug-10 Sep-10 Oct-10 Nov-10 Dec-10<br />
month year<br />
S/Phikwe Ghanzi<br />
Ja n -1 0 F e b -1 0 M a r-1 0 A p r-1 0 M a y-1 0 Ju n -1 0 Ju l-1 0 A u g -1 0 S e p -1 0 O ct-1 0 N o v-1 0 D e c-1 0<br />
In te r n a tio n a l D o m e stic To ta l<br />
4.4 Passenger movement trend by <strong>air</strong>port<br />
Figure 5a shows that SSKIA had the highest number <strong>of</strong> passenger movements followed by Maun <strong>air</strong>port.<br />
Passenger movements increased in SSKIA and Maun <strong>air</strong>ports between February and May. The movements<br />
peaked in August 2010 and generally dropped until December. Selibe Phikwe and Ghanzi show a different<br />
pattern. The movements in Selibe Phikwe and Ghanzi peaked in October, November respectively and<br />
dropped sharply in December.<br />
11
Figure 5a: Passenger movement trend by <strong>air</strong>port<br />
Passenger mo veme nt<br />
70000<br />
60000<br />
50000<br />
40000<br />
30000<br />
20000<br />
10000<br />
0<br />
Jan-10 Feb-10 Mar-10 Apr-10 May-10 Jun-10 Jul-10 Aug-10 Sep-10 Oct-10 Nov-10 Dec-10<br />
Figure 5b: Passenger movement trend by <strong>air</strong>port<br />
pa s se n g e r m o v e m e n t<br />
180<br />
160<br />
140<br />
120<br />
100<br />
80<br />
60<br />
40<br />
20<br />
0<br />
Month year<br />
F/town Kasane Maun SSKIA<br />
Jan-10 Feb-10 Mar-10 Apr-10 May-10 Jun-10 Jul-10 Aug-10 Sep-10 Oct-10 Nov-10 Dec-10<br />
m onth year<br />
S/Phikwe Ghanzi<br />
12
Section 5: Aircraft & Passenger Movement by type <strong>of</strong> Operation -2010<br />
5.1 Aircraft movement by type <strong>of</strong> operation<br />
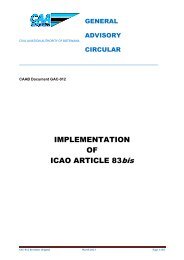
Figure 6 indicates <strong>air</strong>craft movement by type <strong>of</strong> operation during the year 2010. Scheduled international<br />
<strong>air</strong>craft movements are higher (10,022 ) compared to non- scheduled and private service operations,<br />
accounting for 55% <strong>of</strong> the total international movements. For domestic movements, non-scheduled <strong>air</strong>craft<br />
movements are dominant (47,059) compared to scheduled and private operations. This is attributed to a high<br />
number <strong>of</strong> non- scheduled flights in Maun area. For both international and domestic movements, private<br />
flight operations are the least. Overall non- scheduled flights movements are higher compared to scheduled<br />
and private operations.<br />
Figure 6: Aircraft movement by type <strong>of</strong> Operation<br />
Aircraft movement<br />
60,000<br />
50,000<br />
40,000<br />
30,000<br />
20,000<br />
10,000<br />
-<br />
47,059<br />
15,736<br />
10,022<br />
6,479<br />
1,621<br />
5,714<br />
2,366 3,987<br />
5.2 Aircraft movement by type <strong>of</strong> movement, operation and by <strong>air</strong>port<br />
Table 3 compares <strong>air</strong>craft movement by type <strong>of</strong> movement and operation between the six main <strong>air</strong>ports.<br />
International scheduled <strong>air</strong>craft movements are higher at SSKIA (7,947) followed by Maun <strong>air</strong>port, whereas<br />
international non-scheduled movements are dominated by Kasane <strong>air</strong>port (3,082) followed by Maun <strong>air</strong>port.<br />
SSKIA had the highest number <strong>of</strong> private passenger movement followed by F/Town <strong>air</strong>port.<br />
SSKIA leads domestic scheduled <strong>air</strong>craft movements by a total <strong>of</strong> 2,572 movements, whereas domestic non<br />
scheduled movements are dominated by Maun <strong>air</strong>port followed by Kasane. SSKIA also leads the private<br />
domestic movements followed by Francistown <strong>air</strong>port. Overall SSKIA dominates scheduled and private<br />
passenger movements whereas Maun dominates non-scheduled <strong>air</strong>craft movements.<br />
53,538<br />
International Domestic Total<br />
Scheduled Non-Scheduled Private<br />
13
Table 4: Aircraft movement by type <strong>of</strong> movement, operation and by <strong>air</strong>port<br />
SSKIA Maun Kasane F/town S/phikwe Ghanzi Total<br />
INTERNATIONAL Scheduled 7,947 1,469 382 224 - - 10,022<br />
Non Scheduled 1,062 1,736 3,082 543 43 13 6,479<br />
Private 1,069 13 94 297 134 14 1,621<br />
Total 10,078 3,218 3,558 1,064 177 27 18,122<br />
DOMESTIC Scheduled 2,572 1,455 741 946 - - 5,714<br />
Non Scheduled 1,825 36,405 7,780 799 43 207 47,059<br />
Private 1,244 167 200 487 193 75 2,366<br />
Total 5,641 38,027 8,721 2,232 236 282 55,139<br />
TOTAL Scheduled 10,519 2,924 1,123 1,170 - - 15,736<br />
Non Scheduled 2,887 38,141 10,862 1,342 86 220 53,538<br />
Private 2,313 180 294 784 327 89 3,987<br />
Total 15,719 41,245 12,279 3,296 413 309 73,261<br />
NB: millitary movements excluded<br />
5.3 Passenger movement by type <strong>of</strong> operation<br />
For international and domestic movements, scheduled passenger movements are the highest, followed by<br />
non-scheduled operations (Figure 7). Overall the number <strong>of</strong> scheduled passenger movement is dominant.<br />
Figure 7: Passenger movement by type <strong>of</strong> operation<br />
Passenger movement<br />
600,000<br />
500,000<br />
400,000<br />
300,000<br />
200,000<br />
100,000<br />
-<br />
347,010<br />
46,233<br />
195,750<br />
152,859<br />
542,760<br />
199,092<br />
3,532 4,878 8,410<br />
International Domestic Total<br />
Scheduled Non-Scheduled Private<br />
14
5.4 Passenger movement by type <strong>of</strong> movement, operation and by <strong>air</strong>port<br />
The same pattern reflected by international <strong>air</strong>craft movements features for passenger movements.<br />
International scheduled passenger movements are higher at SSKIA followed by Maun <strong>air</strong>port, whereas<br />
international non-scheduled movements are dominated by Kasane <strong>air</strong>port (Table 5). SSKIA had the highest<br />
number <strong>of</strong> private passenger movement followed by Francistown <strong>air</strong>port.<br />
SSKIA had the highest number <strong>of</strong> domestic scheduled passenger movement, whereas domestic non<br />
scheduled movements are dominated by Maun <strong>air</strong>port followed by Kasane. SSKIA also leads the private<br />
domestic movements followed by Francistown <strong>air</strong>port.<br />
Overall SSKIA leads the scheduled and the private passenger movements whereas Maun dominates the nonscheduled<br />
passenger movements.<br />
Table 5: Passenger movement by type <strong>of</strong> movement, operation and by <strong>air</strong>port<br />
SSKIA Maun Kasane F/town S/phikwe Ghanzi Total<br />
INTERNATIONAL Scheduled 291,349 40,479 8,873 6,309 - - 347,010<br />
Non Scheduled 32,358 3,808 8,037 1,829 145 56 46,233<br />
Private 2,113 37 75 846 438 23 3,532<br />
Total 325,820 44,324 16,985 8,984 583 79 396,775<br />
DOMESTIC Scheduled 89,932 53,510 18,378 33,930 - - 195,750<br />
Non Scheduled 7,307 109,676 32,059 3,299 156 362 152,859<br />
Private 2,786 161 211 1,119 509 92 4,878<br />
Total 100,025 163,347 50,648 38,348 665 454 353,487<br />
TOTAL Scheduled 381,281 93,989 27,251 40,239 - - 542,760<br />
Non Scheduled 39,665 113,484 40,096 5,128 301 418 199,092<br />
Private 4,899 198 286 1,965 947 115 8,410<br />
Total 425,845 207,671 67,633 47,332 1,248 533 750,262<br />
NB: millitary movements excluded<br />
15
Section 6: Cargo and mail volume<br />
The total amount <strong>of</strong> cargo and mail handled from 2006-2010 is shown in Table 6. The total cargo volume has<br />
been declining gradually since 2006. Domestic cargo volume increased by 11.9% while international cargo<br />
volume dropped by 59.3% in 2010 compared to 2009.<br />
Mail handling is mainly domestic volume with an increase <strong>of</strong> 71% in 2010.<br />
Table 6: Mail and cargo volume (kgs)<br />
Cargo (kgs) 2006 2007 2008 2009 2010<br />
Domestic movement 222,208 250,202 227,521 232,490 260,244<br />
International movement 798,084 847,995 840,318 704,397 286,871<br />
Total 1,020,292 1,098,197 1,067,839 936,887 547,115<br />
Mail (kgs)<br />
Domestic movements 1,919 1,306 1,429 1,683 2,878<br />
International movement 164 35 26 0 0<br />
Total 2,083 1,341 1,455 1,683 2,878<br />
16
Section 7: Over-flights movement <strong>statistics</strong> - 2010<br />
7.1 Over flights <strong>air</strong>craft movement <strong>statistics</strong> by month<br />
Table 7 shows that the total number <strong>of</strong> en route movement <strong>statistics</strong> was 46,578 in 2010. June had the<br />
largest number <strong>of</strong> over flights movements and the second highest is July. This was attributed to the world<br />
cup event which was held in South Africa. The movement generally went up by 7.2% in 2010 compared to<br />
2009.<br />
Table 7: Over flights <strong>air</strong>craft movement <strong>statistics</strong> by month 2009 – 2010<br />
Month 2009 % 2010 % Growth rate(%)<br />
Jan 3,278 7.5 3,385 7.3 3.3<br />
Feb 3,052 7.0 3,340 7.2 9.4<br />
Mar 3,488 8.2 4,342 9.3 24.5<br />
Apr 3,560 8.2 3,684 7.9 3.5<br />
May 3,588 8.3 3,921 8.4 9.3<br />
Jun 3,732 8.3 4,349 9.3 16.5<br />
Jul 3,740 8.6 4,321 9.3 15.5<br />
Aug 4,024 9.3 3,684 7.9 -8.4<br />
Sep 3,807 8.8 3,910 8.4 2.7<br />
Oct 4,035 9.3 3,977 8.5 -1.4<br />
Nov 3,633 8.5 3,928 8.4 8.1<br />
Dec 3,513 8.1 3,737 8.0 6.4<br />
Total 43,450 100 46,578 100 7.2<br />
7.2 Over flights <strong>air</strong>craft movement <strong>statistics</strong> by flight rule<br />
The distribution <strong>of</strong> over flights <strong>air</strong>craft movement <strong>statistics</strong> by flight rule shows that majority (96.1%) <strong>of</strong> the<br />
<strong>air</strong>crafts used instrument flight rule and only a few used visual flight rule during the year 2010.<br />
Table 8: Over flights <strong>air</strong>craft movement <strong>statistics</strong> by flight rule<br />
2009 % 2010 %<br />
IFR 41,802 96.3 44,697 96.1<br />
VFR 1,615 3.7 1,813 3.9<br />
Total 43,417 100.0 46,510 100<br />
IFR- Instrument flight rules, VFR - Visual flight rules<br />
17
7.3 Over flights <strong>air</strong>craft movement <strong>statistics</strong> by weight and type <strong>of</strong> operation – 2010<br />
Most <strong>of</strong> the <strong>air</strong>crafts using Botswana <strong>air</strong>space are scheduled operations. Over flight movement <strong>statistics</strong> also shows<br />
that majority are <strong>of</strong> medium weight followed by heavy weight.<br />
Table 9: Over flights <strong>air</strong>craft movement <strong>statistics</strong> by weight and type <strong>of</strong> operation - 2010<br />
Scheduled Non scheduled Total<br />
Heavy 13,220 1,138 14,358<br />
Medium 18,574 5,445 24,019<br />
Light 877 4,720 5,597<br />
Total 32,671 11,303 43,974<br />
18