an exploratory study of indian foreign trade - JAES | Journal of ...
an exploratory study of indian foreign trade - JAES | Journal of ...
an exploratory study of indian foreign trade - JAES | Journal of ...
You also want an ePaper? Increase the reach of your titles
YUMPU automatically turns print PDFs into web optimized ePapers that Google loves.
<strong>Journal</strong> <strong>of</strong> Applied Economic Sciences<br />
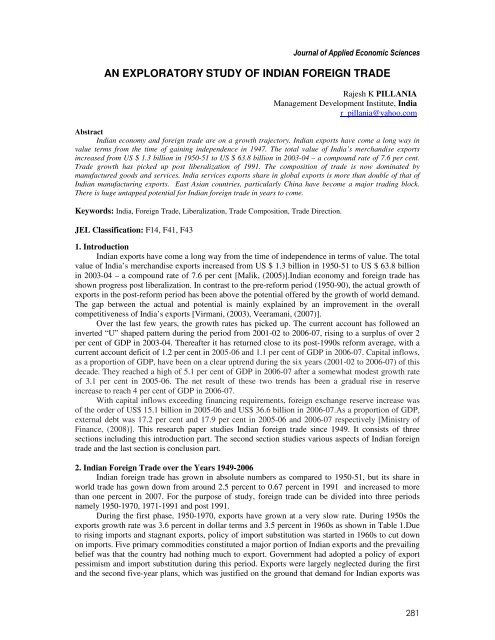
AN EXPLORATORY STUDY OF INDIAN FOREIGN TRADE<br />
Rajesh K PILLANIA<br />
M<strong>an</strong>agement Development Institute, India<br />
r_pill<strong>an</strong>ia@yahoo.com<br />
Abstract<br />
Indi<strong>an</strong> economy <strong>an</strong>d <strong>foreign</strong> <strong>trade</strong> are on a growth trajectory. Indi<strong>an</strong> exports have come a long way in<br />
value terms from the time <strong>of</strong> gaining independence in 1947. The total value <strong>of</strong> India’s merch<strong>an</strong>dise exports<br />
increased from US $ 1.3 billion in 1950-51 to US $ 63.8 billion in 2003-04 – a compound rate <strong>of</strong> 7.6 per cent.<br />
Trade growth has picked up post liberalization <strong>of</strong> 1991. The composition <strong>of</strong> <strong>trade</strong> is now dominated by<br />
m<strong>an</strong>ufactured goods <strong>an</strong>d services. India services exports share in global exports is more th<strong>an</strong> double <strong>of</strong> that <strong>of</strong><br />
Indi<strong>an</strong> m<strong>an</strong>ufacturing exports. East Asi<strong>an</strong> countries, particularly China have become a major trading block.<br />
There is huge untapped potential for Indi<strong>an</strong> <strong>foreign</strong> <strong>trade</strong> in years to come.<br />
Keywords: India, Foreign Trade, Liberalization, Trade Composition, Trade Direction.<br />
JEL Classification: F14, F41, F43<br />
1. Introduction<br />
Indi<strong>an</strong> exports have come a long way from the time <strong>of</strong> independence in terms <strong>of</strong> value. The total<br />
value <strong>of</strong> India’s merch<strong>an</strong>dise exports increased from US $ 1.3 billion in 1950-51 to US $ 63.8 billion<br />
in 2003-04 – a compound rate <strong>of</strong> 7.6 per cent [Malik, (2005)].Indi<strong>an</strong> economy <strong>an</strong>d <strong>foreign</strong> <strong>trade</strong> has<br />
shown progress post liberalization. In contrast to the pre-reform period (1950-90), the actual growth <strong>of</strong><br />
exports in the post-reform period has been above the potential <strong>of</strong>fered by the growth <strong>of</strong> world dem<strong>an</strong>d.<br />
The gap between the actual <strong>an</strong>d potential is mainly explained by <strong>an</strong> improvement in the overall<br />
competitiveness <strong>of</strong> India’s exports [Virm<strong>an</strong>i, (2003), Veeram<strong>an</strong>i, (2007)].<br />
Over the last few years, the growth rates has picked up. The current account has followed <strong>an</strong><br />
inverted “U” shaped pattern during the period from 2001-02 to 2006-07, rising to a surplus <strong>of</strong> over 2<br />
per cent <strong>of</strong> GDP in 2003-04. Thereafter it has returned close to its post-1990s reform average, with a<br />
current account deficit <strong>of</strong> 1.2 per cent in 2005-06 <strong>an</strong>d 1.1 per cent <strong>of</strong> GDP in 2006-07. Capital inflows,<br />
as a proportion <strong>of</strong> GDP, have been on a clear uptrend during the six years (2001-02 to 2006-07) <strong>of</strong> this<br />
decade. They reached a high <strong>of</strong> 5.1 per cent <strong>of</strong> GDP in 2006-07 after a somewhat modest growth rate<br />
<strong>of</strong> 3.1 per cent in 2005-06. The net result <strong>of</strong> these two trends has been a gradual rise in reserve<br />
increase to reach 4 per cent <strong>of</strong> GDP in 2006-07.<br />
With capital inflows exceeding fin<strong>an</strong>cing requirements, <strong>foreign</strong> exch<strong>an</strong>ge reserve increase was<br />
<strong>of</strong> the order <strong>of</strong> US$ 15.1 billion in 2005-06 <strong>an</strong>d US$ 36.6 billion in 2006-07.As a proportion <strong>of</strong> GDP,<br />
external debt was 17.2 per cent <strong>an</strong>d 17.9 per cent in 2005-06 <strong>an</strong>d 2006-07 respectively [Ministry <strong>of</strong><br />
Fin<strong>an</strong>ce, (2008)]. This research paper studies Indi<strong>an</strong> <strong>foreign</strong> <strong>trade</strong> since 1949. It consists <strong>of</strong> three<br />
sections including this introduction part. The second section studies various aspects <strong>of</strong> Indi<strong>an</strong> <strong>foreign</strong><br />
<strong>trade</strong> <strong>an</strong>d the last section is conclusion part.<br />
2. Indi<strong>an</strong> Foreign Trade over the Years 1949-2006<br />
Indi<strong>an</strong> <strong>foreign</strong> <strong>trade</strong> has grown in absolute numbers as compared to 1950-51, but its share in<br />
world <strong>trade</strong> has gown down from around 2.5 percent to 0.67 percent in 1991 <strong>an</strong>d increased to more<br />
th<strong>an</strong> one percent in 2007. For the purpose <strong>of</strong> <strong>study</strong>, <strong>foreign</strong> <strong>trade</strong> c<strong>an</strong> be divided into three periods<br />
namely 1950-1970, 1971-1991 <strong>an</strong>d post 1991.<br />
During the first phase, 1950-1970, exports have grown at a very slow rate. During 1950s the<br />
exports growth rate was 3.6 percent in dollar terms <strong>an</strong>d 3.5 percent in 1960s as shown in Table 1.Due<br />
to rising imports <strong>an</strong>d stagn<strong>an</strong>t exports, policy <strong>of</strong> import substitution was started in 1960s to cut down<br />
on imports. Five primary commodities constituted a major portion <strong>of</strong> Indi<strong>an</strong> exports <strong>an</strong>d the prevailing<br />
belief was that the country had nothing much to export. Government had adopted a policy <strong>of</strong> export<br />
pessimism <strong>an</strong>d import substitution during this period. Exports were largely neglected during the first<br />
<strong>an</strong>d the second five-year pl<strong>an</strong>s, which was justified on the ground that dem<strong>an</strong>d for Indi<strong>an</strong> exports was<br />
281
Volume III_Issue3 (5)_Fall2008<br />
inelastic. Whilst the world merch<strong>an</strong>dise export was growing at 6.3 per cent per <strong>an</strong>num during the<br />
1950s, exports from India stagnated. As the world merch<strong>an</strong>dise exports exp<strong>an</strong>ded relatively faster<br />
during the 1960s at 8.8 per cent per <strong>an</strong>num, the growth rate <strong>of</strong> India’s exports improved somewhat to<br />
3.6 per cent per <strong>an</strong>num. Clearly, the country failed to make the best use <strong>of</strong> the <strong>trade</strong> possibilities<br />
available during the 1950s <strong>an</strong>d 1960s [Singh, (1964); Bhagwati <strong>an</strong>d Srinivas<strong>an</strong>, (1975); Nayyar,<br />
(1976); Veeram<strong>an</strong>i, (2007)]. Several studies have argued that the import substitution policies had<br />
created a bias against exports in India. In spite <strong>of</strong> the various export promotion schemes adopted in the<br />
1970s <strong>an</strong>d 1980s, pr<strong>of</strong>itability in the heavily protected domestic market remained signific<strong>an</strong>tly higher<br />
th<strong>an</strong> that in the export market [Kathuria (1996), Veeram<strong>an</strong>i, (2007)].<br />
Annual<br />
Average<br />
Table1. Perform<strong>an</strong>ce <strong>of</strong> Trade Sector (Export <strong>an</strong>d Import) in India<br />
Perform<strong>an</strong>ce <strong>of</strong> Trade Sector (Export <strong>an</strong>d Import) in India<br />
(1950-1951 to 1999-2000)<br />
Growth Rate<br />
In Rupee Terms<br />
In US Dollar<br />
terms<br />
In Real terms<br />
(Volume)#<br />
As per cent to GDP<br />
Exports Imports Exports Imports Exports Imports Exports Imports<br />
(Exports+<br />
Imports)@<br />
1950-51 to<br />
1959-60<br />
3.6 6.1 3.6 6.1 3.0 4.1 5.1 6.7 11.8<br />
1960-61 to<br />
1969-70<br />
8.9 6.3 3.5 0.8 2.7 1.4 3.4 5.5 8.9<br />
1970-71 to<br />
1979-80<br />
16.8 20.7 15.8 20.1 7.3 6.7 4.5 5.3 9.8<br />
1980-81 to<br />
1989-90<br />
16.4 14.9 8.0 7.2 4.2 7.3 4.6 7.2 11.8<br />
1990-91 to<br />
1999-2000<br />
19.5 20.1 8.6 9.6 11.0 12.2 7.8 9.3 17.1<br />
1992-93 to<br />
1995-96<br />
24.7 26.8 15.7 17.5 17.5 21.3 8.1 9.0 17.1<br />
Note #: Refers to calendar year. Volume obtained by dividing value <strong>of</strong> exports (f.o.b) <strong>an</strong>d imports (c.i.f)<br />
with their respective unit prices. @: Figures may not add-up due to rounding <strong>of</strong>f.<br />
Source: Report on Currency <strong>an</strong>d Fin<strong>an</strong>ce (2002-03), Reserve B<strong>an</strong>k <strong>of</strong> India; IndiaStat Database (2008).<br />
During the period <strong>of</strong> 1970-1991 exports perform<strong>an</strong>ce improved. Government had taken<br />
initiatives in late 1960s like establishing Indi<strong>an</strong> Institute <strong>of</strong> Foreign Trade <strong>an</strong>d others for promoting<br />
<strong>foreign</strong> <strong>trade</strong>. The world economy was also growing fast in 1970s. The export growth rate was 15.8<br />
percent in 1970s before slowing down to 8 percent in 1980s.During 1970s, imports growth rate also<br />
picked up <strong>an</strong>d infact was higher th<strong>an</strong> growth rate <strong>of</strong> exports. The contribution <strong>of</strong> <strong>foreign</strong> <strong>trade</strong> to GDP<br />
again reached to 11.8 per cent, the same level as on 1950-51. The export boom <strong>of</strong> the 1970s, however,<br />
could not be maintained during the first half <strong>of</strong> the 1980s. As the growth rate <strong>of</strong> world exports turned<br />
negative in the aftermath <strong>of</strong> the second oil price hike, India’s exports decelerated sharply. During the<br />
second half <strong>of</strong> the 1980s, however, the world economy recovered <strong>an</strong>d India’s exports grew at a healthy<br />
pace (17.8 per cent). There was a genuine improvement in the export competitiveness <strong>of</strong> India during<br />
this period due to a major depreciation <strong>of</strong> the REER <strong>an</strong>d increased export subsidies. This period also<br />
witnessed some doses <strong>of</strong> industrial deregulation <strong>an</strong>d liberalization <strong>of</strong> capital goods imports [Joshi <strong>an</strong>d<br />
Little (1994); Veeram<strong>an</strong>i, (2007)].<br />
In the post liberalization period i.e. post 1991, export <strong>an</strong>d import growth has picked up <strong>an</strong>d the<br />
contribution <strong>of</strong> <strong>foreign</strong> <strong>trade</strong> to GDP has increased to 17.1 percent by 2000.However during the period<br />
import growth rates has been higher th<strong>an</strong> exports growth rates. M<strong>an</strong>y pro export policies were started<br />
after liberalization. Export promotion schemes prevalent during the post 1991 period include: export<br />
promotion capital goods (EPCG), duty entitlement passbook (DEPB), duty free replenishment<br />
certificate (DFRC), adv<strong>an</strong>ce licences, special import licence (SIL), exemption from income tax,<br />
sector/market-specific schemes [e g, market access initiative (MAI), towns <strong>of</strong> export excellence, agri<br />
export zones (AEZ), Focus Africa, <strong>an</strong>d Focus Latin Americ<strong>an</strong> Countries], <strong>an</strong>d schemes for status-<br />
282
<strong>Journal</strong> <strong>of</strong> Applied Economic Sciences<br />
holders, export oriented units (EOUs), units in special economic zones (SEZs), electronic hardware<br />
technology parks (EHTPs), s<strong>of</strong>tware technology parks (STPs) <strong>an</strong>d biotechnology parks (BTPs). A few<br />
more schemes (such as, target plus, served from India) have been added under the Foreign Trade<br />
Policy 2004 [RBI (2004), Malik, (2005)].<br />
Table 2. Export/Import <strong>an</strong>d Trade Bal<strong>an</strong>ce <strong>of</strong> India<br />
Export/Import <strong>an</strong>d Trade Bal<strong>an</strong>ce <strong>of</strong> India<br />
(1949-1950 to 1990-91) (US $ Million)<br />
Year<br />
Export<br />
Trade<br />
Import<br />
(including Re-export)<br />
Bal<strong>an</strong>ce<br />
1949-50 1016 1292 -276<br />
1950-51 1269 1273 -4<br />
1951-52 1490 1852 -362<br />
1952-53 1212 1472 -260<br />
1953-54 1114 1279 -166<br />
1954-55 1233 1456 -223<br />
1955-56 1275 1620 -345<br />
1956-57 1259 1750 -491<br />
1957-58 1171 2160 -989<br />
1958-59 1219 1901 -682<br />
1959-60 1343 2016 -674<br />
1960-61 1346 2353 -107<br />
1961-62 1381 2281 -900<br />
1962-63 1437 2372 -935<br />
1963-64 1659 2558 -899<br />
1964-65 1701 2813 -1111<br />
1965-66 1693 2944 -1251<br />
1966-67 1628 2923 -1295<br />
1967-68 1586 2656 -1071<br />
1968-69 1788 2513 -726<br />
1969-70 1866 2089 -223<br />
1970-71 2031 2162 -131<br />
1971-72 2153 2443 -290<br />
1972-73 2550 2415 134<br />
1973-74 3209 3759 -549<br />
1974-75 4174 5666 -1492<br />
1975-76 4665 6084 -1420<br />
1976-77 5753 5677 76<br />
1977-78 6316 7031 -715<br />
1978-79 6978 8300 -1322<br />
1979-80 7947 11321 -3374<br />
1980-81 8486 15869 -7383<br />
1981-82 8704 15174 -6470<br />
1982-83 9107 14787 -5679<br />
1983-84 9449 15311 -5861<br />
1984-85 9878 14412 -4534<br />
1985-86 8904 16067 -7162<br />
1986-87 9745 15727 -5982<br />
1987-88 12089 17156 -5067<br />
1988-89 13970 19497 -5526<br />
1989-90 16612 21219 -4607<br />
1990-91 18145 24073 -5927<br />
Source: H<strong>an</strong>dbook <strong>of</strong> Industrial Policy <strong>an</strong>d Statistics, 2001, Ministry <strong>of</strong> Commerce & Industry <strong>an</strong>d<br />
Department <strong>of</strong> Economic Affairs, Govt. <strong>of</strong> India & Monthly Newsletter, Vol. XL, No. 10, October 25, 2004,<br />
Indi<strong>an</strong> Investment Centre; IndiaStat Database(2008).<br />
The <strong>trade</strong> bal<strong>an</strong>ce has always been negative as shown in Table 2 <strong>an</strong>d Table 3 except two years<br />
1972-73, 1976-77.The <strong>trade</strong> deficit has been increasing in recent years.<br />
283
Volume III_Issue3 (5)_Fall2008<br />
Table 3. Export/Import <strong>an</strong>d Trade Bal<strong>an</strong>ce <strong>of</strong> India<br />
Trends <strong>of</strong> Foreign Trade (US $) in India<br />
(1990-1991 to 2006-2007)<br />
(US $ Million)<br />
Year Export Growth Rate Import Growth Rate Trade Deficit<br />
1990-91 18145 9.2 24072 13.4 -5927<br />
1991-92 17865 -1.5 19411 -19.4 -1546<br />
1992-93 18437 3.7 21882 12.7 -3345<br />
1993-94 22237 20 23306 6.5 -1069<br />
1994-95 26330 18.4 28654 22.9 -2324<br />
1995-96 31797 20.8 36678 28 -4881<br />
1996-97 33470 5.3 39132 6.7 -5662<br />
1997-98 35006 4.6 41484 6 -6478<br />
1998-99 33219 -5.1 42389 2.2 -9170<br />
1999-2000 36822 10.8 49671 17.2 -12848<br />
2000-01 44560 21 50536 1.7 -5976<br />
2001-02 43827 -1.65 51413 1.74 -7587<br />
2002-03 52719 20.29 61412 19.45 -8693<br />
2003-04 63843 21.10 78150 27.25 -14307<br />
2004-05 83536 - 111518 - -27982<br />
2005-06 103091 - 149166 - -46075<br />
2006-07 (P) 89489 - 131212 - -41723<br />
Source: Ministry <strong>of</strong> Commerce & Industry, Govt. <strong>of</strong> India; IndiaStat Database (2008).<br />
During post liberalization era, exports have done well particularly from 1992-93 to 1996-97;<br />
<strong>an</strong>d from 2002-2003 to 2007-2008. As a proportion <strong>of</strong> GDP, on bal<strong>an</strong>ce <strong>of</strong> payments (BoP) basis,<br />
exports rose from a level <strong>of</strong> 5.8 per cent in 1990- 91 to reach a level <strong>of</strong> 14.0 per cent <strong>of</strong> GDP in 2006-<br />
07. The average <strong>an</strong>nual growth rate in the last five years has been placed at a high <strong>of</strong> 23.5 per cent.<br />
However, imports have grown even faster in the last five years at <strong>an</strong> <strong>an</strong>nual average <strong>of</strong> 28.2 per cent.<br />
As a proportion <strong>of</strong> GDP, on BoP basis, imports in 2006-07 were placed at 20.9 per cent <strong>of</strong> GDP. Thus,<br />
<strong>trade</strong> deficit widened to 6.9 per cent <strong>of</strong> GDP in 2006-07. The higher <strong>trade</strong> deficit could be attributed to<br />
a rise in petroleum, oil <strong>an</strong>d lubric<strong>an</strong>ts (POL) as well as non-POL components in imports. Continued<br />
uptrend in prices in the international markets <strong>an</strong>d rise in the price <strong>of</strong> gold were the major contributors<br />
to this process [Fin<strong>an</strong>ce Ministry, (2008)]. The <strong>trade</strong> account is supported by the rising services<br />
exports. India’s services exports, at $81.3 billion (Rs3.2 trillion) in 2006-07, are fast catching up with<br />
the country’s merch<strong>an</strong>dise exports <strong>of</strong> $127.1 billion. The services export growth rate in 2006-07 was<br />
32.5% compared to 21% in merch<strong>an</strong>dise export [Singh,(2007)]. IBEF has estimated that if the average<br />
<strong>an</strong>nual growth rates <strong>of</strong> the last three years – 56.3 per cent for service exports <strong>an</strong>d 21.8 per cent for<br />
m<strong>an</strong>ufacturing exports – were projected into the future, by the beginning <strong>of</strong> 2007, services could<br />
topple merch<strong>an</strong>dise goods at the pole position in exports [IBEF, (2005)]. Indi<strong>an</strong> share <strong>of</strong> global<br />
services export is more th<strong>an</strong> double <strong>of</strong> merch<strong>an</strong>dise exports <strong>an</strong>d India is one <strong>of</strong> the few countries<br />
which have increased their share <strong>of</strong> services exports in recent years.<br />
Private tr<strong>an</strong>sfers receipts (mainly remitt<strong>an</strong>ces) shot up, year-on-year, by 49.2 per cent as against<br />
19.2 per cent in the corresponding period <strong>of</strong> the previous year. Investment income (net) grew by 60.0<br />
per cent in 2007-08 (April-September) reflecting the burgeoning <strong>foreign</strong> exch<strong>an</strong>ge reserves. Net<br />
invisible surplus grew by 35.2 per cent to reach US$ 31.7 billion in 2007-08 (April-September),<br />
equivalent <strong>of</strong> 6.1 per cent <strong>of</strong> GDP. Thus, higher invisible surplus was able to moderate somewhat the<br />
rising deficits on <strong>trade</strong> account <strong>an</strong>d current account deficit was placed at US$ 10.7 billion in 2007-08<br />
(April-September), equivalent <strong>of</strong> 2.0 per cent <strong>of</strong> GDP [Fin<strong>an</strong>ce Ministry, (2008)].<br />
Table 4 shows the Terms <strong>of</strong> Trade for Indi<strong>an</strong> economy from 1969-1970 to 2005-2006.The terms<br />
<strong>of</strong> <strong>trade</strong> has been fluctuating over the years.<br />
284
Table 4. Index Number <strong>of</strong> Foreign Trade<br />
<strong>Journal</strong> <strong>of</strong> Applied Economic Sciences<br />
Index Number <strong>of</strong> Foreign Trade<br />
(Base : 1978-79=100) (1969-1970 to 2005-2006)<br />
Year<br />
Unit Value Index Volume Index Terms <strong>of</strong> Trade<br />
Exports Imports Exports Imports Gross Net Income<br />
1969-70 44.0 35.2 55.7 64.9 116.5 125.0 69.6<br />
1970-71* 45.0 35.3 59.0 67.2 113.9 127.4 75.2<br />
1971-72* 46.0 32.8 59.2 80.6 136.1 140.2 83.0<br />
1972-73* 51.2 34.2 66.5 76.7 115.3 149.7 99.6<br />
1973-74* 62.2 48.9 69.5 87.2 125.4 127.2 88.4<br />
1974-75* 78.0 84.5 73.7 77.2 104.7 92.3 68.4<br />
1975-76* 83.9 99.1 81.7 76.0 93.0 84.7 69.2<br />
1976-77* 89.4 96.3 96.8 76.1 78.6 92.9 89.9<br />
1977-78* 100.3 88.0 93.2 100.0 107.3 114.0 106.2<br />
1978-79 100.0 100.0 100.0 100.0 100.0 100.0 100.0<br />
1979-80 105.4 114.1 106.2 116.4 109.7 92.4 98.1<br />
1980-81 108.5 134.2 108.1 137.9 127.6 80.8 87.3<br />
1981-82 124.1 133.1 110.1 150.6 136.8 93.2 102.6<br />
1982-83 132.0 136.3 116.7 154.6 132.4 96.8 113.0<br />
1983-84 151.0 125.8 113.0 185.4 164.1 120.0 135.6<br />
1984-85 169.8 161.7 120.8 156.1 129.2 105.0 126.8<br />
1985-86 170.8 158.8 111.3 182.3 163.8 107.6 119.8<br />
1986-87 179.4 139.4 121.3 212.3 175.0 128.6 156.0<br />
1987-88 195.4 160.0 140.0 204.8 146.3 122.1 170.9<br />
1988-89 232.2 185.5 152.1 224.2 147.4 125.2 190.4<br />
1989-90 276.6 228.4 174.9 227.8 130.2 121.1 211.8<br />
1990-91 292.5 267.7 194.1 237.7 122.5 109.3 212.2<br />
1991-92 369.5 309.1 208.6 228.0 109.3 119.5 249.3<br />
1992-93 421.5 331.0 222.9 282.0 126.5 127.3 283.8<br />
1993-94 474.1 327.2 257.5 329.1 127.8 144.9 373.1<br />
1994-95 494.6 324.6 292.7 408.3 139.5 152.4 446.0<br />
1995-96 484.2 351.0 384.3 514.8 134.0 137.9 530.0<br />
1996-97 504.7 399.8 411.8 511.8 124.3 126.2 519.7<br />
1997-98 589.4 404.2 386.0 562.1 145.6 145.8 562.8<br />
1998-99 611.7 407.8 399.2 644.2 161.4 150.0 598.8<br />
1999-00 604.5 450.5 461.0 704.8 152.9 134.2 618.7<br />
2000-01 624.3 487.5 571.4 697.7 122.1 128.1 732.0<br />
2001-02 618.0 492.9 592.7 732.8 123.6 125.4 743.2<br />
2002-03 619.6 545.6 721.6 802.4 111.1 113.6 819.7<br />
2003-04 672 545 765 970 - - -<br />
2004-05 732 663 899 1113 - - -<br />
2005-06 798 592 1005 1649 - - -<br />
Note: 1. Gross Terms <strong>of</strong> Trade implies Volume Index <strong>of</strong> Imports expressed as a percentage <strong>of</strong> Volume<br />
Index <strong>of</strong> Exports.<br />
2. Net Terms <strong>of</strong> Trade implies unit value Index <strong>of</strong> Exports expressed as a percentage <strong>of</strong> unit value<br />
index <strong>of</strong> Imports.<br />
3. Income Terms <strong>of</strong> Trade implies the product <strong>of</strong> Net Terms <strong>of</strong> Trade <strong>an</strong>d Volume Index <strong>of</strong> Exports<br />
as a percentage.<br />
* : Converted from the original base with the help <strong>of</strong> linking factors.<br />
Source: Ministry <strong>of</strong> Commerce & Industry, Govt. <strong>of</strong> India. & Department <strong>of</strong> Economics <strong>an</strong>d Statistics<br />
Govt. <strong>of</strong> Tamil Nadu, IndiaStat Database (2008).<br />
Estimated Foreign Trade by 2020<br />
Trend <strong>an</strong>alysis was used to project the export <strong>an</strong>d import growth <strong>an</strong>d <strong>trade</strong> deficit/ surplus up to<br />
2020. For this, time series data, r<strong>an</strong>ging from 1950-2007 on export, import <strong>an</strong>d <strong>trade</strong> deficit/surplus<br />
was used. The <strong>an</strong>alysis shows that export <strong>trade</strong> will grow up to US$ 61 billion. On the other h<strong>an</strong>d<br />
285
Volume III_Issue3 (5)_Fall2008<br />
import will continue to grow <strong>an</strong>d cross US $ 79 billion. The <strong>trade</strong> deficit will keep increasing <strong>an</strong>d<br />
reach USD 18 billion by 2020. Table 5 shows estimated <strong>trade</strong> till 2020.<br />
Table 5. Estimated Exports, Imports <strong>an</strong>d Trade Deficit by 2020<br />
Year<br />
Estimated Estimated<br />
Export Y1^ Import Y2^<br />
Deficit<br />
2008 48099.84 62538.14 -14438<br />
2009 49182.83 63942.86 -14760<br />
2010 50265.82 65347.58 -15082<br />
2011 51348.81 66752.3 -15403<br />
2012 52431.79 68157.02 -15725<br />
2013 53514.78 69561.74 -16047<br />
2014 54597.77 70966.46 -16369<br />
2015 55680.76 72371.18 -16690<br />
2016 56763.75 73775.9 -17012<br />
2017 57846.73 75180.62 -17334<br />
2018 58929.72 76585.34 -17656<br />
2019 60012.71 77990.06 -17977<br />
2020 61095.7 79394.78 -18299<br />
Composition <strong>of</strong> Indi<strong>an</strong> Foreign Trade<br />
Indi<strong>an</strong> <strong>foreign</strong> <strong>trade</strong> has undergone a ch<strong>an</strong>ge in its composition over the years. In 1948-49, tea,<br />
jute m<strong>an</strong>ufacturers, cotton m<strong>an</strong>ufactures, oilseeds, hides <strong>an</strong>d skins, <strong>an</strong>d metals <strong>an</strong>d ores constituted 71<br />
per cent <strong>of</strong> total Indi<strong>an</strong> exports. This dependence on a few commodities not only introduced <strong>an</strong><br />
element <strong>of</strong> instability in export prospects but was bound to weaken the country's position in regard to<br />
larger questions <strong>of</strong> policy [Pl<strong>an</strong>ning Commission, (1950)]. Import consisted <strong>of</strong> m<strong>an</strong>ufactured goods<br />
<strong>an</strong>d food grains. On the eve <strong>of</strong> independence in 1947 ,exports consisted chiefly <strong>of</strong> raw materials <strong>an</strong>d<br />
pl<strong>an</strong>tation crops while imports composed <strong>of</strong> light consumer goods <strong>an</strong>d other m<strong>an</strong>ufactures [Mathur,<br />
(2006)]. The composition <strong>of</strong> <strong>trade</strong> has ch<strong>an</strong>ged considerably. Today the m<strong>an</strong>ufactured goods <strong>an</strong>d<br />
services dominate the export basket.<br />
The composition <strong>of</strong> exports shows a perceptible shift in this decade i.e. 2000s from light<br />
m<strong>an</strong>ufactures to heavy m<strong>an</strong>ufactures <strong>an</strong>d petroleum crude <strong>an</strong>d products as shown in Table 6. The share<br />
<strong>of</strong> textiles <strong>an</strong>d ready-made garments (RMG) has fallen dramatically by 11.1 percentage points in<br />
2006-07 over 2000-01 followed by gems <strong>an</strong>d jewellery, leather <strong>an</strong>d leather m<strong>an</strong>ufactures <strong>an</strong>d<br />
h<strong>an</strong>dicrafts. Share <strong>of</strong> engineering goods <strong>an</strong>d petro products has increased by 7.6 percentage points <strong>an</strong>d<br />
10.7 percentage points, respectively. The share <strong>of</strong> primary products has declined somewhat with the<br />
decline in share <strong>of</strong> exports from agricultural <strong>an</strong>d allied sector being partly <strong>of</strong>fset by a rise in the share<br />
<strong>of</strong> ores <strong>an</strong>d minerals by 2.8 percentage points. The share <strong>of</strong> chemicals, including petrochemicals, has<br />
increased marginally. The share <strong>of</strong> petroleum crude <strong>an</strong>d products has risen further to 18 per cent in the<br />
first half <strong>of</strong> 2007-08 from 15 per cent in 2006-07. Engineering goods’ share also maintained a rising<br />
trend in 2007-08. Export growth in 2006-07 was driven mainly by petroleum products with 59.3 per<br />
cent growth <strong>an</strong>d engineering goods with 38.1 per cent growth. The perceptible increase in the share <strong>of</strong><br />
petroleum products in total exports reflected not only the rise in POL prices but also India’s enh<strong>an</strong>ced<br />
refining capacity. The rising share <strong>of</strong> engineering goods reflected India’s revival <strong>of</strong> heavy<br />
m<strong>an</strong>ufactures. Induced by strong international minerals, after growing at a compound <strong>an</strong>nual growth<br />
rate (CAGR) <strong>of</strong> 50 per cent in the first half <strong>of</strong> this decade, moderated to 12.6 per cent in 2006-07<br />
[Fin<strong>an</strong>ce Ministry, (2008)].<br />
Commodity group<br />
2000-<br />
2001<br />
Table 6. Commodity Composition <strong>of</strong> Exports<br />
Share (per cent)<br />
CAGR<br />
Apr-Sep<br />
2000-2001<br />
to Apr-Sep<br />
2005- 2006- 2006- 2007- 2004-<br />
2006 2007 2007 2008 2005<br />
2005-<br />
2006<br />
Growth rate (per cent) a<br />
2006-<br />
2007<br />
Apr-Sep<br />
2006-<br />
2007<br />
2007-<br />
2008<br />
I. Primary products 16 15.4 15.1 13.5 13.4 16.9 18.9 19.8 18.5 16.7<br />
Agriculture & allied 14 10.2 10.3 9.5 9.3 9 19.8 23.5 24.7 15.1<br />
286
<strong>Journal</strong> <strong>of</strong> Applied Economic Sciences<br />
Ores & minerals 2 5.2 4.8 4 4.1 49.9 17.4 12.6 6 20.6<br />
II. M<strong>an</strong>ufactured 78.8 72 68.6 68.4 67.4 15.3 19.6 16.9 18.1 15.9<br />
goods<br />
Textile incl. RMG 23.6 14.5 12.5 12.9 11.1 4.3 20.4 5.7 33.5 1.2<br />
Gems & jewellery 16.6 15.1 12.6 12.7 13 16.8 12.8 2.9 -0.6 20.4<br />
Engineering goods 15.7 20.7 23.3 22.8 23.5 25.4 23.4 38.1 48.1 21.2<br />
Chemical & related 10.4 11.6 11.2 11.1 10.4 21.7 17.3 19.1 28.4 10.2<br />
products<br />
Leather & leather 4.4 2.6 2.4 2.4 2.3 5.5 11.1 12.1 7.7 12.7<br />
m<strong>an</strong>ufactures<br />
H<strong>an</strong>dicrafts<br />
(Incl. carpet<br />
2.8 1.2 1.1 1.1 0.8 -5.3 30.3 4.1 5.2 -14.5<br />
h<strong>an</strong>dmade)<br />
III. Petroleum, crude 4.3 11.5 15 16.5 17.9 38.7 66.2 59.3 106.2 27.6<br />
& products<br />
(including coal)<br />
Total exports 100 100 100 100 100 17 23.4 22.6 27.3 17.6<br />
Source: Fin<strong>an</strong>ce Ministry (2008).<br />
The composition <strong>of</strong> imports showed much less ch<strong>an</strong>ge th<strong>an</strong> that <strong>of</strong> exports as shown in Table 7.<br />
POL continues to be the single major item <strong>of</strong> import with its share stabilizing at the 30-31 per cent<br />
level. The share <strong>of</strong> capital goods imports shows the sharpest rise <strong>of</strong> about 4.9 percentage points in<br />
2006-07 over 2000-01 due to a 3.7 percentage point rise in the share <strong>of</strong> tr<strong>an</strong>sport equipment <strong>an</strong>d 1.6<br />
percentage point rise in the share <strong>of</strong> non-electrical machinery (excluding machine tools). It has,<br />
however, plateaued at 13 per cent in the first half <strong>of</strong> 2007-08. The greatest decline is in the import<br />
share <strong>of</strong> pearls <strong>an</strong>d precious <strong>an</strong>d semi-precious stones, reflecting the fall in export share <strong>of</strong> gems <strong>an</strong>d<br />
jewellery. Imports <strong>of</strong> gold <strong>an</strong>d silver have been at around 8 per cent though it has increased to 10 per<br />
cent in the first half <strong>of</strong> 2007-08. Share <strong>of</strong> electronic goods imports has increased to 9 per cent, while<br />
food <strong>an</strong>d allied imports show a marginal fall in share due to the fall in the share <strong>of</strong> edible oils, though<br />
import <strong>of</strong> cereals has shot up in 2006-07 from a negligible level. With the rise in crude oil prices,<br />
growth in POL imports continued to be high in 2006-07 though it moderated in the first half <strong>of</strong> this<br />
fiscal [Fin<strong>an</strong>ce Ministry, (2008)].<br />
Commodity<br />
group<br />
Table 7. Commodity composition <strong>of</strong> imports<br />
Share (per cent)<br />
CAGR Growth rate (per cent) a<br />
April-Sep.<br />
2000-2001<br />
to Apr-Sep.<br />
April-Sep.<br />
2000- 2005- 2006- 2006- 2007- 2004- 2005- 2006- 2006- 2007-<br />
2001 2006 2007 2007 2008 2005 2006 2007 2007 2008<br />
3.3 2.5 2.9 2.3 2.2 24.3 -4.7 42.4 -5.8 26.6<br />
Food & allied<br />
products<br />
1. Cereals 0 0 0.7 0.1 0.1 16.1 36.8 3589.6 803.8 -55.5<br />
2. Pulses 0.2 0.4 0.5 0.3 0.5 38 41.3 53.8 9.6 92.8<br />
3. Edible oils 2.6 1.4 1.1 1.2 1.2 17.2 -17.9 4.2 -11.8 32.9<br />
Fuel (<strong>of</strong> which) 33.5 32.1 33.2 36.3 33.6 18.5 44.8 29 39.8 18<br />
4. POL 31.3 29.5 30.8 33.8 31 17.5 47.3 30 41.2 16.9<br />
Fertilizers 1.3 1.3 1.6 1.7 1.9 17.2 59.4 52.4 54.4 48.2<br />
Capital goods (<strong>of</strong><br />
which)<br />
5. Machinery<br />
except electrical &<br />
machine tool<br />
10.5 15.8 15.4 13.1 13.2 28.9 62.5 21.8 44.3 28.3<br />
5.9 7.4 7.5 8.1 8.2 26.2 49 24.9 39.5 28.3<br />
6. Electrical<br />
1 1 1.1 1.1 1.1 25.6 25.9 30.3 37.9 28.6<br />
machinery<br />
7. Tr<strong>an</strong>sport 1.4 5.9 5.1 2.1 2.5 57.7 104.2 6.8 55.7 51.2<br />
equipment<br />
Others (<strong>of</strong> which) 46.3 43.7 43.8 37.8 40.4 23.5 21.1 24.6 -2.8 36.4<br />
287
Commodity<br />
group<br />
Share (per cent)<br />
April-Sep.<br />
CAGR<br />
2000-2001<br />
to Apr-Sep.<br />
2004-<br />
2005<br />
Volume III_Issue3 (5)_Fall2008<br />
Growth rate (per cent) a<br />
April-Sep.<br />
2000-<br />
2001<br />
2005-<br />
2006<br />
2006-<br />
2007<br />
2006-<br />
2007<br />
2007-<br />
2008<br />
2005-<br />
2006<br />
2006-<br />
2007<br />
2006-<br />
2007<br />
2007-<br />
2008<br />
8. Chemicals 5.9 5.7 5.2 5.6 5.2 23.6 23.2 14.1 13.2 19.8<br />
9. Pearls, precious 9.6 6.1 4 4.1 4.2 18.3 -3.1 -18 -32.8 30.6<br />
&semi precious<br />
stones<br />
10. Gold&silver 9.3 7.6 7.9 7.7 10.3 24.5 1.5 29.4 -3.1 71<br />
11. Electronic 7 8.9 8.6 9 8.9 29.9 32.5 20.6 34 26.2<br />
goods<br />
Gr<strong>an</strong>d total 100 100 100 100 100 22.2 33.8 24.5 23.5 27.7<br />
Source: Fin<strong>an</strong>ce Ministry (2008).<br />
Direction <strong>of</strong> Foreign Trade Export <strong>an</strong>d Import in India<br />
Table 8 <strong>an</strong>d Table 9 show the geographic structure <strong>of</strong> Indi<strong>an</strong> <strong>foreign</strong> <strong>trade</strong>. The direction <strong>of</strong><br />
Indi<strong>an</strong> <strong>foreign</strong> <strong>trade</strong> has ch<strong>an</strong>ged in lasts few years. Over the last 60 years, India's <strong>foreign</strong> <strong>trade</strong> has<br />
undergone a complete ch<strong>an</strong>ge in terms <strong>of</strong> composition <strong>an</strong>d direction [Mathur, (2006)]. Traditionally,<br />
EU <strong>an</strong>d USA used to be the major trading partners <strong>of</strong> India.<br />
Table 8. Geographic Structure <strong>of</strong> Foreign Trade <strong>of</strong> India 1995-2001<br />
Direction <strong>of</strong> Foreign Trade Export <strong>an</strong>d Import<br />
(1995-96 to 2000-01) US $ million)<br />
Group/Country<br />
Exports<br />
Imports<br />
95-96 96-97 97-98 98-99 99-00 00-01 95-96 96-97 97-98 98-99 99-00 00-01<br />
I. OECD<br />
Countries<br />
17705.1 18601.4 19484.9 19264 21106.6 23473.6 19209.2 19456.6 21335.8 21859.7 21364.3 20157.9<br />
A. EU Of which: 8708.3 8655.3 9144.6 8946.6 9382.4 10410.8 10303.2 10624.8 10680.6 10723.8 10967.8 10510.2<br />
1. Belgium 1120.4 1092.7 1215.5 1287.9 1367.7 1470.6 1701.9 2251.7 2668.1 2876.8 3681.3 2870<br />
2. Fr<strong>an</strong>ce 747 716.2 759.6 829.7 897.3 1020 840.7 768.1 797.7 719.6 718.2 640.8<br />
3. Germ<strong>an</strong>y 1977.4 1893.1 1923.7 1851.9 1738.4 1907.6 3145.1 2831.1 2528.8 2140.7 1841.6 1759.6<br />
4. Italy 1014 933.7 1115.2 1055 1119.8 1308.8 1064.3 987.4 921.7 1088.3 734.6 723.6<br />
5. Netherl<strong>an</strong>ds 769 852.4 803.8 763.5 885.8 880.1 570.2 494 445.2 464.2 470.9 437.5<br />
6. UK 2010.8 2046.9 2140.8 1855.4 2034.8 2298.7 1917.7 2134.7 2443.6 2621.4 2706.8 3167.9<br />
B. North America 5825.8 6908.4 7236.1 7672.6 8973.8 9961.6 4242.6 3999.3 4137.8 4025.8 3944.2 3412.1<br />
1. C<strong>an</strong>ada 305.4 353 433.2 473 578.3 656.5 381.2 313.4 420.9 385.6 380.5 397.1<br />
2. USA 5520.4 6555.4 6802.9 7199.6 8395.5 9305.1 3861.4 3685.9 3716.9 3640.2 3563.7 3015<br />
C. Asia <strong>an</strong>d<br />
Oce<strong>an</strong>ia <strong>of</strong> which:<br />
2651.9 2456.9 2408.7 2096.2 2153 2263.6 3551.8 3584.1 3714.2 3999.1 3714.1 2984.3<br />
1. Australia 375.7 385.4 438.3 387.4 403.3 405.9 1021.9 1317.2 1485.6 1445 1081.8 1062.8<br />
2. Jap<strong>an</strong> 2215.6 2005.9 1898.5 1652 1685.4 1794.5 2467.6 2187.4 2144.9 2465.7 2535.8 1842.2<br />
D. Other OECD<br />
Countries Of 519.1 580.7 695.5 548.6 597.4 837.6 1111.6 1248.4 2803.2 3111 2738.2 3251.3<br />
which:<br />
1. Switzerl<strong>an</strong>d 281.6 299.9 367.5 319.1 353.7 437.7 1020.5 1127.3 2640.7 2942.4 2597.7 3160.1<br />
II. OPEC <strong>of</strong><br />
which:<br />
3080.8 3232.5 3535.1 3560 3902.4 4864.4 7649 10154.1 9419.4 7775.3 12864.6 2711<br />
1. Indonesia 662.4 591.8 437.3 185.3 325.6 399.8 461.1 598.7 731.6 829.1 958.8 910.2<br />
2. Ir<strong>an</strong> 155 195 171.7 159.1 152.1 227 598.2 874.4 633 473.7 1251.3 211.2<br />
3. Iraq 0.6 2.2 11.2 36.3 49.4 84 0 0 185.4 151.2 199.7 6.9<br />
4. Kuwait 135.5 154.7 185.9 164.7 154.3 199.1 1970.1 2404.9 2299.5 1501.1 1912.2 112.7<br />
5. Saudi Arabia 482.3 577.2 690.1 774.3 742.5 822.9 2024.7 2769.7 2508.3 1831.5 3016.5 621.1<br />
6. UAE 1428.3 1476 1692.4 1867.6 2082.7 2597.5 1606.6 1736.1 1780 1721.2 2334.2 659<br />
III. Eastern<br />
Europe <strong>of</strong> which:<br />
1340 1098.5 1283.3 1052.9 1292.9 1317.8 1673.8 1102.7 1114.6 863.9 994.6 850.2<br />
288
<strong>Journal</strong> <strong>of</strong> Applied Economic Sciences<br />
Direction <strong>of</strong> Foreign Trade Export <strong>an</strong>d Import<br />
(1995-96 to 2000-01) US $ million)<br />
1. Rom<strong>an</strong>ia 29.9 17.8 15.3 17.6 12.6 12.2 148.1 154 61.4 43.2 20.1 21.7<br />
2. Russia 1045 811.2 953 709.4 947.9 889 856.3 628.4 678.2 545.5 623.2 517.7<br />
IV. Developing<br />
Countries <strong>of</strong> 9196.6 10033 10304.4 9212 10453.4 12998.2 8140.4 8415.2 9610.8 11885.4 14510.1 11134<br />
which:<br />
A. Asia 7307.8 8133.9 7972.4 6844.5 8205.5 10037.9 6426 6573.4 7258.9 8535.2 9942.2 8459.5<br />
a) SAARC 1720.6 1701.6 1610.9 1679.2 1394.6 1928.5 256.5 241.6 234.3 465.6 397.7 465.8<br />
1. B<strong>an</strong>gladesh 1049.1 869 786.5 995.6 636.3 935 85.9 62.2 50.8 62.4 78.2 80.4<br />
2. Bhut<strong>an</strong> 17.2 22 13.3 9.6 7.6 1.1 34.7 33.8 13.4 6.1 18 21.1<br />
3. Maldives 15.7 10.4 8.7 8.4 7.3 24.6 0.2 0.2 0.2 0.1 0.4 0.2<br />
4. Nepal 160 165.7 170 122.4 151.2 140.8 49.1 64.1 95.2 144.9 188.6 255.1<br />
5. Pakist<strong>an</strong> 76.8 157.2 143.2 106.1 92.9 186.8 45.1 36.2 44.4 214.4 68.2 64<br />
6. Sri L<strong>an</strong>ka 401.7 477.4 489.2 437.1 499.3 640.1 41.4 45.2 30.2 37.7 44.2 45<br />
b) Other Asi<strong>an</strong><br />
Developing<br />
Countries <strong>of</strong><br />
5587.2 6432.3 6361.5 5165.3 6810.9 8109.4 6169.4 6331.8 7024.6 8069.6 9544.5 7993.7<br />
which:<br />
1. Hong Kong 1821.4 1862.6 1932 1880.6 2510.9 2640.9 388 319.1 316.3 449.3 817.9 852.1<br />
2. South Korea 448.3 518.5 467.6 307.9 476.6 450.8 824.8 883.6 1001.8 1394.4 1273.3 893.8<br />
3. Malaysia 393.2 531.1 489.9 321.7 447.1 608.2 902.7 1107.5 1178.9 1608.4 2024 1176.8<br />
4. Singapore 901.6 977.5 779.7 517.5 672.7 877.1 1091.9 1063.3 1197.9 1384.2 1534.4 1463.9<br />
5. Thail<strong>an</strong>d 472.9 447.1 344 321 449.6 530.1 169.7 197.2 233.3 273.1 327.8 337.9<br />
B. Africa <strong>of</strong><br />
which:<br />
1512.4 1420 1634.5 1757.2 1550.3 1951.5 1131.4 1287.7 1756.4 2626.6 3640.5 1981.6<br />
1. Benin 11.3 16.6 20.7 27.1 28.4 45.1 15.5 9.8 13.5 12.8 42.7 52.1<br />
2. Egypt Arab<br />
Republic<br />
164.3 157.5 253.4 270.3 236.7 357.5 72.6 65.2 192.6 192.4 443.9 38.8<br />
3. Kenya 245.1 168.5 123.9 145.2 116.7 140.9 15 19.6 20.9 36.2 21 19<br />
4. Sud<strong>an</strong> 30.6 26.9 44.6 55 71.5 97.8 15.3 6.3 4.5 15.1 6.6 8<br />
5. T<strong>an</strong>z<strong>an</strong>ia 81.4 67.6 68.9 85.4 82 102 96.3 73.9 68 124.6 124.5 59.5<br />
6. Zambia 35.2 32.1 26.6 17.3 23.3 22.5 59.9 104.1 97.2 39.1 26 11.6<br />
C. Latin<br />
Americ<strong>an</strong> 376.4 479.1 697.5 610.2 697.6 1008.8 583.1 554.1 595.5 723.7 927.5 692.9<br />
Countries<br />
V. Others 18.8 22.5 45.9 40.4 37.1 76.7 3 3.8 3.9 4.4 4.4 1.6<br />
Total Trade 31794.9 33469.7 35006.4 33218.7 36822.4 44560.3 36675.3 39132.4 41484.5 42388.7 49670.7 50536.5<br />
Note: Exports <strong>of</strong> Petroleum Products are taken into account in total exports, but are not included in<br />
country-wise details.<br />
Source: H<strong>an</strong>dbook <strong>of</strong> Statistics on Indi<strong>an</strong> Economy, Reserve B<strong>an</strong>k <strong>of</strong> India, 2001; IndiaStat Database (2008).<br />
On the eve <strong>of</strong> independence in 1947, <strong>foreign</strong> <strong>trade</strong> <strong>of</strong> India was typical <strong>of</strong> a colonial <strong>an</strong>d<br />
agricultural economy. Trade relations were mainly confined to Britain <strong>an</strong>d other commonwealth<br />
countries [Mathur, (2006)]. However, after the Look East policy <strong>of</strong> 1990s, the share <strong>of</strong> East Asi<strong>an</strong><br />
countries in general <strong>an</strong>d China in particular in recent years has increased.<br />
Table 9. Geographic Structure <strong>of</strong> Foreign Trade <strong>of</strong> India 2001-2006<br />
Direction <strong>of</strong> Foreign Trade Export <strong>an</strong>d Import in India<br />
(2001-2002 to 2005-2006) (US $ Million)<br />
Group/Country<br />
2001-<br />
2002<br />
2002-<br />
2003<br />
2003-<br />
2004<br />
2004-<br />
2005<br />
2005-<br />
2006 (P)<br />
Exports Imports Exports Imports Exports Imports Exports Imports Exports Imports<br />
I. OECD countries 21622.1 20640.6 26382.6 23301.1 29629.2 29572.1 36494.8 39989.9 45459.7 46606.6<br />
A. EU <strong>of</strong> which: 9845.9 10436.5 11522.5 12541.7 13890.0 14717.0 17539.6 18713.0 22222.4 22341.9<br />
1. Belgium 1390.6 2763.0 1661.8 3711.9 1805.7 3975.9 2509.7 4588.9 2853.1 4705.4<br />
289
Volume III_Issue3 (5)_Fall2008<br />
Direction <strong>of</strong> Foreign Trade Export <strong>an</strong>d Import in India<br />
(2001-2002 to 2005-2006) (US $ Million)<br />
Group/Country<br />
2001-<br />
2002<br />
2002-<br />
2003<br />
2003-<br />
2004<br />
2004-<br />
2005<br />
2005-<br />
2006 (P)<br />
Exports Imports Exports Imports Exports Imports Exports Imports Exports Imports<br />
2. Fr<strong>an</strong>ce 945.0 844.3 1074.1 1094.2 1280.9 1090.2 1680.9 1894.1 2047.6 1764.3<br />
3. Germ<strong>an</strong>y 1788.4 2028.1 2106.7 2404.5 2544.6 2918.6 2826.2 4015.3 3517.0 5818.4<br />
4. Italy 1206.5 704.8 1357.1 812.0 1729.4 1071.0 2286.0 1373.1 2490.0 1828.7<br />
5. Netherl<strong>an</strong>ds 863.9 466.5 1047.9 385.7 1289.1 535.6 1604.9 791.5 2456.1 1039.1<br />
6. UK 2160.9 2563.2 2496.4 2777.0 3023.2 3234.3 3681.1 3566.2 5146.0 3898.2<br />
B. North America 9098.2 3679.0 11594.0 5009.9 12253.2 5760.7 14632.6 7777.1 18212.2 8673.0<br />
1. C<strong>an</strong>ada 584.8 529.4 698.3 566.3 763.2 725.9 866.8 775.7 1008.7 895.1<br />
2. USA 8513.3 3149.6 10895.8 4443.6 11490.0 5034.8 13765.7 7001.4 17203.5 7778.0<br />
C. Asia <strong>an</strong>d<br />
Oce<strong>an</strong>ia <strong>of</strong> which:<br />
1990.7 3534.7 2435.9 3249.5 2379.6 5395.8 2941.4 7187.6 3411.5 8599.5<br />
1. Australia 418.0 1306.1 504.2 1336.8 584.3 2649.2 720.2 3824.5 811.8 4851.1<br />
2. Jap<strong>an</strong> 1510.4 2146.4 1864.0 1836.3 1709.3 2667.7 2127.9 3235.1 2458.7 3552.4<br />
D. Other OECD<br />
countries <strong>of</strong> which:<br />
687.3 2990.3 830.2 2500.0 1106.5 3698.6 1381.3 6312.2 1613.6 6992.2<br />
1. Switzerl<strong>an</strong>d 409.1 2870.7 382.7 2329.9 449.9 3312.7 540.9 5939.9 474.1 6525.5<br />
II. OPEC <strong>of</strong> which: 5224.5 2965.8 6884.6 3479.4 9544.4 5609.2 13207.4 10022.5 15223.1 11013.6<br />
1. Indonesia 533.7 1036.8 826.1 1380.9 1127.2 2122.1 1332.6 2617.7 1370.5 2933.5<br />
2. Ir<strong>an</strong> 253.0 283.8 654.7 258.3 918.1 266.8 1231.4 410.2 1176.4 685.9<br />
3. Iraq 206.8 0.0 214.9 0.0 75.2 0.1 131.2 1.1 145.4 2.1<br />
4. Kuwait 206.2 73.7 250.6 179.5 319.1 142.5 421.4 305.9 507.7 460.5<br />
5. Saudi Arabia 826.4 464.0 940.7 504.7 1123.3 737.8 1412.1 1301.2 1806.9 1617.4<br />
6. UAE 2491.8 915.1 3327.5 957.0 5125.6 2059.8 7347.9 4641.1 8592.8 4312.1<br />
III. Eastern Europe<br />
<strong>of</strong> which:<br />
1254.8 946.8 1248.1 1139.9 1555.4 1628.9 1780.2 2514.2 1960.3 3689.5<br />
1. Rom<strong>an</strong>ia 11.4 48.4 27.4 45.6 47.8 71.9 106.0 168.4 83.4 251.2<br />
2. Russia 798.2 535.5 704.0 592.6 713.8 959.6 631.3 1322.7 729.9 1992.0<br />
IV. Developing<br />
13535.5 12776.4 17862.3 15688.2 22784.3 20567.2 31597.1 28604.2 39785.1 36808.8<br />
countries <strong>of</strong> which:<br />
A. Asia 10332.7 9264.7 13981.0 11303.8 18426.7 16269.8 24968.4 22581.3 30961.1 29849.1<br />
(a) SAARC 2026.0 571.5 2724.1 512.0 4148.1 668.8 4440.7 950.2 5358.5 1338.7<br />
1. B<strong>an</strong>gladesh 1002.2 59.1 1176.0 62.1 1740.7 77.6 1631.1 59.4 1632.4 118.8<br />
2. Bhut<strong>an</strong> 7.6 23.9 39.0 32.2 89.5 52.4 84.6 71.0 99.1 88.9<br />
3. Maldives 26.9 0.4 31.6 0.3 42.3 0.4 47.6 0.6 67.2 2.0<br />
4. Nepal 214.5 355.9 350.4 281.8 669.4 286.0 743.1 345.8 859.4 380.0<br />
5. Pakist<strong>an</strong> 144.0 64.8 206.2 44.8 286.9 57.6 521.1 95.0 681.9 177.5<br />
6. Sri L<strong>an</strong>ka 630.9 67.4 921.0 90.8 1319.2 194.7 1413.2 378.4 2018.5 571.7<br />
(b) Other Asi<strong>an</strong><br />
developing 8306.6 8693.2 11256.9 10791.8 14278.6 15601.0 20527.7 21631.1 25602.6 28510.4<br />
countries <strong>of</strong> which:<br />
1. China, People's<br />
Republic <strong>of</strong><br />
952.0 2036.4 1975.5 2792.0 2955.1 4053.2 5615.9 7098.0 6721.2 10739.5<br />
2. Hong Kong 2366.4 728.9 2613.3 972.6 3261.8 1492.7 3691.8 1730.1 4457.2 2167.6<br />
3. South Korea 471.4 1141.4 644.9 1522.0 764.9 2829.2 1041.7 3508.8 1819.0 4343.4<br />
4. Malaysia 773.7 1133.5 749.4 1465.4 892.8 2046.6 1084.1 2299.0 1151.6 2388.6<br />
5. Singapore 972.3 1304.1 1421.6 1434.8 2124.8 2085.4 4000.6 2651.4 5569.8 3230.3<br />
6. Thail<strong>an</strong>d 633.1 423.1 711.2 379.0 831.7 609.1 901.4 865.9 1062.3 1201.7<br />
B. Africa <strong>of</strong> which: 2260.9 2502.4 2575.7 3348.2 3094.4 3103.9 4478.6 3930.4 5809.2 4548.7<br />
1. Benin 55.4 43.1 64.4 38.2 52.7 53.2 47.1 79.8 114.5 77.1<br />
2. Egypt, Arab<br />
Republic <strong>of</strong><br />
462.7 99.9 298.2 226.6 367.5 98.2 444.7 152.6 664.3 218.0<br />
3. Kenya 156.0 31.9 203.6 33.5 229.5 41.9 426.6 46.7 569.1 48.2<br />
4. Sud<strong>an</strong> 122.2 13.4 105.2 24.5 107.4 31.2 317.4 22.9 313.5 31.7<br />
5. T<strong>an</strong>z<strong>an</strong>ia 90.8 76.1 115.5 91.2 175.8 109.3 173.9 131.7 239.9 119.4<br />
6. Zambia 25.7 13.5 31.0 14.4 39.9 18.6 50.4 23.0 64.7 40.3<br />
290
<strong>Journal</strong> <strong>of</strong> Applied Economic Sciences<br />
Direction <strong>of</strong> Foreign Trade Export <strong>an</strong>d Import in India<br />
(2001-2002 to 2005-2006) (US $ Million)<br />
Group/Country<br />
2001-<br />
2002<br />
2002-<br />
2003<br />
2003-<br />
2004<br />
2004-<br />
2005<br />
2005-<br />
2006 (P)<br />
Exports Imports Exports Imports Exports Imports Exports Imports Exports Imports<br />
C. Latin Americ<strong>an</strong><br />
countries<br />
941.9 1009.3 1305.6 1036.2 1263.2 1193.6 2150.1 2092.5 3014.8 2411.0<br />
V.<br />
Others/Unspecified<br />
2189.8 14083.7 341.8 17803.5 329.3 20771.7 456.5 30386.7 296.8 44297.9<br />
Total <strong>trade</strong> 43826.7 51413.3 52719.4 61412.1 63842.6 78149.1 83535.9 111517.4 102725.1 142416.3<br />
Abbr.: P – Provisional.<br />
Source: Reserve B<strong>an</strong>k <strong>of</strong> India; IndiaStat Database(2008).<br />
Further, the Indi<strong>an</strong> <strong>foreign</strong> <strong>trade</strong> geographic structure in exports <strong>an</strong>d imports in terms <strong>of</strong><br />
percentage shows the increasing share <strong>of</strong> developing countries <strong>an</strong>d decreasing share <strong>of</strong> OECD group.<br />
The geographic structure <strong>of</strong> Indi<strong>an</strong> exports in percentage terms (excluding petroleum exports) is<br />
shown in Figure1.<br />
Figure1: Geographic structure <strong>of</strong> Indi<strong>an</strong> exports in percentage terms<br />
P e r c e n t a g e<br />
1 0 0 . 0 0<br />
9 0 . 0 0<br />
8 0 . 0 0<br />
7 0 . 0 0<br />
6 0 . 0 0<br />
5 0 . 0 0<br />
4 0 . 0 0<br />
3 0 . 0 0<br />
2 0 . 0 0<br />
1 0 . 0 0<br />
0 . 0 0<br />
9 5 - 9 6 9 6 - 9 7 9 7 - 9 8 9 8 - 9 9 9 9 - 0 0 0 0 - 0 1 2 0 0 1 - 0 2 2 0 0 2 - 0 3 2 0 0 3 - 0 4 2 0 0 4 - 0 5 2 0 0 5 - 0 6<br />
Y e a r<br />
( p )<br />
O C E D C o u n t r ie s O P E C C o u n t r ie s E a s t e r n E u r o p e D e v e lo p in g C o u n t r ie s O t h e r s<br />
* excluding petroleum exports.<br />
Graph 2 displays the geographic structure <strong>of</strong> Indi<strong>an</strong> imports in percentage terms (excluding<br />
petroleum products), see the Figure 2.<br />
P e r c e n t a g e<br />
1 0 0 . 0 0<br />
8 0 . 0 0<br />
6 0 . 0 0<br />
4 0 . 0 0<br />
2 0 . 0 0<br />
0 . 0 0<br />
Figure 2: Geographic structure <strong>of</strong> Indi<strong>an</strong> imports in percentage terms<br />
9 5 - 9 6 9 6 - 9 7 9 7 - 9 8 9 8 - 9 9 9 9 - 0 0 0 0 - 0 1 2 0 0 1 -<br />
0 2<br />
Y e a r<br />
2 0 0 2 -<br />
0 3<br />
2 0 0 3 -<br />
0 4<br />
O C E D C o u n t r ie s O P E C C o u n t r i e s E a s t e r n E u r o p e<br />
D e v e l o p in g C o u n t r i e s<br />
O t h e r s<br />
2 0 0 4 -<br />
0 5<br />
2 0 0 5 -<br />
0 6<br />
( p )<br />
3. Conclusion<br />
Indi<strong>an</strong> <strong>foreign</strong> <strong>trade</strong> has progressed a lot over the last sixty years since Independence. The<br />
period c<strong>an</strong> be divided into three sub-periods <strong>of</strong> 1950-1970, 1971-1991 <strong>an</strong>d post-1991.The <strong>trade</strong> has<br />
stagnated <strong>an</strong>d India lost its market share to other countries in 1950s <strong>an</strong>d 1960s.The government<br />
291
Volume III_Issue3 (5)_Fall2008<br />
policies <strong>an</strong>d domin<strong>an</strong>t views <strong>of</strong> import substitution <strong>an</strong>d export pessimism has a negative impact. The<br />
situation improved in 1970s <strong>an</strong>d exports has finally picked up in post liberalization era in general <strong>an</strong>d<br />
after 2002 in particular. In terms <strong>of</strong> composition, now it is dominated by m<strong>an</strong>ufactured goods <strong>an</strong>d<br />
services. Services exports contribution has grown rapidly in recent past. India services exports share in<br />
global exports is more th<strong>an</strong> double <strong>of</strong> that <strong>of</strong> Indi<strong>an</strong> m<strong>an</strong>ufacturing exports In terms <strong>of</strong> direction, it is<br />
now more distributed around the world <strong>an</strong>d the share <strong>of</strong> East Asi<strong>an</strong> countries his on rise in overall<br />
<strong>trade</strong>. Looking at the large size <strong>of</strong> the economy, the high growth rates <strong>an</strong>d small share in world <strong>trade</strong>;<br />
with the help <strong>of</strong> economic theories, we c<strong>an</strong> safely conclude that there is huge untapped potential for<br />
Indi<strong>an</strong> <strong>foreign</strong> <strong>trade</strong> in years to come.<br />
4. References<br />
[1] Bhagwati, J.; Srinivas<strong>an</strong>, T.N., (1975), Foreign Trade Regimes <strong>an</strong>d Economic Development: India,<br />
New York: Columbia University Press.<br />
[2] Commerce Ministry, (2008), India Trade Data B<strong>an</strong>k, Ministry website.<br />
http://commerce.nic.in/eidb/default.asp (Accessed on 18th March, 2008)<br />
[3] IBEF, (2005), Why service exports could overtake merch<strong>an</strong>dise <strong>trade</strong> by 2007,IBEF website.<br />
http://ibef.org/artdisplay.aspx?cat_id=391&art_id=7340 (Accessed on Dec 18, 2007)<br />
[4] Indiastat Database (2008), Foreign Trade, Indiastat Database website.<br />
http://www.indiastat.com/india/ShowData.asp?secid=331671&ptid=107&level=3 (Accessed on 18th<br />
March, 2008)<br />
[5] Joshi, V.; Little, I.M.D., (1994), India: Macroeconomics <strong>an</strong>d Political Economy, 1964-1991,<br />
Washington DC: World B<strong>an</strong>k <strong>an</strong>d Oxford University Press.<br />
[6] Kathuria, S., (1996), Export Incentives: The Impact <strong>of</strong> Recent Policy Ch<strong>an</strong>ges in India, Indi<strong>an</strong><br />
Economic Review, Vol 31, No.1, pp. 109 – 26.<br />
[7] Malik, J.K., (2005), India’s Exports- Policy defeating Exch<strong>an</strong>ge Rate Arithmetic, Economic <strong>an</strong>d<br />
Political Weekly, Dec 24-31.pp 5486 – 5496.<br />
[8] Mathur, V., (2006), Foreign Trade <strong>of</strong> India 1947-2007 : Trends, Policies <strong>an</strong>d Prospects, New<br />
Delhi: New Century Pub.<br />
[9] Ministry <strong>of</strong> Fin<strong>an</strong>ce, (2008), Economic Survey 2007-08, Ministry website.<br />
http://indiabudget.nic.in/es2007-08/chapt2008/chap62.pdf (Accessed on 23rd March 2008).<br />
[10] Nayyar, D., (1976), India’s Exports <strong>an</strong>d Export Policies in the Sixties, Cambridge: Cambridge<br />
Universtiy Press.<br />
[11] Pl<strong>an</strong>ning Commission, (1950) 1st Five Year Pl<strong>an</strong>, Pl<strong>an</strong>ning Commission website.<br />
http://pl<strong>an</strong>ningcommission.nic.in/pl<strong>an</strong>s/pl<strong>an</strong>rel/fiveyr/1st/1pl<strong>an</strong>ch30.html Accessed on 23 rd March<br />
2008).<br />
[12] Singh, M., (1964), India’s Export Trends <strong>an</strong>d the Prospects for Selfsustained Growth, Oxford:<br />
Clarendon Press.<br />
[13] Singh, S., (2007), Services exports soar to put India at No.10, Livemint, Nov 27.<br />
http://www.livemint.com/2007/11/22003411/Services-exports-soar-to-put-I.html<br />
[14] Veeram<strong>an</strong>i, C., (2007), Sources <strong>of</strong> India’s Exports Growth in Pre- <strong>an</strong>d Post- Reform Periods,<br />
Economic <strong>an</strong>d Political Weekly, July 23-30.pp. 2419 – 2427.<br />
[15] Virm<strong>an</strong>i, A., (2003), India’s External Reforms- Modest Globalisation, Signific<strong>an</strong>t Gains,<br />
Economic <strong>an</strong>d Political Weekly, Vol.38, No.32, pp.3373 – 3390<br />
292


