Evidence of a ZnCr2Se4 Spinel Inclusion at the Core of a Cr-Doped ...
Evidence of a ZnCr2Se4 Spinel Inclusion at the Core of a Cr-Doped ...
Evidence of a ZnCr2Se4 Spinel Inclusion at the Core of a Cr-Doped ...

Create successful ePaper yourself
Turn your PDF publications into a flip-book with our unique Google optimized e-Paper software.
Journal <strong>of</strong> <strong>the</strong> American Chemical Society<br />
Article<br />
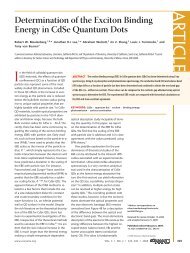
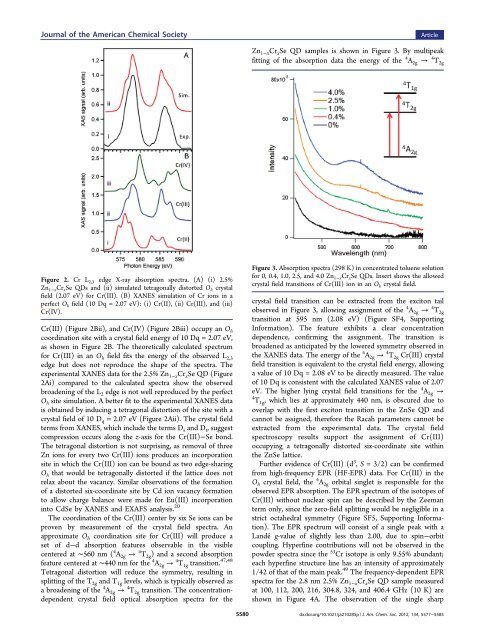
Zn 1−x <strong>Cr</strong> x Se QD samples is shown in Figure 3. By multipeak<br />
fitting <strong>of</strong> <strong>the</strong> absorption d<strong>at</strong>a <strong>the</strong> energy <strong>of</strong> <strong>the</strong> 4 A 2g → 4 T 2g<br />
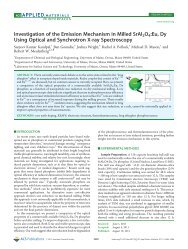
Figure 2. <strong>Cr</strong> L 2,3 edge X-ray absorption spectra. (A) (i) 2.5%<br />
Zn 1−x <strong>Cr</strong> x Se QDs and (ii) simul<strong>at</strong>ed tetragonally distorted O h crystal<br />
field (2.07 eV) for <strong>Cr</strong>(III). (B) XANES simul<strong>at</strong>ion <strong>of</strong> <strong>Cr</strong> ions in a<br />
perfect O h field (10 Dq = 2.07 eV): (i) <strong>Cr</strong>(II), (ii) <strong>Cr</strong>(III), and (iii)<br />
<strong>Cr</strong>(IV).<br />
<strong>Cr</strong>(III) (Figure 2Bii), and <strong>Cr</strong>(IV) (Figure 2Biii) occupy an O h<br />
coordin<strong>at</strong>ion site with a crystal field energy <strong>of</strong> 10 Dq = 2.07 eV,<br />
as shown in Figure 2B. The <strong>the</strong>oretically calcul<strong>at</strong>ed spectrum<br />
for <strong>Cr</strong>(III) in an O h field fits <strong>the</strong> energy <strong>of</strong> <strong>the</strong> observed L 2,3<br />
edge but does not reproduce <strong>the</strong> shape <strong>of</strong> <strong>the</strong> spectra. The<br />
experimental XANES d<strong>at</strong>a for <strong>the</strong> 2.5% Zn 1−x <strong>Cr</strong> x Se QD (Figure<br />
2Ai) compared to <strong>the</strong> calcul<strong>at</strong>ed spectra show <strong>the</strong> observed<br />
broadening <strong>of</strong> <strong>the</strong> L 2 edge is not well reproduced by <strong>the</strong> perfect<br />
O h site simul<strong>at</strong>ion. A better fit to <strong>the</strong> experimental XANES d<strong>at</strong>a<br />
is obtained by inducing a tetragonal distortion <strong>of</strong> <strong>the</strong> site with a<br />
crystal field <strong>of</strong> 10 D q = 2.07 eV (Figure 2Aii). The crystal field<br />
terms from XANES, which include <strong>the</strong> terms D s and D t , suggest<br />
compression occurs along <strong>the</strong> z-axis for <strong>the</strong> <strong>Cr</strong>(III)−Se bond.<br />
The tetragonal distortion is not surprising, as removal <strong>of</strong> three<br />
Zn ions for every two <strong>Cr</strong>(III) ions produces an incorpor<strong>at</strong>ion<br />
site in which <strong>the</strong> <strong>Cr</strong>(III) ion can be bound as two edge-sharing<br />
O h th<strong>at</strong> would be tetragonally distorted if <strong>the</strong> l<strong>at</strong>tice does not<br />
relax about <strong>the</strong> vacancy. Similar observ<strong>at</strong>ions <strong>of</strong> <strong>the</strong> form<strong>at</strong>ion<br />
<strong>of</strong> a distorted six-coordin<strong>at</strong>e site by Cd ion vacancy form<strong>at</strong>ion<br />
to allow charge balance were made for Eu(III) incorpor<strong>at</strong>ion<br />
into CdSe by XANES and EXAFS analysis. 20<br />
The coordin<strong>at</strong>ion <strong>of</strong> <strong>the</strong> <strong>Cr</strong>(III) center by six Se ions can be<br />
proven by measurement <strong>of</strong> <strong>the</strong> crystal field spectra. An<br />
approxim<strong>at</strong>e O h coordin<strong>at</strong>ion site for <strong>Cr</strong>(III) will produce a<br />
set <strong>of</strong> d−d absorption fe<strong>at</strong>ures observable in <strong>the</strong> visible<br />
centered <strong>at</strong> ∼560 nm ( 4 A 2g → 4 T 2g ) and a second absorption<br />
fe<strong>at</strong>ure centered <strong>at</strong> ∼440 nm for <strong>the</strong> 4 A 2g → 4 T 1g transition. 47,48<br />
Tetragonal distortion will reduce <strong>the</strong> symmetry, resulting in<br />
splitting <strong>of</strong> <strong>the</strong> T 2g and T 1g levels, which is typically observed as<br />
a broadening <strong>of</strong> <strong>the</strong> 4 A 2g → 4 T 2g transition. The concentr<strong>at</strong>iondependent<br />
crystal field optical absorption spectra for <strong>the</strong><br />
Figure 3. Absorption spectra (298 K) in concentr<strong>at</strong>ed toluene solution<br />
for 0, 0.4, 1.0, 2.5, and 4.0 Zn 1−x <strong>Cr</strong> x Se QDs. Insert shows <strong>the</strong> allowed<br />
crystal field transitions <strong>of</strong> <strong>Cr</strong>(III) ion in an O h crystal field.<br />
crystal field transition can be extracted from <strong>the</strong> exciton tail<br />
observed in Figure 3, allowing assignment <strong>of</strong> <strong>the</strong> 4 A 2g → 4 T 2g<br />
transition <strong>at</strong> 595 nm (2.08 eV) (Figure SF4, Supporting<br />
Inform<strong>at</strong>ion). The fe<strong>at</strong>ure exhibits a clear concentr<strong>at</strong>ion<br />
dependence, confirming <strong>the</strong> assignment. The transition is<br />
broadened as anticip<strong>at</strong>ed by <strong>the</strong> lowered symmetry observed in<br />
<strong>the</strong> XANES d<strong>at</strong>a. The energy <strong>of</strong> <strong>the</strong> 4 A 2g → 4 T 2g <strong>Cr</strong>(III) crystal<br />
field transition is equivalent to <strong>the</strong> crystal field energy, allowing<br />
a value <strong>of</strong> 10 Dq = 2.08 eV to be directly measured. The value<br />
<strong>of</strong> 10 Dq is consistent with <strong>the</strong> calcul<strong>at</strong>ed XANES value <strong>of</strong> 2.07<br />
eV. The higher lying crystal field transitions for <strong>the</strong> 4 A 2g →<br />
4 T 1g , which lies <strong>at</strong> approxim<strong>at</strong>ely 440 nm, is obscured due to<br />
overlap with <strong>the</strong> first exciton transition in <strong>the</strong> ZnSe QD and<br />
cannot be assigned, <strong>the</strong>refore <strong>the</strong> Racah parameters cannot be<br />
extracted from <strong>the</strong> experimental d<strong>at</strong>a. The crystal field<br />
spectroscopy results support <strong>the</strong> assignment <strong>of</strong> <strong>Cr</strong>(III)<br />
occupying a tetragonally distorted six-coordin<strong>at</strong>e site within<br />
<strong>the</strong> ZnSe l<strong>at</strong>tice.<br />
Fur<strong>the</strong>r evidence <strong>of</strong> <strong>Cr</strong>(III) (d 3 , S = 3/2) can be confirmed<br />
from high-frequency EPR (HF-EPR) d<strong>at</strong>a. For <strong>Cr</strong>(III) in <strong>the</strong><br />
O h crystal field, <strong>the</strong> 4 A 2g orbital singlet is responsible for <strong>the</strong><br />
observed EPR absorption. The EPR spectrum <strong>of</strong> <strong>the</strong> isotopes <strong>of</strong><br />
<strong>Cr</strong>(III) without nuclear spin can be described by <strong>the</strong> Zeeman<br />
term only, since <strong>the</strong> zero-field splitting would be negligible in a<br />
strict octahedral symmetry (Figure SF5, Supporting Inform<strong>at</strong>ion).<br />
The EPR spectrum will consist <strong>of</strong> a single peak with a<br />
Landé g-value <strong>of</strong> slightly less than 2.00, due to spin−orbit<br />
coupling. Hyperfine contributions will not be observed in <strong>the</strong><br />
powder spectra since <strong>the</strong> 53 <strong>Cr</strong> isotope is only 9.55% abundant;<br />
each hyperfine structure line has an intensity <strong>of</strong> approxim<strong>at</strong>ely<br />
1/42 <strong>of</strong> th<strong>at</strong> <strong>of</strong> <strong>the</strong> main peak. 49 The frequency-dependent EPR<br />
spectra for <strong>the</strong> 2.8 nm 2.5% Zn 1−x <strong>Cr</strong> x Se QD sample measured<br />
<strong>at</strong> 100, 112, 200, 216, 304.8, 324, and 406.4 GHz (10 K) are<br />
shown in Figure 4A. The observ<strong>at</strong>ion <strong>of</strong> <strong>the</strong> single sharp<br />
5580<br />
dx.doi.org/10.1021/ja210285p | J. Am. Chem. Soc. 2012, 134, 5577−5585