Sustainability and adequacy of pensions in EU countries. A cross ...
Sustainability and adequacy of pensions in EU countries. A cross ...
Sustainability and adequacy of pensions in EU countries. A cross ...

You also want an ePaper? Increase the reach of your titles
YUMPU automatically turns print PDFs into web optimized ePapers that Google loves.
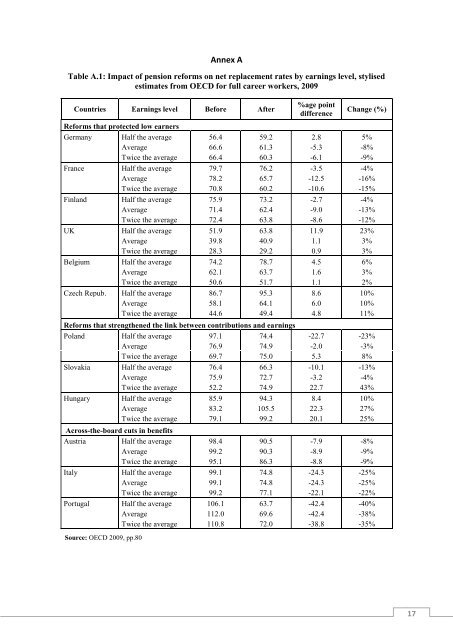
Annex A<br />
Table A.1: Impact <strong>of</strong> pension reforms on net replacement rates by earn<strong>in</strong>gs level, stylised<br />
estimates from OECD for full career workers, 2009<br />
Countries Earn<strong>in</strong>gs level Before After<br />
%age po<strong>in</strong>t<br />
difference<br />
Change (%)<br />
Reforms that protected low earners<br />
Germany Half the average 56.4 59.2 2.8 5%<br />
Average 66.6 61.3 -5.3 -8%<br />
Twice the average 66.4 60.3 -6.1 -9%<br />
France Half the average 79.7 76.2 -3.5 -4%<br />
Average 78.2 65.7 -12.5 -16%<br />
Twice the average 70.8 60.2 -10.6 -15%<br />
F<strong>in</strong>l<strong>and</strong> Half the average 75.9 73.2 -2.7 -4%<br />
Average 71.4 62.4 -9.0 -13%<br />
Twice the average 72.4 63.8 -8.6 -12%<br />
UK Half the average 51.9 63.8 11.9 23%<br />
Average 39.8 40.9 1.1 3%<br />
Twice the average 28.3 29.2 0.9 3%<br />
Belgium Half the average 74.2 78.7 4.5 6%<br />
Average 62.1 63.7 1.6 3%<br />
Twice the average 50.6 51.7 1.1 2%<br />
Czech Repub. Half the average 86.7 95.3 8.6 10%<br />
Average 58.1 64.1 6.0 10%<br />
Twice the average 44.6 49.4 4.8 11%<br />
Reforms that strengthened the l<strong>in</strong>k between contributions <strong>and</strong> earn<strong>in</strong>gs<br />
Pol<strong>and</strong> Half the average 97.1 74.4 -22.7 -23%<br />
Average 76.9 74.9 -2.0 -3%<br />
Twice the average 69.7 75.0 5.3 8%<br />
Slovakia Half the average 76.4 66.3 -10.1 -13%<br />
Average 75.9 72.7 -3.2 -4%<br />
Twice the average 52.2 74.9 22.7 43%<br />
Hungary Half the average 85.9 94.3 8.4 10%<br />
Average 83.2 105.5 22.3 27%<br />
Twice the average 79.1 99.2 20.1 25%<br />
A<strong>cross</strong>-the-board cuts <strong>in</strong> benefits<br />
Austria Half the average 98.4 90.5 -7.9 -8%<br />
Average 99.2 90.3 -8.9 -9%<br />
Twice the average 95.1 86.3 -8.8 -9%<br />
Italy Half the average 99.1 74.8 -24.3 -25%<br />
Average 99.1 74.8 -24.3 -25%<br />
Twice the average 99.2 77.1 -22.1 -22%<br />
Portugal Half the average 106.1 63.7 -42.4 -40%<br />
Average 112.0 69.6 -42.4 -38%<br />
Twice the average 110.8 72.0 -38.8 -35%<br />
Source: OECD 2009, pp.80<br />
17