4Q11_Earnings_Presentation - ADCB
4Q11_Earnings_Presentation - ADCB
4Q11_Earnings_Presentation - ADCB
Create successful ePaper yourself
Turn your PDF publications into a flip-book with our unique Google optimized e-Paper software.
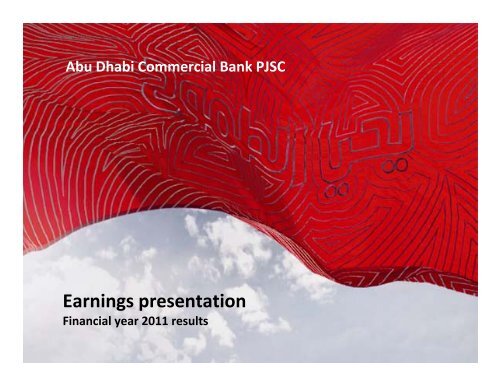
Abu Dhabi Commercial Bank PJSC<br />
<strong>Earnings</strong> presentation<br />
Financial year 2011 results<br />
1
Disclaimer<br />
This document has been prepared by Abu Dhabi Commercial Bank PJSC (“<strong>ADCB</strong>”) for information purposes only. The information,<br />
statements and opinions contained in this presentation do not constitute a public offer under any applicable legislation or an offer to<br />
sell or solicitation of an offer to buy any securities or financial instruments or any advice or recommendation with respect to such<br />
securities or other financial instruments. This document shall not be reproduced, distributed or transmitted without the consent of<br />
<strong>ADCB</strong> and is not intended for distribution in any jurisdiction in which such distribution would be contrary to local law or reputation.<br />
The material contained in this presentation is intended to be general background information on <strong>ADCB</strong> and its activities and does<br />
not purport to be complete. It may include information derived from publicly available sources that have not been independently<br />
verified and inconsistencies between sub-totals and totals due to rounding errors. No representation or warranty is made as to the<br />
accuracy, completeness or reliability of the information. It is not intended that this document be relied upon as advice to investors or<br />
potential investors, who should consider seeking independent professional advice depending on their specific investment objectives,<br />
financial situation or particular needs.<br />
Without prejudice to the foregoing, we do not accept any liability whatsoever for any loss howsoever arising, directly or indirectly,<br />
from the use of this presentation or its contents or otherwise arising in connection with this presentation.<br />
This document may contain certain forward-looking statements with respect to certain of <strong>ADCB</strong>’s plans and its current goals and<br />
expectations relating to future financial conditions, performance and results. These statements relate to <strong>ADCB</strong>’s current view with<br />
respect to future events and are subject to change, certain risks, uncertainties and assumptions which are, in many instances,<br />
beyond <strong>ADCB</strong>’s control and have been made based upon management’s expectations and beliefs concerning future developments<br />
and their potential effect upon <strong>ADCB</strong>.<br />
By their nature, these forward-looking statements involve risk and uncertainty because they relate to future events and<br />
circumstances which are beyond <strong>ADCB</strong>’s control, including, among others, the UAE domestic and global economic and business<br />
conditions, market related risks such as fluctuations in interest rates and exchange rates, the policies and actions of regulatory and<br />
Governmental authorities, the impact of competition, the timing impact and other uncertainties of future acquisition or combinations<br />
within relevant industries.<br />
As aresult, <strong>ADCB</strong>’s actual future condition, performance and results maydiffer materially from the plans, goals and expectations ti set<br />
out in <strong>ADCB</strong>’s forward-looking statements and persons reading this document should not place reliance on forward-looking<br />
statements. Such forward-looking statements are made only as at the date on which such statements are made and <strong>ADCB</strong> does not<br />
undertake to update forward-looking statements contained in this document or any other forward-looking statement it may make.<br />
2
Key messages…<br />
• Strong core banking franchise delivering record income and net profit<br />
• Improved funding profile and margins<br />
• Improved asset quality and cost of risk<br />
• Strong capital position and comfortable liquidity idit levels<br />
l<br />
• Investing in people, p businesses, systems and technology for long term growth<br />
• Strengthening position in the UAE<br />
3
<strong>ADCB</strong> –a leading bank in the UAE…<br />
Overview<br />
Investment grade rating<br />
• Third largest bank in the UAE and second largest in the Emirate<br />
of Abu Dhabi in terms of total assets, 12% market share by<br />
loans and 10% market share by deposits as at 30 September<br />
2011 *<br />
Long term<br />
rating<br />
Short term<br />
rating<br />
Outlook<br />
S&P* A A‐1 Stable<br />
• Serving over 450,000 retail customers and over 34,000<br />
corporate and SME clients in 48 branches and 4 pay offices in<br />
the UAE, 2 branches in India and 1 offshore branch in Jersey<br />
• The Bank is listed on the Abu Dhabi Securities Market, with a<br />
market cap of AED 16 bn as at 31 December 2011<br />
* Source: UAE Central Bank<br />
Strong and supportive government ownership<br />
Moody’s A1 P‐1 Negative<br />
Fitch A+ F1 Stable<br />
RAM AAA P1 Stable<br />
* Ratings raised to A/A‐1 on improved capitalisation after sale of stake in RHB Capital Berhad,<br />
June 21, 2011. Previous rating A‐/A‐2/Stable<br />
<strong>ADCB</strong> – recent timeline and milestones<br />
• 58.08% owned by the Government of Abu Dhabi through the Abu 1985 • Established following merger of three local Abu Dhabi banks<br />
Dhabi Investment Council (ADIC)<br />
• Second largest bank shareholding by the Government of Abu Dhabi<br />
• Strong government representation on <strong>ADCB</strong>’s board including one<br />
member from the Department of Finance,<br />
two members from Abu Dhabi hbiInvestment<br />
Investors<br />
Authority (ADIA) and three members<br />
3%<br />
from ADIC<br />
• Government support provided to<br />
local banks including <strong>ADCB</strong>, AED 4<br />
bn Tier I capital notes in Q1’09<br />
Foreign<br />
Tasameem Real<br />
Estate Co LLC<br />
6%<br />
Others<br />
33%<br />
ADIC<br />
58%<br />
2001 • Listed on Abu Dhabi Securities Market<br />
2003<br />
2005<br />
2006<br />
• Bank‐wide reorganization designed to create competitive,<br />
contemporary and full‐service bank<br />
• Established treasury and corporate finance joint ventures with<br />
Australia’s Macquarie Bank<br />
• Developed “<strong>ADCB</strong> Fast Forward” programme to restructure and<br />
overhaul Bank’s products<br />
2008 • Acquired 25% of Malaysia’s RHB Capital Berhad<br />
2010<br />
• Completed acquisition of RBS’ UAE retail, wealth lhmanagement and<br />
SME banking businesses<br />
• Terminated treasury joint venture arrangement with Macquarie Bank<br />
* As at 31 December 2011<br />
2011 • Sale of RHB Capital Berhad Stake<br />
4
Analysis of <strong>ADCB</strong>’s full year and quarterly results…<br />
Full year<br />
Quarterly trends<br />
Income Statement highlights (AED mn) 2011 2010 % Change 4Q'11 4Q'10 % Change<br />
Total net interest and Islamic financing income 4,688 3,682 27 1,391 1,034 35<br />
Non ‐interest income 1,382 1,317 5 231 327 (29)<br />
Operating income 6,069 5,000 21 1,623 1,361 19<br />
Operating expenses (2,063) (1,649) 25 (548) (379) 45<br />
Operating profit before impairment allowances 4,006 3,351 20 1,075 982 9<br />
Net impairment allowances (2,398) (3,287) (27) (549) (647) (15)<br />
Share of (loss)/profit of associates 159 336 (53) (9) 43 N/A<br />
Net gain on sale of investment in associate 1,314 ‐ ‐ ‐ ‐ ‐<br />
Overseas income tax expense (36) (9) N/A (2) (7) (71)<br />
Net profit for the period 3,045 391 N/A 514 371 39<br />
Basic earnings per share (AED) 0.51 0.04 AED 0.47 0.09 0.07 AED 0.02<br />
Balance sheet highlights Dec'11 Dec'10 % Change Dec'11 Dec'10 % Change<br />
Total assets 183,726 178,271 3 183,726 178,271 3<br />
Gross loans and advances 130,467 129,068 1 130,467 129,068 1<br />
Deposits from customers 109,887 106,134 4 109,887 106,134 4<br />
Ratios Dec'11 Dec'10 YoY Bps change Dec'11 Dec'10 QoQ Bps change<br />
Capital adequacy ratio (%) 22.51 16.65 586 22.51 16.65 586<br />
Tier I ratio (%) 15.90 11.97 393 15.90 11.97 393<br />
Loan to deposit ratio (%) 113.53 115.68 (215) 113.53 115.68 (215)<br />
ROE (%)* 16.74 1.54 1,520 11.33 10.14 119<br />
ROAA (%)* 1.56 0.14 142 1.10 0.88 22<br />
* For ROE/ROAA calculations, net profit attributable to equity shareholders is considered, i.e., net profit after deducting minority interest and interest expense on Tier 1 capital notes and adding back interest<br />
expense on mandatory convertible securities.<br />
Balance sheet strength (December 2011 vs. December 2010 highlights)<br />
• Balance sheet restructuring yielding results<br />
– Disciplined lending and focus on liability gathering, gross loans +1% YoY, and customer<br />
deposits +4% YoY<br />
– Loan to deposit ratio reported at lowest level at 113.53%<br />
• Improved asset quality<br />
– NPL ratio at 4.6% compared to 11.1%* in 2010 (*5.8% excluding Dubai World exposure)<br />
– Provision coverage improved to 80.0% compared to 44.1%* in 2010 (*69.6% excluding Dubai<br />
World exposure)<br />
– Cost of risk reported at reported at 1.77% in 2011 compared to 2.61% in 2010<br />
• Strengthened capital adequacy and comfortable liquidity levels<br />
– CAR at 22.51% compared to 16.65% in 2010<br />
– Net interbank lender of AED 18.7 bn as at 31 December 2011<br />
Positive earnings momentum (2011 vs. 2010 highlights)<br />
• Robust operating performance with record levels of income and net profit<br />
– Net profit of AED 3,045 mn, compared to AED 391 mn in 2010<br />
– Record net interest and Islamic financing income at AED 4,688 mn, +27% YoY<br />
– Non‐interest income increased to AED 1,382 mn, +5% YoY<br />
– Operating income at record level reaching AED 6,069 mn, +21% YoY<br />
• Healthy margins and improved cost of funding<br />
– NIMs increased to 3.10% in 2011, compared to 2.57% in 2010<br />
– CoF reported at lowest level lat 2.16% compared to 2.64% in 2010<br />
• Lower impairment allowance charges<br />
– Net impairment allowance charge was AED 2,398 mn, ‐27% YoY<br />
– Provision for loans and advances were AED 2,082 mn (net), ‐27% YoY<br />
• Disciplined cost management<br />
– Cost to income ratio at 33%<br />
5
Lower funding costs and improved NIM’s…<br />
Nti Net interest tincome*<br />
Eoltionof Evolution of yields<br />
2011 vs. 2010<br />
AED<br />
mn<br />
+35% +27%<br />
1,034 926 1,036 1,335 1,391<br />
2,016 1,894 1,846 1,969 2,009<br />
‐982 (968) (810) (634) (617)<br />
Interest income<br />
‐37%<br />
* Includes income from Islamic banking<br />
Non‐interest income*<br />
Interest expense<br />
3,682 4,688<br />
7,376<br />
+5%<br />
7,716<br />
(3,694) (3,028)<br />
‐18%<br />
5.44% 5.15% 4.99% 5.12% 5.20%<br />
2.71% 2.69% 2.80%<br />
2.79%<br />
2.52%<br />
2.31%<br />
3.47%<br />
3.60%<br />
1.85% 1.77%<br />
Q4'10 Q1'11 Q2'11 Q3'11 Q4'11<br />
Q4’10 Q1’11 Q2’11 Q3’11 Q4’11 2010 2011<br />
Yield on interest earning assets<br />
Yield on interest bearing liabilities<br />
Net interest margin<br />
Operating income contribution split<br />
Record<br />
net-interest<br />
income<br />
+27%<br />
AED 4,688 mn<br />
NIM<br />
2011<br />
3.10%<br />
CoF<br />
2010<br />
2.64%<br />
AED<br />
mn<br />
‐29%<br />
400<br />
327<br />
386<br />
36 35<br />
117 102 105<br />
254 263 247<br />
364<br />
116<br />
35<br />
13<br />
206 183<br />
‐44<br />
Q4'10 Q1'11 Q2'11 Q3'11 Q4'11<br />
42<br />
+5%<br />
1,382<br />
1,317<br />
53 148<br />
308 336<br />
956 898<br />
4,560 5,000 6,069<br />
72% 74% 77%<br />
28% 26% 23%<br />
2.57%<br />
2010<br />
2.16%<br />
2011<br />
231 Non-interest<br />
income<br />
2010 2011<br />
AED<br />
mn<br />
2009 2010 2011<br />
+5%<br />
AED 1,382 mn<br />
■ Net fees & commission income ■ Net trading income ■ Other operating income**<br />
* Excludes share of profit of associates<br />
** Other operating income includes decrease in fair value of investment properties and loss on disposal of subsidiary<br />
% net interest income contribution<br />
% non‐interest income contribution<br />
6
Strong core banking franchise delivering record income and net profit…<br />
Operating income* Operating expenses 2011 vs. 2010<br />
AED<br />
mn<br />
1,361 1,326 1,422<br />
+19% +21%<br />
1,699 1,623<br />
5,000<br />
6,069<br />
Q4'10 Q1'11 Q2'11 Q3'11 Q4'11 2010 2011<br />
AED<br />
mn<br />
27% 30% 37% 31% 34% 31% 33%<br />
427<br />
379<br />
43<br />
39<br />
126 200<br />
560<br />
44<br />
528 548<br />
47 46<br />
315 300 280<br />
214 184 201 181 221<br />
Q4'10 Q1'11 Q2'11 Q3'11 Q4'11<br />
1,649<br />
109<br />
830<br />
2,063<br />
181<br />
1,095<br />
711 787<br />
2010 2011<br />
* Excludes share of profit from associates<br />
■ General admin expenses ■ Staff costs ■ Depreciation and amortisation<br />
Operating profit and impairment allowances<br />
Cost to income ratio (includes share of profit of associates)<br />
Net profit<br />
Record<br />
operating income<br />
+21%<br />
AED 6,069 mn<br />
Record<br />
operating profit<br />
before impairment<br />
+20%<br />
AED 4,006 mn<br />
AED<br />
mn<br />
+9% +20%<br />
4,006<br />
3,351<br />
982<br />
1,171 899 862<br />
1,075<br />
(400)<br />
(647)<br />
(514) (549)<br />
(935)<br />
(2,398)<br />
(3,287)<br />
2009 2010 2011*<br />
3,045<br />
Impairment<br />
Allowances<br />
charged<br />
AED 2,398 mn<br />
- 27%<br />
‐15% ‐27%<br />
Q4’10 Q1’11 Q2’11 Q3’11 Q4’11 2010 2011<br />
■ Operating profit ■ Impairment allowances<br />
AED<br />
mn<br />
(513)<br />
391<br />
* Includes AED 1.3 bn from sale of investment in associate<br />
Cost to income<br />
ratio<br />
33%<br />
2011<br />
7
Loan to deposit reported at lowest levels…<br />
Loan to deposit ratio<br />
Net loans and customer deposits<br />
Highlights<br />
135.12%<br />
‐2,159 bps<br />
115.68%<br />
‐215 bps<br />
113.53%<br />
AED<br />
bn<br />
116.6<br />
86.3<br />
+27%<br />
106.1 109.9<br />
122.8 124.8<br />
Loan split<br />
Abu Dhabi<br />
65%<br />
&<br />
26%<br />
Dubai<br />
2009 2010 2011 2009 2010 2011<br />
Composition of assets (AED 184 bn)<br />
Derivative<br />
financial<br />
instruments<br />
3%<br />
Investments*<br />
8%<br />
Fixed and<br />
other assets<br />
Net loans and<br />
advances<br />
68%<br />
Cash and<br />
balances with<br />
Central Banks Deposits and<br />
4% balances due<br />
from banks<br />
11%<br />
Net loans<br />
Customer deposits<br />
Split of the loan portfolio, gross (AED 130 bn)<br />
Energy<br />
Development<br />
& construction<br />
19% Others*<br />
Personal<br />
Collateralised<br />
12%<br />
Domestic focus<br />
96%<br />
gross loans<br />
in the UAE<br />
6% 5%<br />
Real estate<br />
9%<br />
Real estate<br />
investment,<br />
investment<br />
contractor<br />
10%<br />
finance,<br />
development &<br />
construction<br />
Government<br />
2%<br />
Financial<br />
institutions<br />
7%<br />
Services<br />
23%<br />
Personal retail<br />
loans &<br />
overdrafts<br />
13%<br />
29%<br />
of gross loans<br />
*Investments include: investment securities, investment in associates and<br />
investment properties<br />
*Agriculture, contractor finance, trading, manufacturing, transport and others<br />
8
Improved asset quality and provision coverage…<br />
NPL ratio and provision ii coverage ratio<br />
NPLs and impairment allowances<br />
■ NPL ratio — Provision coverage ratio<br />
67.8%<br />
44.1%<br />
80.0%**<br />
14,278<br />
■ NPLs<br />
■ Collective impairment<br />
■ Individual impairment<br />
52% 5.2%<br />
* Includes Dubai World exposure<br />
** Excludes Dubai World exposure and related provision<br />
11.1%<br />
4.6%<br />
2009 2010* 2011<br />
AED<br />
mn<br />
6,242<br />
4,232<br />
1,505<br />
2,727<br />
6,296<br />
1,643<br />
4,653<br />
6,025<br />
2009 2010** 2011<br />
* Includes provision for Dubai World exposure<br />
** Includes Dubai World exposure<br />
Highlights<br />
g<br />
5,712<br />
2,059<br />
3,653*<br />
Cost of risk *<br />
2009<br />
3.21%<br />
2011<br />
1.77%<br />
2.61%<br />
2010 144 bps<br />
* Total provisions including investments/ average loans & advances and investments<br />
• Portfolio impairment allowance balance was AED 2,059 mn and<br />
1.59% of credit risk weighted assets as at 31 December 2011. The<br />
UAE Central Bank directive requires banks to increase the level of<br />
collective provisions to 1.50% of credit risk weighted assets by 2014<br />
• Impairment allowances on doubtful loans and advances, net of<br />
recoveries amounted to AED 2,082 mn in 2011, compared to AED<br />
2,860 mn in 2010, 27% lower<br />
• The estimated fair value of collateral and other security<br />
enhancements held against loans and advances to customers and<br />
banks for the year ended 2011 was AED 83,740 mn compared to AED<br />
85,754 mn in 2010<br />
• In 2011 a loan of AED 6,749 mn has been transferred from impaired<br />
to performing category based on the performance of agreed<br />
renegotiated terms.<br />
9
Growing customer deposits, strengthened funding profile…<br />
Composition of liabilities bl (AED 162 bn)<br />
Customer deposits by counterparty<br />
+4%<br />
106.1 109.9<br />
+47%<br />
AED 109.9 bn<br />
AED 106.1 bn<br />
57% 56%<br />
2011 vs. 2010<br />
CASA<br />
*<br />
+ 15%<br />
AED 27 bn<br />
*Includes call & demand<br />
deposits and savings deposits<br />
AED<br />
bn<br />
8.9<br />
‐88%<br />
Long term<br />
borrowings<br />
1.1 4.8 3.1<br />
3.9<br />
4.8<br />
Due to banks<br />
Derivative<br />
financial<br />
instruments<br />
13.9 11.9<br />
Other<br />
liabilities<br />
2010 2011<br />
21.0<br />
30.8<br />
Short and<br />
medium term<br />
borrowings<br />
Customer<br />
deposits<br />
22% 23%<br />
21% 21%<br />
2011 2010<br />
Government Retail Corporate<br />
Composition of wholesale l funding Maturity profile as at 31 December 2011<br />
Time deposits*<br />
AED 64 bn<br />
- 4%<br />
Islamic product<br />
deposits*<br />
+ 20%<br />
Source of funds AED mn<br />
2%<br />
9,699 Sukuk notes<br />
GMTN/EMTN 8,277<br />
22%<br />
AED 18 bn<br />
9%<br />
1,836 Sub debt*<br />
Sub. FRN* 7,790 22%<br />
GMTN/EMTN<br />
*AED 9 bn in 2011 and AED 7 bn in<br />
17%<br />
2010 Islamic deposits taken by<br />
Syndicated loans 7,858<br />
Syndicated dloans<br />
23% 5%<br />
5,182 4,993<br />
352<br />
Euro CP<br />
Interbank 3,090<br />
1,253 3,673<br />
Euro Commercial paper 717<br />
Other** 6,135<br />
Islamic sukuk notes 1,836<br />
Total 35,703<br />
* Includes AED 6.6 bn Tier II loan from UAE Ministry of Finance<br />
** Includes AED 2.9 bn of borrowing through total return swaps and AED 3.2 bn<br />
of borrowing through repurchase agreement<br />
AED<br />
mn<br />
4,113<br />
3,740<br />
3,673<br />
1,456<br />
7,790<br />
717<br />
964 73<br />
Total sources<br />
2012 2013 2014 2015 2016 2017 2018 of wholesale<br />
l<br />
funding<br />
* Includes AED 6.6 bn Tier II loan<br />
1,456 72<br />
964<br />
bank’s treasury in the normal course<br />
of business have been reclassified<br />
from time deposits to Islamic<br />
product deposits<br />
AED 36 bn<br />
10
Net CDS exposure reduced substantially…<br />
Funded dinvestment securities ii (AED 15 bn)<br />
Remaining funded FRN & CDO exposure<br />
Equity<br />
1.25%<br />
Mutual funds<br />
0.78% Government<br />
securities<br />
21.47%<br />
FRN & CDO<br />
2.74%<br />
201 ( 179 )<br />
Bonds<br />
73.77%<br />
AED<br />
mn<br />
22<br />
44<br />
Gross exposure<br />
Impairment<br />
allowance<br />
Fair value<br />
adjustment<br />
Net Exposure<br />
Net unfunded investments<br />
Available for sale investment securities<br />
3,500<br />
3,000<br />
2,500<br />
2,000<br />
1,500<br />
1,000<br />
500<br />
‐<br />
28%<br />
15%<br />
11%<br />
7%<br />
6%<br />
4% 4%<br />
0%<br />
Dec'07 Dec'08 Dec'09 Dec'10 Mar'11 June'11 Sep'11 Dec'11<br />
Ratings 2011 2010<br />
AED’ 000 AED’ 000<br />
Aaa to Aa 3 6,513,130 4,480,019<br />
A 1 to A 3 5,059,478 2,458,829<br />
Baa1 to Ba 3 1,679,903 280,077<br />
B1 to B 3 706,829 549,167<br />
Not rated 1,092,763 495,045<br />
CDS outstanding (AED mn)<br />
% of Tangible equity<br />
Total 15,052,103 8,263,137<br />
11
Strong capital position, comfortable liquidity levels and funding profile…<br />
Capital position and risk weighted assets<br />
Capital adequacy ratio and Tier I ratio<br />
Highlights<br />
AED<br />
bn<br />
138.5<br />
135.4 137.6<br />
31.0<br />
24.1 22.6<br />
7.0 6.3<br />
17.1 16.2<br />
9.1<br />
21.9<br />
22.51%<br />
17.38%<br />
16.65%<br />
15.90%<br />
12.35% 11.97%<br />
CAR<br />
22.51% 5<br />
Tier I<br />
ratio<br />
bn 15.90%<br />
2009 2010 2011<br />
2009 2010 2011<br />
Tier 1 capital Tier 2 capital Risk weighted assets (AED bn)<br />
Total equity and reserves<br />
CAR Tier I ratio * Net interbank<br />
lender of<br />
AED19 bn<br />
* Liquidity ratio * 15.28%<br />
AED<br />
bn<br />
15.9<br />
19.11 19.6<br />
22.1<br />
2008 2009 2010 2011<br />
* Tier I capital notes of AED 4 bn included in equity since March 2009<br />
2011<br />
2010<br />
2009<br />
17.45%<br />
22.13%<br />
685 bps<br />
*Liquid assets include cash and balances with Central Banks, deposits and<br />
balances due from banks, trading securities, and liquid investments (liquidity<br />
ratio is calculated as follows: liquid assets divided by total assets)<br />
*Certificate of deposits with<br />
Central Bank is considered as<br />
due to banks for the purpose<br />
of calculating net position in<br />
interbank market<br />
Liquidity<br />
ratio<br />
22.13%<br />
12
Awards in 2011…<br />
Best Retail Bank in the UAE<br />
By<br />
Best Corporate Governance in<br />
United Arab Emirates<br />
By<br />
World Finance<br />
Corporate Governance Awards<br />
Best SME Account Award<br />
By<br />
Banker Middle East product awards 2011<br />
March 2011<br />
2 0 1 1<br />
<strong>ADCB</strong> won the coveted Best Credit Card Award for its<br />
LuLu Credit Card and the Best Co‐branded Card Award for<br />
its Etihad Guest Above Credit Card<br />
March 2011<br />
Best Commercial Bank Award<br />
By<br />
Banker Middle East Industry Awards<br />
April 2011<br />
World’s Safest Banks 2011 in the Middle East<br />
Ranked number seven by<br />
Global Finance Magazine<br />
May 2011 June 2011<br />
Financial Institution of the Year<br />
at<br />
The ACC 3rd Annual International GRC &<br />
Financial Crimes Conference and Exhibition<br />
Most Improved Islamic Bank in the UAE<br />
By<br />
the Global Islamic Finance Awards<br />
(GIFA) committee<br />
August 2011<br />
November 2011<br />
December 2011<br />
13


