Optionetics Platinum
Optionetics Platinum
Optionetics Platinum

You also want an ePaper? Increase the reach of your titles
YUMPU automatically turns print PDFs into web optimized ePapers that Google loves.
<strong>Optionetics</strong> <strong>Platinum</strong><br />
Users Manual
Table of Contents<br />
General Information Before Beginning<br />
Login Information<br />
Free Reports<br />
Start Mode<br />
User Data Settings<br />
Creating, Editing, and Saving Trades<br />
Create a Trade<br />
Quick Create Mode<br />
Editing a Trade<br />
Recalling a Saved Trade<br />
Back Testing a Trade<br />
Profit and Loss Reporting<br />
Closing a Trade<br />
Creating Option Tables<br />
Creating Charts with <strong>Platinum</strong><br />
Reading Modern Risk Graphs<br />
Modern Version Risk Graphs<br />
Understanding Volatility on the <strong>Platinum</strong> Site<br />
VIX – Market Volatility Index<br />
Visualizing Volatility Graphs<br />
Creating and Manipulating Stock Lists<br />
Creating a Stock List<br />
Using Sectors and Industries<br />
Ranking a Stock List<br />
Searching and Scanning Trades<br />
Creating a New Search<br />
Find Trades 1 Searches<br />
Find Trades 2 Searches<br />
Find Trades 3 Searches<br />
Saving and Recalling Searches<br />
Help<br />
Definitions and Glossary<br />
Contact Us
Chapter 1 General Information Before Beginning<br />
In this chapter, you will learn:<br />
Login Information<br />
Free Reports<br />
Start Mode<br />
User Data Settings
1. Getting Started with <strong>Platinum</strong><br />
Access through Tabs or<br />
through the log in on the<br />
home page.<br />
The <strong>Platinum</strong> site can be accessed from the tabs section on the top of the web sit or in the<br />
log in area as indicated above. The <strong>Platinum</strong> site is <strong>Optionetics</strong>.com proprietary options<br />
analysis software program that is available for an annual fee. There are many factors and<br />
complexities that need to be understood and analyzed when trading options. This tool<br />
really brings out the power of the personal computer and will make you a much more<br />
sophisticated investor. This software package is self-contained and does not require any<br />
downloads or data feeds. You can access it anywhere all you need is your user name and<br />
password and access to the Internet!<br />
From the Home Page, simply click on the <strong>Optionetics</strong> <strong>Platinum</strong> Tab at the TOP, or you<br />
may log in at the logon box built in the Home Page. Buy clicking on the Tab; you have a<br />
few other features to look at.<br />
Click on the Tab that says <strong>Optionetics</strong> <strong>Platinum</strong> NOW
Lets go here first<br />
The area shown provides FREE reports each day on stocks and options. Those include:<br />
Expensive<br />
Cheap<br />
Breakout Hi Call Top% Inc<br />
Breakout Low Call Bot% Dec<br />
Explosive Highest Vol Put Top% Inc<br />
Quiet Highest Open Put Bot% Dec<br />
Ranker: The Expensive and Cheap links brings up the high and low implied volatility<br />
rankings for the stocks in our database. The percentile IV ranker is used. We do not rank<br />
stocks with a closing price of less than 12.5. We allow stocks with no volume that day to<br />
be in the ranking. Multiple stocks are often at their highs or their lows. The ranking<br />
reverts to ranking by volume for all stocks that have the same implied volatility rankings.<br />
The rankings can be used to form trading strategies based on the fact that volatility<br />
usually returns back to the mean. A simple strategy is to buy options that have<br />
historically low volatility and sell options that have high volatility.
Explosive and Quiet use the highest high and lowest low IV for the ranking. Breakout Hi<br />
and Breakout Low use the Bollinger Bands to determine if the IV is breaking out of a<br />
channel.<br />
Our historical data starts 2 years and 1 month from today's date. The ranking will use up<br />
to 2 years of historical data. We began using full historical 2 year data rankings in Feb<br />
2000.<br />
Each stock name in the tables is linked to go to find a trade for that stock. CLICK the<br />
stock name to go there.<br />
Call Top % Inc finds the option call prices that had the largest 1 day increase and ranks<br />
the options according to the percent increase.<br />
Call Bot % Dec finds the option call prices that had the largest 1 day decrease and ranks<br />
the options according to the percent decrease.<br />
Put Top % Inc finds the option put prices that had the largest 1 day increase and ranks<br />
the options according to the percent increase.<br />
Put Bot % Dec finds the option put prices that had the largest 1-day decrease and ranks<br />
the options according to the percent decrease.<br />
Highest Volume finds the options that had the largest 1-day total trading volume and<br />
ranks the options according to the volume.<br />
Highest Open finds the options that had the largest 1-day total Open Interest and ranks<br />
the options according to the Option Interest.<br />
In the above tables, clicking an option symbol takes you to the risk graph with that option<br />
trade loaded.<br />
Here is an example of cheap options for November 9, 2001. Keep in mind that although<br />
I only have 10 shown here, the report will show the Top 50 for any report loaded.
Now what did this mean? Well it means out of ALL optionable stocks ranked over the<br />
last 1 year of option premiums, these were the cheapest when looking at each ones past.<br />
Lets look at the first two.<br />
Tyco looks pretty cheap at 29.13% volatility but why is Immunex ranked at number 2<br />
when others had cheaper implied volatility today? Because the report ranks each stock<br />
on what IT did for the year, not ranking them against each other. If that were the case,<br />
John Deere would show up on top every day. We want to know when Immunex is cheap<br />
and when it’s expensive. Look at the High IV, Low IV, and Current IV. The Current is<br />
very close to the Low, meaning that its very cheap when looking back over the last year<br />
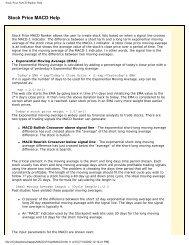
of trading. Lets look at a picture of Immunex to better understand the report.<br />
This should better explain the report. See what Immunex has done lately in option<br />
volatility? It has dropped like a stone, meaning that the Options are cheap when<br />
comparing the IV over the past.<br />
Being able to rank stocks or options in a single click can save valuable time when trying<br />
to chase down what’s high or low, what’s cheap or expensive, and what’s bullish or<br />
bearish from an option traders point of view.
Creating, Editing, and Saving Trades<br />
Log In Here<br />
Type in user name and password in the boxes provided. Then click LOGIN or hit the<br />
ENTER key.<br />
IF YOU DON’T HAVE A USER NAME OR PASSWORD, CALL OPTIONETICS<br />
AT THE NUMBERS PROVIDED TO YOU.
Start Modes<br />
Creating and<br />
Saving Trades<br />
User<br />
Setup<br />
User Help<br />
Viewing and<br />
Updating Past<br />
Trades<br />
Ranking<br />
Stock Lists<br />
Option<br />
Trade<br />
Searches<br />
When logging on to the <strong>Platinum</strong> Site, a welcome message will appear. Also, one of 3<br />
Start Modes will appear.<br />
START MODES - Novice traders may wish to use the Standard start, which has a few of<br />
the easier methods, while Advanced Traders will get a more Advanced Start Mode. The<br />
Site Map, shown here, shows everything that the platinum site will do all on one window.<br />
SITE MAP – this mode has several things to see and do, but for this chapter we are going<br />
to focus strictly on Creating, Editing, and Saving Trades and Strategies. To create and<br />
save trades, you simply go no farther than the BLUE outlined above.<br />
For Viewing past trades or Updating any trades that were created earlier, you will go to<br />
the area highlighted in GREEN. Starting on the next page, we are going to create a trade.
Site Map – Your Starting Point<br />
The first area we want to visit once logging on is the User Data section. In this section,<br />
we can:<br />
Set our General Settings to our preferences<br />
Set our Display Settings for trades and reporting features<br />
Set Backtesting Dates<br />
Change our password<br />
Look at rankings<br />
Use the Options Calculator<br />
Click on the General Settings link to begin
General Settings<br />
These settings determine the way the platinum site will be delivering information to you.<br />
Each setting represents a different part of the platinum site.<br />
The tab you are looking at right now is the General Settings tab. It includes settings that<br />
determine what email address you want info sent to, option volume and volatility<br />
settings, and stock list settings.<br />
To change this information, simply click on any down arrow key and choose from the list<br />
available.<br />
Once complete, click on the SAVE button at the bottom. Your settings will be saved.
Search Display Settings<br />
Search Display settings allow the user to change the look of the risk graphs created, as<br />
well as the information reported back on each trade. Depending on what type of trader<br />
you are may depend on how you set up this information. To add information to the trade<br />
results, simply click on any box to activate.<br />
The first set of boxes are for the “My View” display. This is information that goes to the<br />
search output.<br />
The second set of information is simply how you want your default view to look.<br />
As with the general tab, click on the SAVE button when completed. Your information<br />
will be saved.
Backtest Date Display<br />
This is used to set the date of the backtesting function. I like to leave this as todays date,<br />
and set the beginning of the report to when I want to start a backtest. This can be left<br />
alone, and set each time a different backtest is preformed without having to come back to<br />
this tab each time.<br />
Change Password Display<br />
Here is where you will come if you ever need to change your password. All that is<br />
needed here is your current password, along with your new password.<br />
As with the other tabs, click on SAVE to complete this information.
The Calculators - Stock Calculator<br />
This stock calculator is designed to give you theoretical prices on both calls and puts by<br />
simply typing in the information on the left. Once the info has been typed in, click<br />
CALCULATE on the bottom to see the information on the right hand side of the screen.<br />
Remember that these are theoretical, meaning that they are a computer model of what the<br />
price should be. Also, models are best used when using end of day data, preferably the<br />
bids and offers, and not the last price, as last price may be stale depending on liquidity.<br />
Option Calculators are designed to give you an idea of what an option is worth,<br />
theoretically.<br />
The next page shows an Index Option pricing model.
Option Calculator – Index Options<br />
This Index calculator is designed to give you theoretical prices on both calls and puts by<br />
simply typing in the information on the left. Once the info has been typed in, click<br />
CALCULATE on the bottom to see the information on the right hand side of the screen.<br />
Remember that these are theoretical, meaning that they are a computer model of what the<br />
price should be. Also, models are best used when using end of day data, preferably the<br />
bids and offers, and not the last price, as last price may be stale depending on liquidity.<br />
This index calculator is designed for both American and European models. It gives the<br />
trader an idea of the difference between an option that can be exercised at any time<br />
(American), and one that can only be exercised at expiration (European).<br />
Option Calculators are designed to give you an idea of what an option is worth,<br />
theoretically.
Finding a Symbol – Site Map<br />
Ever had trouble remembering a stock symbol when you want a quote, or an option<br />
chain? Using the platinum symbol search can help solve this problem.<br />
From the Site Map:<br />
Click on Symbol Search
Symbol Search<br />
Enter in the name of the company you wish to get a symbol on and click on Name Search<br />
link.<br />
The stock symbol(s) will appear below, which you can add to a stock list or find a trade<br />
from by clicking on GO.<br />
This is the easiest ways to find a symbol and begin creating a trade.