

Ju8uG
Ju8uG
Ju8uG

Create successful ePaper yourself
Turn your PDF publications into a flip-book with our unique Google optimized e-Paper software.
32 Low-carbon Africa: leapfrogging to a green future Low-carbon and renewable potential<br />
Table 7: Low-carbon Africa – business as usual (BAU) and abatement potential (giga tonnes carbon<br />
dioxide equivalent, GtCO 2 e per year) 122<br />
BAU Emissions<br />
Abatement potential<br />
2005 2020 2030 2020 2030<br />
Africa South Africa 0.4 0.6 0.7 0.2 0.5<br />
Rest of Africa 2.7 3.2 3.5 1.3 2.4<br />
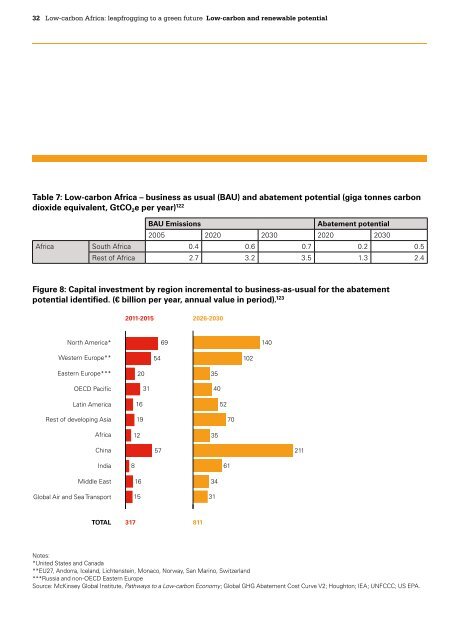
Figure 8: Capital investment by region incremental to business-as-usual for the abatement<br />
potential identified. (€ billion per year, annual value in period). 123<br />
2011-2015 2026-2030<br />
North America* 69<br />
140<br />
Western Europe**<br />
54<br />
102<br />
Eastern Europe***<br />
OECD Pacific<br />
Latin America<br />
20<br />
16<br />
31<br />
35<br />
40<br />
52<br />
Rest of developing Asia<br />
19<br />
70<br />
Africa<br />
12<br />
35<br />
China<br />
57<br />
211<br />
India<br />
8<br />
61<br />
Middle East<br />
Global Air and Sea Transport<br />
16<br />
15<br />
34<br />
31<br />
TOTAL<br />
317 811<br />
Notes:<br />
*United States and Canada<br />
**EU27, Andorra, Iceland, Lichtenstein, Monaco, Norway, San Marino, Switzerland<br />
***Russia and non-OECD Eastern Europe<br />
Source: McKinsey Global Institute, Pathways to a Low-carbon Economy; Global GHG Abatement Cost Curve V2; Houghton; IEA; UNFCCC; US EPA.