PDF Download - New River Kinematics
PDF Download - New River Kinematics
PDF Download - New River Kinematics

You also want an ePaper? Increase the reach of your titles
YUMPU automatically turns print PDFs into web optimized ePapers that Google loves.
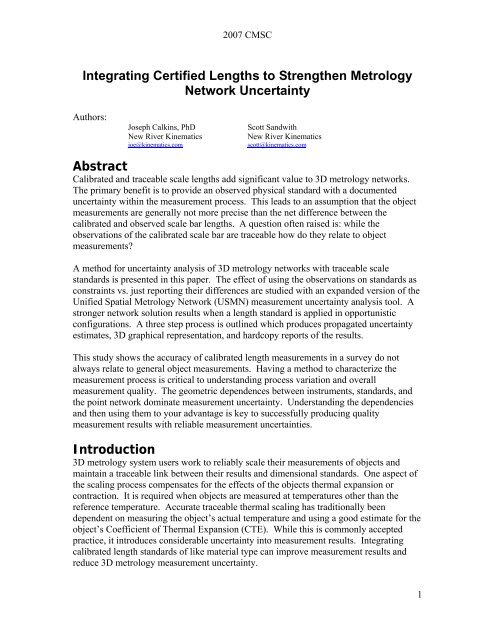
2007 CMSC<br />
Integrating Certified Lengths to Strengthen Metrology<br />
Network Uncertainty<br />
Authors:<br />
Joseph Calkins, PhD<br />
<strong>New</strong> <strong>River</strong> <strong>Kinematics</strong><br />
joe@kinematics.com<br />
Scott Sandwith<br />
<strong>New</strong> <strong>River</strong> <strong>Kinematics</strong><br />
scott@kinematics.com<br />
Abstract<br />
Calibrated and traceable scale lengths add significant value to 3D metrology networks.<br />
The primary benefit is to provide an observed physical standard with a documented<br />
uncertainty within the measurement process. This leads to an assumption that the object<br />
measurements are generally not more precise than the net difference between the<br />
calibrated and observed scale bar lengths. A question often raised is: while the<br />
observations of the calibrated scale bar are traceable how do they relate to object<br />
measurements?<br />
A method for uncertainty analysis of 3D metrology networks with traceable scale<br />
standards is presented in this paper. The effect of using the observations on standards as<br />
constraints vs. just reporting their differences are studied with an expanded version of the<br />
Unified Spatial Metrology Network (USMN) measurement uncertainty analysis tool. A<br />
stronger network solution results when a length standard is applied in opportunistic<br />
configurations. A three step process is outlined which produces propagated uncertainty<br />
estimates, 3D graphical representation, and hardcopy reports of the results.<br />
This study shows the accuracy of calibrated length measurements in a survey do not<br />
always relate to general object measurements. Having a method to characterize the<br />
measurement process is critical to understanding process variation and overall<br />
measurement quality. The geometric dependences between instruments, standards, and<br />
the point network dominate measurement uncertainty. Understanding the dependencies<br />
and then using them to your advantage is key to successfully producing quality<br />
measurement results with reliable measurement uncertainties.<br />
Introduction<br />
3D metrology system users work to reliably scale their measurements of objects and<br />
maintain a traceable link between their results and dimensional standards. One aspect of<br />
the scaling process compensates for the effects of the objects thermal expansion or<br />
contraction. It is required when objects are measured at temperatures other than the<br />
reference temperature. Accurate traceable thermal scaling has traditionally been<br />
dependent on measuring the object’s actual temperature and using a good estimate for the<br />
object’s Coefficient of Thermal Expansion (CTE). While this is commonly accepted<br />
practice, it introduces considerable uncertainty into measurement results. Integrating<br />
calibrated length standards of like material type can improve measurement results and<br />
reduce 3D metrology measurement uncertainty.<br />
1
2007 CMSC<br />
Thermal Compensation Scaling for 3D Metrology<br />
When building or verifying objects a reference temperature for the project is defined. It<br />
is typically 20° C (68° F.) However objects are seldom measured in the shop at the<br />
reference temperature. A thermal compensation scale factor is applied to the<br />
measurements to compensate the actual measurements to represent object dimensions<br />
when it is at the reference temperature. With measurement results at the reference<br />
temperature they are compared against nominal configurations or other measurements of<br />
mating assembly components. The process goal enables analysis of assembly<br />
components (e.g., fuselages and hull sections) measured at different temperatures to be<br />
compared.<br />
The “accuracy” or more appropriately “uncertainty” of the thermal scaling process and its<br />
effect on the measurement result can consume significant portions of part tolerances. An<br />
error in the scale factor is considered a systematic error and therefore can be cumulative.<br />
It is directly proportional to object size so a small error in the thermal compensation scale<br />
is magnified when applied to a large part. Confidently and accurately compensating for<br />
thermal change is an important element of sound metrology practice.<br />
Thermal Length Compensation<br />
The dimension change induced by temperature difference is significant. A function to<br />
compute the expected dimensional change uses nominal object length, the material’s<br />
CTE, and temperature delta from the reference.<br />
The length of the object (L i ) at temperatures other than the reference is modeled with the<br />
function below.<br />
L = L (1 − αΔT<br />
)<br />
where :<br />
L<br />
L<br />
i<br />
i<br />
0<br />
α =<br />
0<br />
= actual length at temperature<br />
= calibrated length at reference<br />
temperature<br />
CTE for scale bar material (ppm/<br />
ΔT<br />
= temperature delta between reference and actual<br />
o<br />
and temperature ( C)<br />
The length of a 2-meter long aluminum object at different temperatures is shown in the<br />
graph below.<br />
o<br />
C)<br />
2
2007 CMSC<br />
Thermal Length Compensation (2 meter Alumimum Scale Bar)<br />
2001.20<br />
2001.00<br />
2000.80<br />
2000.60<br />
Length (mm)<br />
2000.40<br />
2000.20<br />
2000.00<br />
1999.80<br />
1999.60<br />
1999.40<br />
0 5 10 15 20 25 30 35 40 45<br />
Object Temperature (C)<br />
At the reference temperature the bar is 2-meters long. At 30° C (86° F) the bar length is<br />
expected to be 2000.47 mm (78.7587 inches) based on the Thermal Length<br />
Compensation function. Changing the bar’s temperature by 10° C (18° F) the bar length<br />
changes 0.47 mm (0.0186”).<br />
Length<br />
Thermal Compensation Errors<br />
The process and results using the thermal compensation function are straight-forward to<br />
implement in 3D metrology software. Understanding the sources of potential error in this<br />
process and their effects is significant. There are three components and potential sources<br />
of error in the thermal compensation function. The sources of error include object<br />
temperature delta from the reference, a material CTE and when using a calibrated length<br />
standard for comparison, it’s published length uncertainty.<br />
Object temperature is typically measured in one or possibly two locations on the object<br />
with a thermocouple device. The unit may or may not be certified depending on<br />
measurement process controls. The measurements are generally done on the surface of<br />
the object. Good practice suggests using a certified thermocouple or infra-red<br />
temperature monitor to make the object temperature measurements.<br />
There are several sources of temperature measurement error in computing the expect<br />
length change with thermal compensation function. For the delta temperature input in the<br />
function the core/average temperature of the object is needed to get accurate results. An<br />
object’s surface temperature is generally not the same as its core or average temperature<br />
in shop environments. Surface temperatures will typically change faster than core<br />
temperature.<br />
Shop environments generally have vertical temperature gradients. Meaning the<br />
temperature at the floor level is not the same at the top of the part or tool. The<br />
3
2007 CMSC<br />
atmospheric temperature may vary by 5° C within 4 or 5 meters. It makes selecting the<br />
optimal location to measure an object’s average temperature difficult to determine.<br />
Additional complications are apparent because the temperature gradient tends to induce<br />
an expansion gradient in the object being measured. Compensating for a thermal<br />
expansion gradient across an object is not typical in 3D metrology software. Typical 3D<br />
metrology processes ignore potential thermal expansion gradients. The common practice<br />
is to make a single temperature measurement at a convenient location on the part/tool<br />
surface and assume that it is representative for the entire object.<br />
Certification certificates for typical shop object temperature measurement equipment<br />
generally state ±0.5 ° C (±1 ° F) uncertainties. The variably between temperature<br />
measurement units is significant given the amount of dimensional uncertainty that results<br />
when the object temperature vary by this amount. <strong>New</strong>er temperature sensors are<br />
available with certifications in the range of ±0.04 ° C (reference: ScAlert specification by<br />
4G Metrology).<br />
Getting an accurate estimate for an object’s material CTE property is important when<br />
using the thermal compensation function to adjust the actual measurements to the<br />
reference temperature. The publish values for particular material vary by alloy and<br />
condition. A report by NIST indicates the CTE material property can vary significantly<br />
from the published value. http://emtoolbox.nist.gov/Temperature/Slide14.asp#Slide14<br />
Material properties references publish average CTE values over temperature ranges. The<br />
range of interest for 3D metrology application is about the typical reference temperature<br />
of 20°C. However the value at 20 °C is seldom available. The average values are in<br />
general, averages over the range 0-100 C, and the uncertainty of the published values is<br />
estimated to be 3-5 % (k = 2) over this temperature range.<br />
Large parts and tools are generally not made from a single material type. Different<br />
materials each with different CTE’s are commonly measured metrology applications.<br />
Estimating a CTE for a structure made with different material types can be a significant<br />
challenge. When large structures are mounted or secured in the concrete floor the<br />
combination becomes more complex when using the thermal compensation function.<br />
Certified Scale Length Uncertainty<br />
When metrology labs certify scale bars a point to point distance is provided. Along with<br />
the distance an uncertainty statement for the point to point distance is provided. The<br />
uncertainty is based on the calibration process in the laboratory. The measurement<br />
method and precision of the instruments used to measure the distance between the points<br />
are used to quantify the certification uncertainty.<br />
There are several characteristics about certified scale bars that are of interest.<br />
Specifically the distance between the points is now a known quantity at the reference<br />
temperature. The scale bar material type is also known. Typically scale bars are<br />
produced with the same material as the object being measured in the shop/factory. The<br />
uncertainty for the distance between these points is generally small when compared to the<br />
part tolerances.<br />
4
2007 CMSC<br />
Checking/Confirming Thermal Compensation<br />
With measurements of object temperature and the material’s CTE property, metrology<br />
system users scale their measurements of objects at shop temperatures to match the<br />
reference temperature. To check or confirm that the scaling process was accurately<br />
applied one or more calibrated scale bar(s) of known material are measured. When the<br />
calibrated bar is made from the same material as the object the scaled measurements of<br />
its length should match the published calibration length.<br />
Common metrology practice enforces the condition that the measured point to point<br />
distance must match the calibrated distance within ±0.05 mm (0.002”). When the<br />
measurements and bar length match within the tolerance the measurement results pass<br />
this acceptance criteria.<br />
The point to point measurements of the certified bar are used to confirm the thermal<br />
compensation function was correctly applied. The process uses the certified bar to check<br />
the object temperature measurement and CTE value.<br />
Propagation of Uncertainty<br />
The propagation of uncertainty characterizes the probability and range of values within<br />
which the true value lies. It is used to reliably model the dependence of variable<br />
uncertainty on the uncertainty of the functions output. The variables in thermal<br />
compensation are object temperature, material CTE and the point to point distance<br />
measurement uncertainty.<br />
The uncertainty for a distance can be bounded by the absolute error of the functions<br />
output. In this case the effect of the input variable uncertainties (or errors) on the thermal<br />
compensation function are studied. This uncertainty model is limited to the effect of<br />
thermal compensation.<br />
The thermal compensation function/model and assumptions for an analysis example are<br />
shown below.<br />
Li<br />
= L0<br />
( 1−αΔT<br />
)<br />
f ( L , α,<br />
ΔT<br />
) = L<br />
0<br />
0<br />
Uncertainty of L<br />
Example : 2 meter<br />
L<br />
= 2000 mm σ = 0.02 mm<br />
o<br />
o<br />
ΔT<br />
= −10<br />
... 20 C σ = 0.5 C<br />
i<br />
L<br />
i<br />
is a function of L , σ , α,<br />
σ , ΔT<br />
, σ<br />
Alum Scale Bar from10<br />
T<br />
o<br />
αalum<br />
= 23.8 ppm/<br />
C σ<br />
α<br />
= 5% α<br />
An equation for the variance between products by applying the Propagation of<br />
Uncertainty technique is shown below; it combines estimates from individual<br />
measurements.<br />
0<br />
L<br />
α<br />
o<br />
T<br />
o<br />
to 40 C<br />
5
2007 CMSC<br />
Model :<br />
[]<br />
U f<br />
0<br />
( 1−αΔT<br />
) = f ( L )<br />
2<br />
2 2<br />
2 2<br />
2 2<br />
[ ] = s = ( 1−<br />
αΔT<br />
) σ + ( L ΔT<br />
) σ + ( L α ) σ<br />
U L<br />
i<br />
= s<br />
L<br />
f<br />
i<br />
L<br />
=<br />
= L<br />
L<br />
i<br />
⎛ δf<br />
⎞<br />
2 ⎛ δf<br />
⎞ 2 ⎛ δf<br />
⎞ 2<br />
⎜ σ<br />
L<br />
σ<br />
α ⎜ ⎟ σ<br />
T<br />
δL<br />
⎟ + ⎜ ⎟ +<br />
⎝ 0 ⎠ ⎝ δα ⎠ ⎝ δΔT<br />
⎠<br />
2<br />
0<br />
α<br />
2<br />
0<br />
T<br />
1<br />
A graph of the scale bar length uncertainty verse a range of object temperatures is shown<br />
in the chart.<br />
2-m Alum Object Length Uncertainty (2-sigma) vs. Object Temperatures<br />
0.08<br />
0.06<br />
0.04<br />
Length Uncertainty (mm)<br />
0.02<br />
0.00<br />
0 5 10 15 20 25 30 35 40 45<br />
-0.02<br />
-0.04<br />
-0.06<br />
-0.08<br />
Measured Scale Bar Temperature (C)<br />
+UL (mm)<br />
-UL (mm)<br />
For this example a 2-meter (78.74”) aluminum scale bar certification certificate reports<br />
an uncertainty of 0.0254 mm (±0.001”) with k = 2. The uncertainty of the bar when used<br />
in the shop at the reference temperature is 0.035 mm (0.0014”). This number is bigger<br />
than the certification certificate due to effects of the temperature measurement<br />
uncertainty.<br />
The uncertainty grows to 0.042 mm (0.0016”) when the delta temperature is 10 C (18 F).<br />
At a delta temperature of 20 C (36 F) the bars uncertainty grows to 0.059 mm (0.0023”).<br />
The difference is due to the effects of temperature measurement and CTE uncertainty.<br />
Each of the individual uncertainty components is compared by computing a unit vector at<br />
each temperature. Each component’s relative contribute is shown in the scale length<br />
uncertainty components chart below.<br />
1 Leo Goodman (1960). "On the Exact Variance of Products" in Journal of the American Statistical<br />
Association, December, 1960, pp. 708-713.<br />
6
2007 CMSC<br />
CTE Scaling Components of Unit Vector<br />
0.90<br />
0.06<br />
Component Uncertainty<br />
(Unit Vector)<br />
0.80<br />
0.70<br />
0.60<br />
0.50<br />
0.40<br />
0.30<br />
0.20<br />
0.10<br />
0.05<br />
0.04<br />
0.03<br />
0.02<br />
0.01<br />
Total Scale Uncertainty (mm)<br />
0.00<br />
0.00<br />
0 5 10 15 20 25 30 35 40 45<br />
Material Temperature (C)<br />
Base Length Uncertainty Temperature Uncertainty CTE Uncertainty Base Length Uncertainty<br />
Temperature Uncertainty CTE Uncertainty +UL (mm)<br />
The chart shows that the CTE component has minimal effect when the object temperature<br />
is close to the reference temperature. However its contribution grows considerably as the<br />
object temperature deviates from the reference. The CTE component becomes the<br />
dominate uncertainty contributor past a delta of 10° C (18° F).<br />
Common metrology systems (e.g., Laser Trackers) are able to make measurements on 2-<br />
meter long objects with uncertainties that are less than the thermal compensation<br />
uncertainties shown in the charts above. The implication is using the thermal<br />
compensation function to set the survey scale can add significant amounts of variability<br />
to measurement results. Variability increases as the object temperature deviates from the<br />
reference.<br />
Thermal Compensation Uncertainty Example<br />
When the scale factor from thermal compensation process is applied to larger objects an<br />
the error gets magnified. The chart below shows the thermal compensation uncertainty<br />
for a 9.78-m (32-ft) aluminum object. At a delta temperature of 10 C (18 F) the<br />
uncertainty is 0.165 mm (0.0065”) with k=2.<br />
7
2007 CMSC<br />
9.78-m Alum Object Length Uncertainty due to<br />
Thermal Comp (2-sigma) vs. Object Temperature<br />
Length Uncertainty (mm)<br />
0.30<br />
0.20<br />
0.10<br />
0.00<br />
-0.10<br />
-0.20<br />
-0.30<br />
0 5 10 15 20 25 30 35 40 45<br />
Measured Scale Bar Temperature (C)<br />
+UL (mm)<br />
-UL (mm)<br />
These thermal compensation uncertainties are seen on the shop floor. The variation in<br />
measurement results are perceived as instrument or setup repeatability issues. The<br />
underlying property is related to precisely measuring the object’s core temperature<br />
relative to the reference and CTE variability.<br />
CTE Scaling Component Uncertainty Percentile<br />
(Aluminum Object 9.74 m)<br />
Percentile of Uncertainty (%)<br />
120%<br />
100%<br />
80%<br />
60%<br />
40%<br />
20%<br />
0.300<br />
0.250<br />
0.200<br />
0.150<br />
0.100<br />
0.050<br />
0%<br />
0.000<br />
0 5 10 15 20 25 30 35 40 45<br />
Material Temperature (C)<br />
Base Length Uncertainty Temperature Uncertainty CTE Uncertainty Base Length Uncertainty<br />
Temperature Uncertainty CTE Uncertainty +UL (mm)<br />
The calibrated scale bar length uncertainty is a small component when the measuring<br />
larger objects. This result is apparent because an object temperature measurement error<br />
and CTE variation are multiplied onto a longer distance.<br />
8
2007 CMSC<br />
Solution … Better Metrology Practice<br />
A better choice when measuring large objects is to use a like-kind material calibrated<br />
scale bar(s) to scale the measurements. A function to compute a scale factor that<br />
minimizes the differences between a series of measured scale bar distances (between the<br />
points and calibrated length) is straight-forward to implement. Appling the scale factor to<br />
the instrument results in temperature compensated measurement results without<br />
measuring the temperature or estimating the material’s CTE. Error propagation analysis<br />
shows the object temperature measurement and CTE are significant uncertainty<br />
contributors.<br />
Calibrated bar uncertainties are generally less than half the thermal compensation<br />
uncertainty on larger objects based on the error propagation model analysis. Reducing<br />
measurement process uncertainty by scaling with calibrated scale bars has other benefits.<br />
Scaling with calibrated lengths integrates the traceable artifact into the measurement<br />
process. Current practices may use a traceable length to check thermal compensation<br />
results. Adding multiple bar positions enables different scaling at different vertical<br />
locations on the object. When measured into different groups or by different instrument<br />
stations a solution for local a scale factors would allow a consistent method to adjust for<br />
thermal compensation gradients. Different calibrated scale bar materials surveyed into<br />
different groups or by different instrument stations means a method to compensate for<br />
different thermal coefficients of expansions within the same survey.<br />
Temperature measurement on the object can be used as a check/validation for the scaling<br />
with calibrated bars. In this case the method with lower uncertainty is used to set the<br />
scale factor while the less-precise method is used to check it.<br />
Scale Lengths in USMN<br />
Scale lengths with uncertainty estimates can effectively be considered instruments within<br />
the network. Point to point distance residuals between observations and the calibrated<br />
distance are added as corrections to the network during the optimization. When weighted<br />
with their published uncertainty statement they constrain the resulting Composite Point<br />
group with appropriate weights. This method adds physical traceable length(s) to the<br />
network. Reports and instrument uncertainty analysis include direct comparison against<br />
these traceable standards.<br />
The USMN solution integrates scale lengths as either “Report Only” or as “Constraints”<br />
in its optimization and target uncertainty analysis processes. As “Report Only” the scale<br />
bar do not add corrections to the network. The “Report Only” configuration is the default<br />
setup. In a “Report Only” configuration users can check or confirm the network’s<br />
present thermal compensation. The figure below shows an example Measured Scale Bar<br />
report dialog when in “Report Only” mode.<br />
9
2007 CMSC<br />
Measured Scale Bar Report Analysis against Certified Lengths (Report Only)<br />
When the USMN uses measurements of scale length as constraints the network is<br />
adjusted along the components to minimize the delta between the length inputs. Each<br />
instrument station can be setup to allow its scale factor to be included in the network<br />
optimization. The figure above indicates Station 3 measurements have not been thermal<br />
compensated. Note the red outlined deltas for station 3 are higher. When instrument<br />
scale factors are included the result balances the network’s thermal compensation during<br />
the optimization. Reports of all the scale bar lengths show the resulting measurement<br />
deltas against the traceable standards.<br />
The figure below shows the Measured Scale Bar report after the multiple scale bars<br />
positions have been used as Constraints in the optimization.<br />
Measured Scale Bar Report Analysis against Certified Lengths (Constraints)<br />
An example job using multiple positions of a certified aluminum scale bar is shown in the<br />
figure below. There were 4 tracker stations in this survey. The bar was made of<br />
Aluminum and was 2.44 m (96-inches) in length. Temperature measurements of the bar<br />
showed it was between 23 C and 25 C during the measurement process. The bar was<br />
measured in different 10 positions.<br />
10
2007 CMSC<br />
Two gage these effects observations were made on two points that were 9.87-m (32 ft)<br />
apart. The uncertainty with the thermal compensation function was at 22.5 C ±0.13 mm<br />
and at 23.5 C ±0.13 mm. In this case the published certified length standard was 2.44 m<br />
(96 inches) long with an uncertainty of ±0.02 mm (0.001 inches). The survey was scaled<br />
with thermal compensation function and then scaled using the scale bars. The 9.87 m<br />
point to point deltas were evaluated in both cases. The net difference between the results<br />
was 0.10 mm in the 9.87 m (≈ ±0.005” in 386”).<br />
Survey Scaled in USMN 4 stations 10 scale bar positions<br />
Conclusion<br />
Metrology systems in use in factory environments make accurate measurements on<br />
objects. A challenge for users is to reliably scale those measurements back to a reference<br />
temperature to compensate for object thermal expansion/contraction. The Propagation of<br />
Uncertainty analysis shows using the thermal compensation function to set the survey<br />
scale can add significant amounts of variability to measurement results. The variability<br />
increases as the object temperature deviates from the reference.<br />
Scaling 3D metrology surveys with the thermal compensation function using object<br />
temperature and CTE estimates increases uncertainty. Scaling the same measurement<br />
networks with certified lengths reduces measurement uncertainty and enhances<br />
traceability reporting. Scale bar constraints should be weighted by their relative<br />
published uncertainties in the network optimization.<br />
Measurement uncertainty analysis is enhanced when traceable length standards are<br />
included in the analysis and subsequent report. Target Uncertainty Field Analysis is<br />
improved by including traceable length standards.<br />
The conclusion from these results indicates using calibrated scale lengths as instruments<br />
produces better measurement results.<br />
11
2007 CMSC<br />
References<br />
1. Guidelines for Evaluating and Expressing Uncertainty of NIST Measurement Results - NIST Technical<br />
Note 1297, 1994<br />
2. Guide to the Expression of Uncertainty in Measurement, ISO, First Edition 1995.<br />
3. Theodore D. Doiron, Temperature and Dimensional Measurement, NIST report on CTE material<br />
property, NIST, Gaithersburg, MD, Web Site:<br />
http://emtoolbox.nist.gov/Temperature/Slide14.asp#Slide14<br />
4. Calkins, Joseph, Dissertation, 2002, Quantifying Coordinate Uncertainty Fields in Coupled Spatial<br />
Measurement Systems, etd-08012002-104658, http://scholar.lib.vt.edu/theses/available/etd-08012002-<br />
104658/<br />
5. Sandwith, S. C., Scale Artifact Length Dependence of Videogrammetry System Uncertainty, SPIE 3204-04,<br />
Nov. 1998.<br />
6. Phillips, Eberhardt, and Parry, Guidelines for Expressing the Uncertainty of Measurement Results<br />
Containing Uncorrected Bias”, Journal Research of NIST, Vol. 102, No. 4, July-August 1997.<br />
7. Wolf, P. R., Elements of Photogrammetry, McGraw-Hill, 1974<br />
8. Leo Goodman (1960). "On the Exact Variance of Products" in Journal of the American Statistical<br />
Association, December, 1960, pp. 708-713.<br />
12