2012 Holistic Assessment of Health Sector POW - Ministry of Health
2012 Holistic Assessment of Health Sector POW - Ministry of Health
2012 Holistic Assessment of Health Sector POW - Ministry of Health

Create successful ePaper yourself
Turn your PDF publications into a flip-book with our unique Google optimized e-Paper software.
2.0 <strong>Assessment</strong> <strong>of</strong> indicator trends<br />
2.1 <strong>Health</strong> Objective 1: Bridge equity gaps in health care and ensure<br />
sustainable financing arrangements that protect the poor<br />
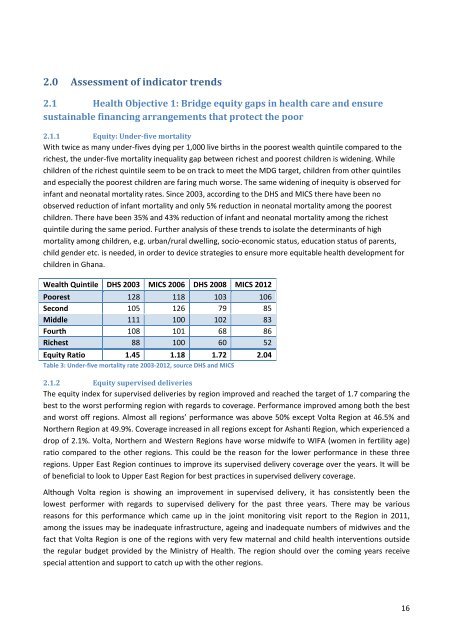
2.1.1 Equity: Under-five mortality<br />
With twice as many under-fives dying per 1,000 live births in the poorest wealth quintile compared to the<br />
richest, the under-five mortality inequality gap between richest and poorest children is widening. While<br />
children <strong>of</strong> the richest quintile seem to be on track to meet the MDG target, children from other quintiles<br />
and especially the poorest children are faring much worse. The same widening <strong>of</strong> inequity is observed for<br />
infant and neonatal mortality rates. Since 2003, according to the DHS and MICS there have been no<br />
observed reduction <strong>of</strong> infant mortality and only 5% reduction in neonatal mortality among the poorest<br />
children. There have been 35% and 43% reduction <strong>of</strong> infant and neonatal mortality among the richest<br />
quintile during the same period. Further analysis <strong>of</strong> these trends to isolate the determinants <strong>of</strong> high<br />
mortality among children, e.g. urban/rural dwelling, socio-economic status, education status <strong>of</strong> parents,<br />
child gender etc. is needed, in order to device strategies to ensure more equitable health development for<br />
children in Ghana.<br />
Wealth Quintile DHS 2003 MICS 2006 DHS 2008 MICS <strong>2012</strong><br />
Poorest 128 118 103 106<br />
Second 105 126 79 85<br />
Middle 111 100 102 83<br />
Fourth 108 101 68 86<br />
Richest 88 100 60 52<br />
Equity Ratio 1.45 1.18 1.72 2.04<br />
Table 3: Under-five mortality rate 2003-<strong>2012</strong>, source DHS and MICS<br />
2.1.2 Equity supervised deliveries<br />
The equity index for supervised deliveries by region improved and reached the target <strong>of</strong> 1.7 comparing the<br />
best to the worst performing region with regards to coverage. Performance improved among both the best<br />
and worst <strong>of</strong>f regions. Almost all regions’ performance was above 50% except Volta Region at 46.5% and<br />
Northern Region at 49.9%. Coverage increased in all regions except for Ashanti Region, which experienced a<br />
drop <strong>of</strong> 2.1%. Volta, Northern and Western Regions have worse midwife to WIFA (women in fertility age)<br />
ratio compared to the other regions. This could be the reason for the lower performance in these three<br />
regions. Upper East Region continues to improve its supervised delivery coverage over the years. It will be<br />
<strong>of</strong> beneficial to look to Upper East Region for best practices in supervised delivery coverage.<br />
Although Volta region is showing an improvement in supervised delivery, it has consistently been the<br />
lowest performer with regards to supervised delivery for the past three years. There may be various<br />
reasons for this performance which came up in the joint monitoring visit report to the Region in 2011,<br />
among the issues may be inadequate infrastructure, ageing and inadequate numbers <strong>of</strong> midwives and the<br />
fact that Volta Region is one <strong>of</strong> the regions with very few maternal and child health interventions outside<br />
the regular budget provided by the <strong>Ministry</strong> <strong>of</strong> <strong>Health</strong>. The region should over the coming years receive<br />
special attention and support to catch up with the other regions.<br />
16