Survey Report 2010-1 LA.pdf - NASCOLA
Survey Report 2010-1 LA.pdf - NASCOLA
Survey Report 2010-1 LA.pdf - NASCOLA

Create successful ePaper yourself
Turn your PDF publications into a flip-book with our unique Google optimized e-Paper software.
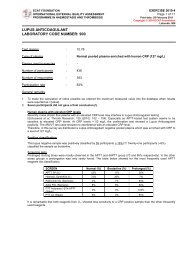
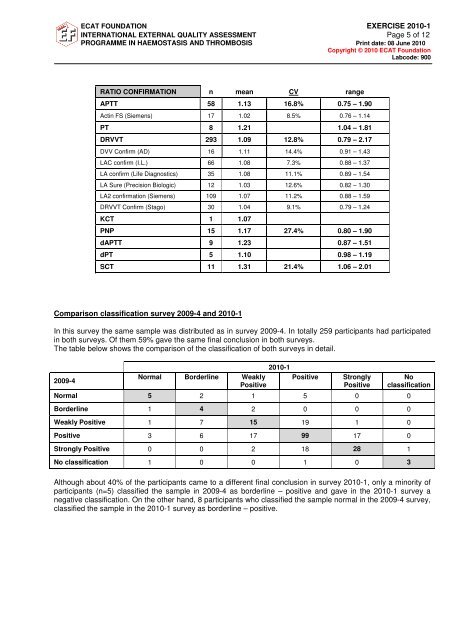
ECAT FOUNDATION EXERCISE <strong>2010</strong>-1<br />
INTERNATIONAL EXTERNAL QUALITY ASSESSMENT Page 5 of 12<br />
PROGRAMME IN HAEMOSTASIS AND THROMBOSIS Print date: 08 June <strong>2010</strong><br />
Copyright © <strong>2010</strong> ECAT Foundation<br />
Labcode: 900<br />
RATIO CONFIRMATION n mean CV range<br />
APTT 58 1.13 16.8% 0.75 – 1.90<br />
Actin FS (Siemens) 17 1.02 8.5% 0.76 – 1.14<br />
PT 8 1.21 1.04 – 1.81<br />
DRVVT 293 1.09 12.8% 0.79 – 2.17<br />
DVV Confirm (AD) 16 1.11 14.4% 0.91 – 1.43<br />
<strong>LA</strong>C confirm (I.L.) 66 1.08 7.3% 0.88 – 1.37<br />
<strong>LA</strong> confirm (Life Diagnostics) 35 1.08 11.1% 0.89 – 1.54<br />
<strong>LA</strong> Sure (Precision Biologic) 12 1.03 12.6% 0.82 – 1.30<br />
<strong>LA</strong>2 confirmation (Siemens) 109 1.07 11.2% 0.88 – 1.59<br />
DRVVT Confirm (Stago) 30 1.04 9.1% 0.79 – 1.24<br />
KCT 1 1.07<br />
PNP 15 1.17 27.4% 0.80 – 1.90<br />
dAPTT 9 1.23 0.87 – 1.51<br />
dPT 5 1.10 0.98 – 1.19<br />
SCT 11 1.31 21.4% 1.06 – 2.01<br />
Comparison classification survey 2009-4 and <strong>2010</strong>-1<br />
In this survey the same sample was distributed as in survey 2009-4. In totally 259 participants had participated<br />
in both surveys. Of them 59% gave the same final conclusion in both surveys.<br />
The table below shows the comparison of the classification of both surveys in detail.<br />
2009-4<br />
<strong>2010</strong>-1<br />
Normal Borderline Weakly Positive<br />
Positive<br />
Strongly<br />
Positive<br />
No<br />
classification<br />
Normal 5 2 1 5 0 0<br />
Borderline 1 4 2 0 0 0<br />
Weakly Positive 1 7 15 19 1 0<br />
Positive 3 6 17 99 17 0<br />
Strongly Positive 0 0 2 18 28 1<br />
No classification 1 0 0 1 0 3<br />
Although about 40% of the participants came to a different final conclusion in survey <strong>2010</strong>-1, only a minority of<br />
participants (n=5) classified the sample in 2009-4 as borderline – positive and gave in the <strong>2010</strong>-1 survey a<br />
negative classification. On the other hand, 8 participants who classified the sample normal in the 2009-4 survey,<br />
classified the sample in the <strong>2010</strong>-1 survey as borderline – positive.