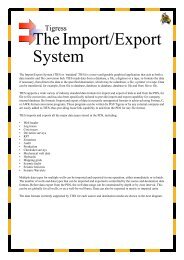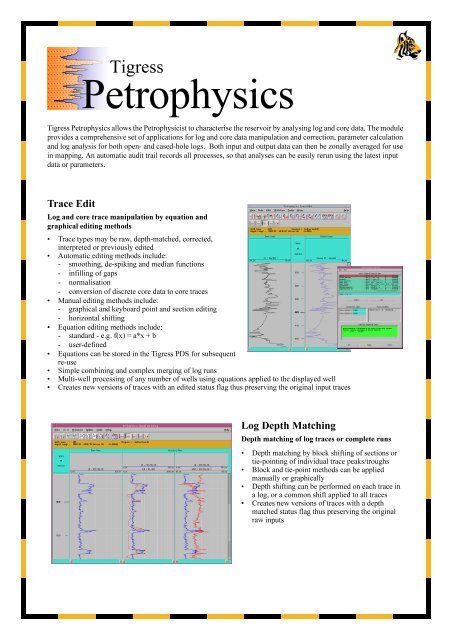
Tigress Petrophysics Brochure
Tigress Petrophysics Brochure
Tigress Petrophysics Brochure

You also want an ePaper? Increase the reach of your titles
YUMPU automatically turns print PDFs into web optimized ePapers that Google loves.
<strong>Tigress</strong><br />
<strong>Petrophysics</strong><br />
<strong>Tigress</strong> <strong>Petrophysics</strong> allows the Petrophysicist to characterise the reservoir by analysing log and core data. The module<br />
provides a comprehensive set of applications for log and core data manipulation and correction, parameter calculation<br />
and log analysis for both open- and cased-hole logs. Both input and output data can then be zonally averaged for use<br />
in mapping. An automatic audit trail records all processes, so that analyses can be easily rerun using the latest input<br />
data or parameters.<br />
Trace Edit<br />
Log and core trace manipulation by equation and<br />
graphical editing methods<br />
• Trace types may be raw, depth-matched, corrected,<br />
interpreted or previously edited<br />
• Automatic editing methods include:<br />
- smoothing, de-spiking and median functions<br />
- infilling of gaps<br />
- normalisation<br />
- conversion of discrete core data to core traces<br />
• Manual editing methods include:<br />
- graphical and keyboard point and section editing<br />
- horizontal shifting<br />
• Equation editing methods include:<br />
- standard - e.g. f(x) = a*x + b<br />
- user-defined<br />
• Equations can be stored in the <strong>Tigress</strong> PDS for subsequent<br />
re-use<br />
• Simple combining and complex merging of log runs<br />
• Multi-well processing of any number of wells using equations applied to the displayed well<br />
• Creates new versions of traces with an edited status flag thus preserving the original input traces<br />
Log Depth Matching<br />
Depth matching of log traces or complete runs<br />
• Depth matching by block shifting of sections or<br />
tie-pointing of individual trace peaks/troughs<br />
• Block and tie-point methods can be applied<br />
manually or graphically<br />
• Depth shifting can be performed on each trace in<br />
a log, or a common shift applied to all traces<br />
• Creates new versions of traces with a depth<br />
matched status flag thus preserving the original<br />
raw inputs
<strong>Tigress</strong><br />
<strong>Petrophysics</strong><br />
Corrections<br />
Correction of log traces for borehole and environmental effects<br />
• Correction charts for Schlumberger, Western Atlas, Gearhart and<br />
BPB logs<br />
• User-defined correction programs can be written in C, Fortran or<br />
the <strong>Tigress</strong> programming language<br />
• Logging and mud details are automatically read from the log<br />
header<br />
• Utilises caliper or bit-size data for borehole corrections<br />
• Accepts a combination of induction log, laterolog, and microresistivity<br />
log traces for environmental correction<br />
• Gaps in Rt and Rxo can be filled by merging with resistivity<br />
traces, by logic or by interpolation<br />
• User-defined trace/chart combinations can be selected for<br />
environmental corrections<br />
• Error listing facility to identify why gaps have been produced and<br />
traces not corrected<br />
• Multi-well processing of any number of wells<br />
Well View<br />
Formation Test Analysis<br />
Multi-well interpretation of RFT data to determine fluid<br />
contact type, depth and pressure<br />
• Displays up to 100 RFT runs simultaneously, coded by well,<br />
by zone or by pressure type<br />
• Displays pressure/time data for individual RFT measurements<br />
• Simple graphical clustering/selection of points for regression<br />
to generate fluid gradients<br />
• Regression methods include X on Y, Y on X, RMA, forced<br />
and user-defined<br />
• Gradients and contact type, depth and pressure are saved for<br />
use in <strong>Tigress</strong> Geology and Simulation<br />
• Complete user control over plot layout, annotation, symbols,<br />
colours, scales, grids and hardcopy<br />
Entry of a well's historical construction and production history events<br />
• ASCII file and spreadsheet entry of all events<br />
• Historical construction events are graphically illustrated as a wellbore schematic<br />
diagram<br />
• Schematic can be displayed for any period in the well's history<br />
• Display of well zonation to ensure correct completion<br />
• Twenty one construction events including:<br />
• drilling, casing, cement, perforation, packers, liners, tubing, pumps etc.<br />
• Five geology and production events: production data, flowmeter, static tests, logging,<br />
coring<br />
2
<strong>Tigress</strong><br />
<strong>Petrophysics</strong><br />
Crossplot<br />
Display and crossplot analysis of multi-well data, geophysics<br />
horizons and mapping surfaces for reservoir characterisation<br />
• Data types for display include log and interpreted traces,<br />
conventional and special core data, zone parameters, time/<br />
depth data, structure and attribute maps and horizons<br />
• Data on display can be filtered by well, zone, cluster, cut-off,<br />
z-plot band prior to analysis<br />
• Hot link to Well Correlation & Zonation, Log Plot, other<br />
Crossplots and Cluster Analysis for sample highlighting<br />
• Industry standard pre-defined crossplots (and associated<br />
regression techniques) include:<br />
- Density/Neutron/Sonic<br />
- D/N/S/Qv./FRF/K v. porosity<br />
- Hingle/Pickett<br />
- M/N<br />
- Pef and NGT<br />
- Leverett J/RI/height/depth v. Sw<br />
- Porosity/Rt v. Sigma<br />
- Grain density/porosity v. K<br />
• User-defined crossplots can be generated using any input data types<br />
• Zonal parameters are generated from standard analyses and cut-offs defined in pre-defined plots<br />
• Normal regression methods include X on Y, Y on X, RMA, forced and user-defined<br />
• Chart overlays for density/neutron/sonic crossplots, M-N plots and NGS plots<br />
• Complete user control over plot layout, annotation, symbols, colours, scales, grids and hardcopy<br />
Parameter Table<br />
Histogram<br />
Display and histogram analysis of multi-well trace and core data<br />
• Data display by well and/or by zone<br />
• Overlay of different data or similar data from different wells/<br />
zones<br />
• Full statistical summary including mean, mode, median,<br />
averages<br />
• Determination of GR min and max for clay volume<br />
interpretation<br />
• Determination of matrix density for porosity interpretation<br />
• Complete user control over plot layout, annotation, symbols,<br />
colours, scales, grids and hardcopy<br />
Spreadsheet display, manipulation and export of input and<br />
output zonal parameters<br />
• Displays input zonal parameters required for log and core<br />
interpretation and output parameters generated from<br />
averaging and thickness calculations<br />
• Pre-defined parameter table views (crossplot; output; openhole<br />
etc.) and user-defined table views<br />
• Parameter population using default values for quick look<br />
interpretation<br />
• Automatic copying of parameters between wells and zones<br />
• Table editor functions for copying and pasting parameter values<br />
• Fast re-read of parameters when updated in another application<br />
• Output file formats include ASCII, spreadsheet and Irap with full control over the file format<br />
3
<strong>Tigress</strong><br />
<strong>Petrophysics</strong><br />
<strong>Petrophysics</strong> Interpretation<br />
Determination of lithology volume, porosity and<br />
saturation from log, core and zonal data using<br />
standard and user-defined equations<br />
• Input data includes pre-corrected and corrected<br />
open hole logs, cased hole logs, core data and zonal<br />
parameters generated in the Crossplot and<br />
Histogram applications<br />
• Generation and display of porosity, saturation,<br />
sand, lime, dolomite, clay, shale, silt ,calcite, coal,<br />
salt and anhydrite<br />
• Interpreted trace value can be user-defined where<br />
mineral flags are set<br />
• Identifies bad hole using rugosity and caliper cutoffs<br />
resulting in automatic use of DT method<br />
• Application of hydrocarbon corrections on porosity<br />
using a selected saturation method<br />
• Comprehensive set of pre-defined industry standard equations:<br />
• Clay volume - single trace (e.g. GR, SP); crossplot; shaley sand; NGT and ratio; minimum; no correction<br />
• Porosity - single trace; crossplot; secondary; shaley sand; core<br />
• Saturation - Archie; Indonesia; Simandoux + Modified; Laminated Clay; Waxman-Smits; Dual water; EPT<br />
• Composite and user-defined methods per zone<br />
• Sensitivity analysis per zone or for all zones for up to 10 variations with graphical and numerical comparison<br />
• User-definable programs written in C, Fortran or the <strong>Tigress</strong> programming language<br />
• Error checking facility to identify problems with applied methods<br />
• Multi-well processing of any number of wells using methods applied to the displayed well<br />
• Interpretation process is automatically written to the Audit Trail<br />
Cluster Analysis<br />
Automatic statistical log facies analysis based upon a<br />
clustering algorithm<br />
• Generates a hierarchical cluster succession based upon<br />
similarities in selected log response<br />
• Analysis is initially performed on key well intervals and<br />
additional wells/intervals are then aggregated using the<br />
statistics derived from the key wells<br />
• Number of facies is determined by graphical selection of<br />
dendrogram cuts<br />
• Hot links to Well Correlation & Zonation and Crossplot for<br />
data loading and to highlight and review clusters and<br />
aggregation<br />
• Generates cluster traces, reservoir flags, synthetic average<br />
property traces and facies zonation for input into 3D<br />
reservoir modelling<br />
4
<strong>Tigress</strong><br />
<strong>Petrophysics</strong><br />
Zonal Averaging<br />
Calculation of zonal averages and net sand/pay<br />
from log, interpreted trace and core data<br />
• Averaging of log, interpreted trace and<br />
conventional core data, based upon cut-offs<br />
defined graphically or manually<br />
• Definition of new averaged parameters<br />
• Cut-offs can also be defined in the Crossplot<br />
and Parameter Table applications<br />
• Calculates arithmetic, geometric and harmonic<br />
averages over net sand, net pay and user-defined<br />
areas<br />
• Any other trace or core data can be used as<br />
discriminator for net sand/pay identification and<br />
data averaging<br />
• Option to exclude thin layers of pay or sand<br />
from the averaging process<br />
• Multi-well processing of any number of wells<br />
• Averaging process is automatically written to the audit trail<br />
Audit Trail<br />
Log Plot<br />
Generation of single well plot of raw and interpreted<br />
data for visualisation and hardcopy<br />
• Two types of automatic plot generation:<br />
• Quick look standard plots (API format) of density/<br />
neutron log, induction log and laterolog log data<br />
• Results plot of fluid saturation, lithology, matrix<br />
density and net sand/pay<br />
• Comprehensive composite plot for flexible userdefined<br />
plotting of all raw and interpreted trace data<br />
as well as RFT, dipmeter, zones, core (raw and<br />
depth matched) and wellbore schematic<br />
• All plot types share an extensive range of display<br />
features include trace shading and shading by<br />
value, depth markers, cut-off markers<br />
• Composite plot has complete user control over plot<br />
layout, line styles and colours, scales, grids,<br />
annotation and hardcopy<br />
Keep historical records of all editing and interpretation methods that have been performed during the course<br />
of the study<br />
• All data manipulation and interpretation applications write to the Audit Trail<br />
• Records show user, date, time and details of change<br />
5
<strong>Tigress</strong><br />
<strong>Petrophysics</strong><br />
Facies Analysis<br />
<strong>Tigress</strong> Facies Workflow is additional functionality in the<br />
standard <strong>Tigress</strong> Geology and <strong>Petrophysics</strong> applications that<br />
allows the display and interpretation of facies traces. These<br />
square traces can be displayed, edited and interpreted to<br />
calculate facies distribution.<br />
Well Correlation & Zonation<br />
• Display of facies traces<br />
• Conversion of zonations into traces<br />
• All standard shading and scaling options available<br />
Trace Edit<br />
• Editing of facies traces<br />
• Combining of facies groups to a smaller<br />
number of sets<br />
• Inputting of individual descriptions for each<br />
facies<br />
Zonal Averaging<br />
• Calculation of facies distribution percentage for<br />
each zone<br />
• Summary output of percentages and dominant<br />
facies per zone<br />
• Results are saved to the database and stored in<br />
the Parameter Table<br />
Parameter Table<br />
• Facies percentage distribution for each zone<br />
stored in the PDS database<br />
• Indication of dominant facies for each zone<br />
Log Plot<br />
• Display facies traces<br />
• Facies summary and description in the plot header<br />
Log Load<br />
• Resampling of log data to one of three options; point, linear or squared<br />
Integrated by Design<br />
PGS <strong>Tigress</strong> (UK) Ltd.<br />
Anglers Court, 33-44 Spittal Street, Marlow, Buckinghamshire, SL7 1DB<br />
United Kingdom<br />
Tel. +44 1628 402400<br />
E-mail: info@tigress.co.uk<br />
Web: www.tigress.co.uk