Air Cargo: Engine For Economic Development - Aerotropolis
Air Cargo: Engine For Economic Development - Aerotropolis
Air Cargo: Engine For Economic Development - Aerotropolis

Create successful ePaper yourself
Turn your PDF publications into a flip-book with our unique Google optimized e-Paper software.
<strong>Air</strong> <strong>Cargo</strong>, Liberalization, and <strong>Economic</strong> <strong>Development</strong><br />
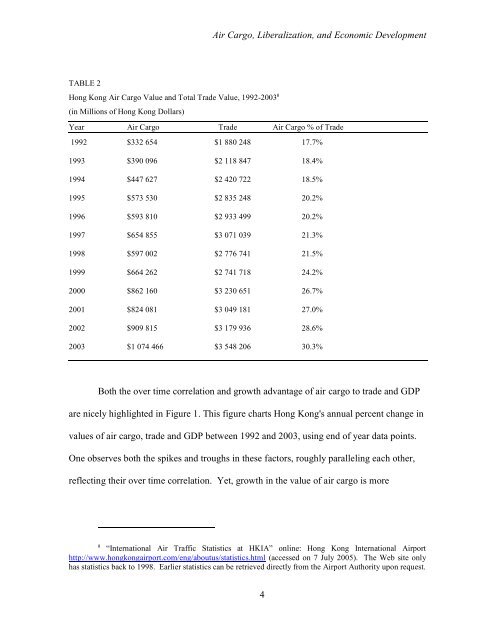
TABLE 2<br />
Hong Kong <strong>Air</strong> <strong>Cargo</strong> Value and Total Trade Value, 1992-2003 8<br />
(in Millions of Hong Kong Dollars)<br />
Year <strong>Air</strong> <strong>Cargo</strong> Trade <strong>Air</strong> <strong>Cargo</strong> % of Trade<br />
1992 $332 654 $1 880 248 17.7%<br />
1993 $390 096 $2 118 847 18.4%<br />
1994 $447 627 $2 420 722 18.5%<br />
1995 $573 530 $2 835 248 20.2%<br />
1996 $593 810 $2 933 499 20.2%<br />
1997 $654 855 $3 071 039 21.3%<br />
1998 $597 002 $2 776 741 21.5%<br />
1999 $664 262 $2 741 718 24.2%<br />
2000 $862 160 $3 230 651 26.7%<br />
2001 $824 081 $3 049 181 27.0%<br />
2002 $909 815 $3 179 936 28.6%<br />
2003 $1 074 466 $3 548 206 30.3%<br />
Both the over time correlation and growth advantage of air cargo to trade and GDP<br />
are nicely highlighted in Figure 1. This figure charts Hong Kong's annual percent change in<br />
values of air cargo, trade and GDP between 1992 and 2003, using end of year data points.<br />
One observes both the spikes and troughs in these factors, roughly paralleling each other,<br />
reflecting their over time correlation. Yet, growth in the value of air cargo is more<br />
8<br />
“International <strong>Air</strong> Traffic Statistics at HKIA” online: Hong Kong International <strong>Air</strong>port<br />
http://www.hongkongairport.com/eng/aboutus/statistics.html (accessed on 7 July 2005). The Web site only<br />
has statistics back to 1998. Earlier statistics can be retrieved directly from the <strong>Air</strong>port Authority upon request.<br />
4