Milk Protein Products and Related Government Policy Issues
Milk Protein Products and Related Government Policy Issues
Milk Protein Products and Related Government Policy Issues

Create successful ePaper yourself
Turn your PDF publications into a flip-book with our unique Google optimized e-Paper software.
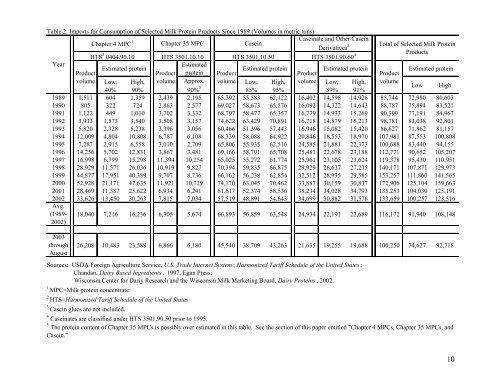
Table 2. Imports for Consumption of Selected <strong>Milk</strong> <strong>Protein</strong> <strong>Products</strong> Since 1989 (Volumes in metric tons)<br />
Caseinate <strong>and</strong> Other Casein<br />
Chapter 4 MPC 1 Chapter 35 MPC<br />
Casein<br />
Total of Selected <strong>Milk</strong> <strong>Protein</strong><br />
Derivatives 3<br />
<strong>Products</strong><br />
HTS 2 0404.90.10 HTS 3501.10.10 HTS 3501.10.50<br />
HTS 3501.90.60 4<br />
Year<br />
Estimated<br />
Estimated protein Estimated protein Estimated protein<br />
Product<br />
Product protein Product<br />
Product<br />
Product<br />
Estimated protein<br />
volume Low, High, volume Approx. volume Low, High, volume Low, High, volume<br />
40% 90%<br />
90% 5 85% 95%<br />
89% 91%<br />
Low High<br />
1989 1,511 604 1,359 2,439 2,195 65,392 55,583 62,122 16,402 14,598 14,926 85,744 72,980 80,603<br />
1990 805 322 724 2,863 2,577 69,027 58,673 65,576 16,092 14,322 14,643 88,787 75,894 83,521<br />
1991 1,122 449 1,010 3,702 3,332 68,797 58,477 65,357 16,779 14,933 15,269 90,399 77,191 84,967<br />
1992 3,933 1,573 3,540 3,508 3,157 74,622 63,429 70,891 16,718 14,879 15,213 98,781 83,038 92,801<br />
1993 5,820 2,328 5,238 3,396 3,056 60,466 51,396 57,443 16,946 15,082 15,420 86,627 71,862 81,157<br />
1994 12,009 4,804 10,808 6,787 6,108 68,339 58,088 64,922 20,846 18,553 18,970 107,981 87,553 100,808<br />
1995 7,287 2,915 6,558 3,010 2,709 65,806 55,935 62,516 24,585 21,881 22,373 100,688 83,440 94,155<br />
1996 14,256 5,702 12,831 3,867 3,481 69,166 58,791 65,708 25,481 22,678 23,188 112,771 90,652 105,207<br />
1997 16,998 6,799 15,298 11,394 10,254 65,025 55,272 61,774 25,961 23,105 23,624 119,378 95,430 110,951<br />
1998 28,929 11,571 26,036 10,919 9,827 70,394 59,835 66,875 29,929 26,637 27,235 140,171 107,871 129,973<br />
1999 44,877 17,951 40,389 9,707 8,736 66,162 56,238 62,854 32,512 28,935 29,585 153,257 111,860 141,565<br />
2000 52,928 21,171 47,635 11,921 10,729 74,170 63,045 70,462 33,887 30,159 30,837 172,906 125,104 159,663<br />
2001 28,469 11,387 25,622 6,934 6,241 61,617 52,374 58,536 38,234 34,028 34,793 135,253 104,030 125,191<br />
2002 33,626 13,450 30,263 7,815 7,034 57,519 48,891 54,643 34,699 30,882 31,576 133,659 100,257 123,516<br />
Avg.<br />
(1989-<br />
2002)<br />
18,040 7,216 16,236 6,305 5,674 66,893 56,859 63,548 24,934 22,191 22,689 116,172 91,940 108,148<br />
2003<br />
through<br />
August<br />
26,208 10,483 23,588 6,866 6,180 45,540 38,709 43,263 21,635 19,255 19,688 100,250 74,627 92,718<br />
Sources: USDA Foreign Agriculture Service, U.S. Trade Internet System ; Harmonized Tariff Schedule of the United States ;<br />
Ch<strong>and</strong>an, Dairy Based Ingredients , 1997, Egan Press;<br />
Wisconsin Center for Dariy Research <strong>and</strong> the Wisconsin <strong>Milk</strong> Marketing Board, Dairy <strong>Protein</strong>s , 2002.<br />
1<br />
MPC=<strong>Milk</strong> protein concentrate<br />
2<br />
HTS=Harmonized Tariff Schedule of the United States<br />
3<br />
Casein glues are not included.<br />
4 Caseinates are classified under HTS 3501.90.50 prior to 1995.<br />
5 The protein content of Chapter 35 MPCs is possibly over estimated in this table. See the section of this paper entitled "Chapter 4 MPCs, Chapter 35 MPCs, <strong>and</strong><br />
Casein."<br />
10