A Review of Thirty-five Years of Osprey (Pandion haliaetus) Nesting ...
A Review of Thirty-five Years of Osprey (Pandion haliaetus) Nesting ...
A Review of Thirty-five Years of Osprey (Pandion haliaetus) Nesting ...

Create successful ePaper yourself
Turn your PDF publications into a flip-book with our unique Google optimized e-Paper software.
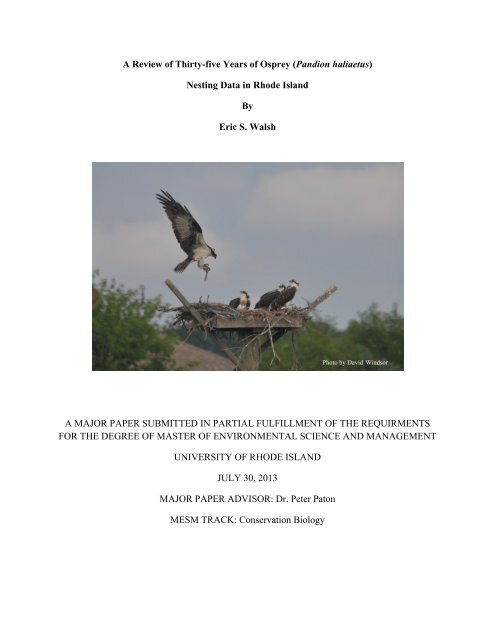
A <strong>Review</strong> <strong>of</strong> <strong>Thirty</strong>-<strong>five</strong> <strong>Years</strong> <strong>of</strong> <strong>Osprey</strong> (<strong>Pandion</strong> <strong>haliaetus</strong>)<br />
<strong>Nesting</strong> Data in Rhode Island<br />
By<br />
Eric S. Walsh<br />
Photo by David Windsor<br />
A MAJOR PAPER SUBMITTED IN PARTIAL FULFILLMENT OF THE REQUIRMENTS<br />
FOR THE DEGREE OF MASTER OF ENVIRONMENTAL SCIENCE AND MANAGEMENT<br />
UNIVERSITY OF RHODE ISLAND<br />
JULY 30, 2013<br />
MAJOR PAPER ADVISOR: Dr. Peter Paton<br />
MESM TRACK: Conservation Biology
Introduction<br />
The osprey (<strong>Pandion</strong> <strong>haliaetus</strong>) is one <strong>of</strong> North America’s most magnificent,<br />
recognizable, and unique birds <strong>of</strong> prey. They are a pandemic species, found on every continent<br />
except Antarctica and inhabit both inland and coastal regions in the breeding and non-breeding<br />
season. In North America, most ospreys are migratory breeding from Florida north through<br />
Newfoundland and west through Canada and southern Alaska and then south through the west<br />
coast and sections <strong>of</strong> Montana, Idaho, Wyoming, Colorado, Arizona, and Utah (Henny et al.<br />
2010). In New England, they breed along the south coast <strong>of</strong> Connecticut east to Massachusetts<br />
and north along the coast. They are also found along inland lakes and streams in Maine, New<br />
Hampshire, and Vermont. RI’s breeding population are present between April and August and<br />
are located predominantly along the south coast and throughout Narragansett Bay.<br />
They are taxonomically unique being in a monotypic genus <strong>Pandion</strong> and family<br />
<strong>Pandion</strong>idae. Their closest relatives are from the class Accipitiforms, which includes eagles and<br />
kites. They are piscivores foraging almost exclusively on a diet <strong>of</strong> fish (Poole 1989) in shallow<br />
tidal zones along the coast (Prevost 1979) and clear shallow freshwater bodies (Vana-Miller<br />
1987). They do not generally discriminate among fish species when foraging (Hughes 1983)<br />
except probably being more successful targeting slower benthic species (Flemming and Smith<br />
1990) than picsivorous species that are more weary (Vana-Miller 1987).<br />
Prior to the use <strong>of</strong> DDT ospreys were common up and down the eastern seaboard. In the<br />
1950’s-60’s, the osprey’s population began to decline because <strong>of</strong> the use <strong>of</strong> organochlorine<br />
pesticides (Ames 1966). DDT accumulates up the food chain, eventually reaching birds <strong>of</strong> prey<br />
causing thin eggshells resulting in breakage during incubation and ultimately nesting failure<br />
1
(Wiemeyer et al. 1975). In the 1940’s, breeding surveys estimated ~1000 nests between New<br />
York and Boston. By the end <strong>of</strong> the 60’s, nest sites declined by 98.5% to 150 active nests<br />
(Spitzer & Poole 1980). In 1972, the Federal Government banned DDT, and then in 1976, the<br />
osprey was listed as an Endangered Species by the U.S. Fish and Wildlife Service. Since then,<br />
the osprey began to recover and was up-graded to “Threatened” in 1982 and “Special Concern”<br />
in 1999. Today, the IUCN list the osprey as Least Concern. In the United States, ospreys have<br />
recovered to 16,000-19,000 breeding pairs in 2001, and they have been proposed as a sentinel<br />
species for contaminate investigations because they fit the criteria well (Henny et al. 2010).<br />
Many conservation recovery programs and citizen monitoring programs focus their<br />
attention on monitoring and managing osprey populations because <strong>of</strong> their previous sharp<br />
decline. In 1977, the Rhode Island Department <strong>of</strong> Environmental Management (RIDEM) began<br />
monitoring the state’s osprey population as it recovered from the effects <strong>of</strong> DDT. Staff biologists<br />
and volunteers observed all known nests in Rhode Island and recorded how many chicks fledged<br />
each year. In 2010, with cooperation from RIDEM, the Audubon Society <strong>of</strong> Rhode Island<br />
(ASRI) assumed management <strong>of</strong> this successful program. In 1977, there were 12 Active nest<br />
sites and 7 successful nests compared to 2012 with 126 Active nests, and 96 successful nests<br />
(unpublished ASRI data).<br />
<strong>Osprey</strong> population recovery has been associated with nest structure type and availability<br />
(Reese 1977, Henny and Kaiser 1996), habitat suitability (Toschik et al. 2006), contaminate<br />
concentrations (Henny et al. 1977, Toschik et al. 2006), food resource availability (Poole 1982,<br />
Eriksson 1986), proximity to conspecific nesters (Toschik et al. 2006), and human activity<br />
(Levenson and Koplin 1984). North Atlantic coastal populations have recovered at variable rates<br />
2
(Henny et al. 1977, Spitzer and Poole 1977) exhibiting variable reproductive rates over time and<br />
space (Henny et al. 2010).<br />
Historically, they nest on coniferous and deciduous tall dead trees (Berger & Mueller,<br />
1969) or live trees (MacCarter 1972), utility poles (Prevost 1977), cellular towers, and artificial<br />
nesting platforms (Newton 1980). Within heterogeneous landscapes, nest site locations have<br />
been found to change over time (Bai et al. 2009) and the effects <strong>of</strong> landscape context on nest<br />
success is varied (Swenson 1981, Lohmus 2001). They typically choose sites with an<br />
unobstructed view <strong>of</strong> the surrounding landscape (Van Daele & Van Daele 1982). Coastal<br />
populations usually nest close to foraging resources along shallow tidal wetlands. Inland<br />
populations will typically nest and subsequently travel 3-5 km (Vana-Miller 1987, Poole 1989)<br />
to forage at shallow water bodies and as much as 14 km if necessary (Hagan and Walters 1990).<br />
Artificial nesting structures <strong>of</strong>ten provide access to nesting habitat that would otherwise not be<br />
suitable for nesting (Newton 1980). These structures are usually placed in open saltwater<br />
marshes allowing for close proximity to forgaing ground with an open unobstructed view.<br />
The RI osprey breeding data has not been fully analyzed. In the past, only nest status<br />
metrics and reproductive rates have been reported. Little was known about the location <strong>of</strong> nest<br />
sites within the Rhode Island landscape and their change over time. Until recently, the structure<br />
types were unknown for Rhode Island’s breeding population. Subsequently the relationship<br />
between structure type and breeding success in Rhode Island had not been explored.<br />
The objective <strong>of</strong> this paper was to review the Rhode Island osprey nesting data between<br />
1977 and 2012 and describe the observed trends. The second objective was to identify areas <strong>of</strong><br />
3
esearch opportunity or additional analyses that will provide insight into the dynamics <strong>of</strong> a<br />
population that repopulated a landscape after a population bottleneck.<br />
Methods<br />
Database and Monitoring<br />
All analyses were conducted on a data set collected in the State <strong>of</strong> Rhode Island from<br />
1977 to 2012. Each year volunteers would monitor each known osprey nest site between April<br />
and July, documenting the status <strong>of</strong> the nest sites each month and the number <strong>of</strong> young observed.<br />
The Rhode Island Department <strong>of</strong> Environmental Management (DEM) originally implemented<br />
the nest-monitoring program until 2008. In 2009, the program was transferred to the Audubon<br />
Society <strong>of</strong> Rhode Island (ASRI), which implemented data collection in 2010. Subsequently,<br />
there are no data for nesting season 2009.<br />
The data for each year consisted <strong>of</strong> the status <strong>of</strong> each nest and the number <strong>of</strong> fledglings<br />
produced for each successful nest. Each year every nest was categorized as one <strong>of</strong> the following:<br />
Inactive, Subadult/Housekeeping (starting in 2010 nest sites that showed signs <strong>of</strong> osprey activity<br />
but not nesting behavior such as incubation posture, were labeled as Housekeeping instead <strong>of</strong><br />
Subadult to align with the prevailing evidence that not all nest sites with non-incubating pairs are<br />
necessarily Subadults), Active, and Successful. Active sites were nests that showed signs <strong>of</strong><br />
nesting or young rearing, but failed to produce fledglings. Nest sites were identified based on<br />
passive discovery <strong>of</strong> active sites. Potential nest sites were monitored after a report was made <strong>of</strong><br />
the possibility <strong>of</strong> an active nesting pair. There was no active effort to identify nest sites around<br />
the state.<br />
4
The original data I used were in three forms. The first was a spreadsheet with nest names<br />
and nesting history for nest sites between 1977 and 2008. The second was a summary <strong>of</strong> each<br />
year’s nest status between 1977-2012, which included the number <strong>of</strong> Inactive, Subadult, Active,<br />
Successful nest sites, and Fledglings with calculations for the number <strong>of</strong> fledglings per Active<br />
and Successful nest site. The third form was a GIS database that contained the spatial location <strong>of</strong><br />
most nest sites and the status <strong>of</strong> each site for each monitored year. The nesting history data in the<br />
GIS originated from the spreadsheet data. However, the first database did not correspond<br />
perfectly to the GIS records because not every nest site was in the GIS. The reason was<br />
unknown; therefore, the analyses were conducted on the GIS data and the results do not perfectly<br />
correspond to the original summary data published by the DEM and ASRI.<br />
Data QA<br />
In an effort to improve the spatial information <strong>of</strong> each monitored nest site, the Audubon<br />
Society <strong>of</strong> Rhode Island hired three interns for the 2012 nesting season to record the spatial<br />
location and structure type <strong>of</strong> every monitored site in 2012 (N=200). All nest sites being<br />
monitored in 2012 were visited, as a result, there were nests (N=64) used in these analyses,<br />
which spatial and platform type were not explicitly confirmed.<br />
To improve the accuracy <strong>of</strong> the data, I investigated the discrepancies for each year where<br />
the GIS summary did not align with the summary data. For several <strong>of</strong> the monitored years, there<br />
were DEM published osprey newsletters that contained individual nest data. When possible, I<br />
cross-referenced the published and spreadsheet data with the GIS data. However, it was not<br />
possible to assess every nest because in several instances, nest names were not consistent<br />
5
through the years, and there was no available information to trace nest name changes. I used the<br />
newsletters first and then the spreadsheet when correcting the GIS data.<br />
Data Analysis<br />
I summarized the data to provide insight into nesting trends between 1977 and 2012. I<br />
analyzed the average distance between nest sites using a Hawth’s Tools Euclidean distance<br />
calculation in ArcGis 9.3. I analyzed the difference between structure type and fledgling<br />
production using an ANOVA with significance <strong>of</strong> α
monitored years (1977-2012) into four cohorts and associated each cohort to an imagery year<br />
(Table 1). I used ArcGIS 9.3 to process the imagery and produce the buffer zone rasters.<br />
The buffer zone and entire state LULC imagery were analyzed using Fragstats 4.1<br />
(McGarigal 2012). I analyzed the entire state’s land cover to compare the distribution <strong>of</strong> cover<br />
types within the buffer zone to cover types over the entire state. I report percent land cover <strong>of</strong> the<br />
selected cover types.<br />
Results<br />
The <strong>Osprey</strong> population has increased 10.27 fold from 11 Active nest sites in 1977 to 124<br />
Active sites in 2012, <strong>of</strong> the 124 Active sites in 2012, 94 were successful (Figure 1). The number<br />
<strong>of</strong> fledglings produced each year has increased from 10 in 1977 to 164 in 2012 (Figure 2). The<br />
success rate or average number <strong>of</strong> fledglings per successful nest has ranged from 2.7-1.5 with an<br />
average <strong>of</strong> 1.9(SD=+/- 0.2) fledglings per year (Figure 3). There was no detectable change in the<br />
overall percent change in the number <strong>of</strong> fledglings produced from year to year (average=11.6%<br />
SD=+/-28.4%). The reproductive rate has ranged from 0.9 to 1.8 and has averaged 1.4 (+/-0.3)<br />
(Figure 4). The reproductive rate is based on the number <strong>of</strong> fledglings per active nest; it is lower<br />
than the success rate and is a measure <strong>of</strong> the health <strong>of</strong> a population.<br />
The ospreys have built their nests on a variety <strong>of</strong> structures. There are eight primary<br />
structure types; these include platform, telephone, cell, tree, other, channel. A platform is any<br />
manmade structure specifically erected with the intent to support an osprey nesting pair. Usually,<br />
these platforms are approximately 10’-14’ tall (this category also includes telephone poles that<br />
are intentionally erected as osprey nest platforms) and located in marsh habitat or in close<br />
7
proximity to foraging habitat. The telephone category represents manmade structures that are not<br />
intentionally erected for osprey breeding, but are subsequently used as a nest site. This category<br />
includes high-tension electric poles and telephone poles. Nest sites built on light poles are in the<br />
structure category Light. The light category is for any structure that has a light or set <strong>of</strong> lights at<br />
the top, such as athletic field lights. The cell category is for nests built on cell phone towers and<br />
the channel category is for the few nest sites built on channel markers. The tree sites are in the<br />
tree category, and finally the other category is for all sites that do not fit into any <strong>of</strong> the other<br />
categories. For example, a nest built on a water tower would be classified as other.<br />
Between 1977 and 2012 <strong>of</strong> the known structure types, 37% <strong>of</strong> the nest sites were built on<br />
platforms, 20% on telephone poles, 11% on light poles, 8% on cell phone towers, and 6% on<br />
trees. Between 1977 and 1989, the predominate structure type was telephone poles, but after<br />
1987, platform structures increased in use from 7 - 54 structures, an 87% increase (Figure 5).<br />
Cell towers were the second greatest used structure in 2012 with 24, which was the last known<br />
year <strong>of</strong> a steady increase in Cell tower use that began 2008 with 10 towers.<br />
Platforms produced an average <strong>of</strong> 1.43 fledglings while cell towers produced 1.64 per<br />
year, the greatest average number <strong>of</strong> fledglings. Telephone poles produced an average <strong>of</strong> 1.35<br />
fledglings per year and trees 1.53 (Figure 6). There was a significant difference between yearly<br />
fledgling production F(34,1308), p=
significant difference between structure success rates F(6,194)=3.76, p=0.001. A Post Hoc<br />
Tukey test showed that the differences were between platforms and cell towers (p adj =0.02), and<br />
unknown and cell towers (p adj
increased from 10% to 29% in 1977 to 2012 respectively. During this same period, overall urban<br />
land cover increased from 13% to 22%. Another land cover shift is open water. Open water<br />
comprised 5.9% <strong>of</strong> the total area within 3 km <strong>of</strong> the nest sites, while 4.3% <strong>of</strong> the total landscape.<br />
The amount <strong>of</strong> open water within the buffer zones decreased to 4.3% in 2012 and the total<br />
landscape had 4.2% open water. There was an overall decrease in the percent cover <strong>of</strong> deciduous<br />
wetlands, mixed forest, herbaceous wetlands, and open water and overall increase in urban land<br />
cover that exceeded expected changes given the proportion <strong>of</strong> each in the entire landscape (Table<br />
2). Overall nest sites were located within landscapes with more deciduous wetlands, herbaceous<br />
wetlands, and urban land cover and less coniferous forest, mixed forest, and deciduous forest<br />
then would be expected given the overall landscape distribution (Table 3).<br />
Discussion<br />
The Rhode Island osprey population is recovering from the observed decline in the<br />
1950’s and 60’s caused by organochlorine pesticides. The recovery has shown yearly<br />
fluctuations in Active and Successful nests with the two being closely synchronous within most<br />
years. The exception was between 1988 and 1994 when the number <strong>of</strong> Active nests increased<br />
from 23 to 43, a 47% increase but Successful nests increased from 19 to 26 a 27% increase. The<br />
influx <strong>of</strong> breeding ospreys grew faster than the production <strong>of</strong> young. In addition, between 1988<br />
and 1994, the average number <strong>of</strong> fledglings produced per successful nest decreased from 2.2 in<br />
1988 to 1.7 in 1994. Interestingly, 2.2 was the highest the fledgling/successful nest rate has been<br />
to date. If fledglings per successful nest rate did not decrease over the same period, then the<br />
cause <strong>of</strong> a pair not producing at least one fledgling would be independent <strong>of</strong> the entire<br />
10
population’s ability to produce young. Since the evidence shows the entire population declined in<br />
fledgling production, it leads to the possibility that there were environmental or density<br />
dependent deterministic events driving the decline. A possible reason for this pattern was the<br />
inability <strong>of</strong> the fish stock to support the foraging needs <strong>of</strong> the breeding population (Van Daele &<br />
Van Daele 1982). At this time, I did not have fish stock data to test this theory. Another<br />
possibility is the increase or influx <strong>of</strong> young naïve nesting pairs with little experience.<br />
The pattern <strong>of</strong> slow successful nest growth in comparison to active nest growth would<br />
eventually produce a depression or decline in active nest sites when the young nesting cohorts<br />
from the depressed successful years reached breeding age. <strong>Osprey</strong>s reach sexual maturity at age<br />
three to four (Poole 1989), so the 1988 cohort <strong>of</strong> young would have been at breeding age in<br />
1991. The Active nest numbers did not decline in 1991, to the contrary they continued to<br />
increase for three more years. This is a possible indication that the Active nest numbers were<br />
increasing do to an influx <strong>of</strong> naïve nesters from outside <strong>of</strong> the Rhode Island breeding population.<br />
Further supporting the naïve nester theory was the fledgling per successful nest rate. New nesting<br />
pairs are not as successful as mature nesting pairs (Poole 1989). Since the 1988 to 1994 rate<br />
decreased from 2.2 to 1.7 (Figure 3), then the slow growth in Successful nests may have been a<br />
function <strong>of</strong> a young population and not a depressed fish stock.<br />
The synchronous pattern between Active and Successful nests should be looked at with<br />
caution though. Active sites are a measure <strong>of</strong> previous years’ success rate as an Active nest is an<br />
indication <strong>of</strong> the start <strong>of</strong> nesting. Success is a representation <strong>of</strong> within year factors affecting<br />
nesting. A depressed success rate is an indication <strong>of</strong> environmental factors affecting within year<br />
fledgling production leading to an effect on active nest rates in the future. Between 2000 and<br />
2002, the number <strong>of</strong> active nests increased from 56 to 87. In 1997, the number <strong>of</strong> successful<br />
11
nests was 37 and in 1999, the number <strong>of</strong> successful nests increased to 54. The young from 1997<br />
would correspond to the breeding cohort <strong>of</strong> 2000 and 1999 would correspond to 2002. Hence, an<br />
increase in successful nests produces an increase in breeding adults three years later (Figure 1).<br />
The reproductive rate or average fledgling per Active nest site fluctuated over 35 years<br />
between the highest at 1.8 in 1983, 1988, and 2000 to its lowest point in 1977 and 1981 at 0.9.<br />
The rate was always above the critical replacement rate <strong>of</strong> 0.8 (Spitzer and Poole 1980) and in<br />
comparison to populations in the Chesapeake Bay area and west in Idaho, Rhode Island’s was<br />
more robust (Van Daele & Van Daele 1982, Watts and Paxton 2007). However, populations in<br />
Europe have shown reproductive rates as high as 2.04 (Saurola 2005). There appears to be no<br />
pattern in relation to the successful nest rate. The reproductive rate is an indication <strong>of</strong> the<br />
population’s ability to produce young within an area. This number is affected by environmental<br />
stochastity, deterministic events, and breeder’s maturity. The breeding population on average has<br />
not increased its fledgling production from year to year; the percent change in fledgling<br />
production has varied above and below zero (Figure 14). The increase in fledglings observed in<br />
Figure 2 is a function <strong>of</strong> the increase in population size and not the environments ability to<br />
support an increase in the production <strong>of</strong> young.<br />
Structure<br />
<strong>Osprey</strong>s in Rhode Island preferred to nest on platforms almost twice as <strong>of</strong>ten as any other<br />
structure (Figure 15). Platforms also supported the greatest number <strong>of</strong> successful nest sites<br />
(Figure 16). Platforms historically are located in and along coastal wetlands (Figure 17). In<br />
Rhode Island, this would be the prime habitat for nesting, providing the ospreys with access to<br />
extensive areas <strong>of</strong> shallow water. Among all structure types, platform use showed the greatest<br />
12
increase and at the greatest rate (Figure 5). Between 2002 and 2012, platform use increased at a<br />
rate <strong>of</strong> 2.3 per year, the next closest was cell towers and telephone poles at 0.6 per year. There<br />
was a statistically significant difference between the average number <strong>of</strong> successful platform and<br />
cell tower nest sites. On average, cell towers produced more successful nests than platforms, but<br />
this may be shifting. The percentage <strong>of</strong> successful nests on cell structures appears to be<br />
decreasing while the percentage <strong>of</strong> successful platform and telephone nests are increasing<br />
(Figure 7, 8, 9). However, the observed cell tower pattern may be a function <strong>of</strong> small sample<br />
size, between 1984 and 1997only one tower was active and successful. Compared to 2012, 23<br />
cell towers were active. Across all structures, there was no difference in fledgling production.<br />
This is different from other osprey populations that produced more <strong>of</strong>fspring on artificial<br />
structures (Van Daele & Van Daele 1982). The lack <strong>of</strong> difference is an indication that the<br />
structure and any correlations with structure types, i.e. location (since each structure type would<br />
be within a specific landscape type) has no significant affect on reproductive rates. Open coastal<br />
waters accounted for 22% <strong>of</strong> the area within 3 km <strong>of</strong> nest sites and this value was relatively<br />
consistent through the years (Figure 18). One theory is the close proximity to and vast expanse <strong>of</strong><br />
available foraging habitat negates any difference in fledgling production that might occur<br />
because <strong>of</strong> differences in structure type. These analyses did not quantify the average land cover<br />
type surrounding a structure type, but anecdotally, platforms are typically erected in open salt<br />
marshes, telephone poles are typically in utility right-<strong>of</strong>-ways, cell towers and light poles are<br />
usually in urban landscapes. Structures are therefore in a diversity <strong>of</strong> landscapes and still equally<br />
successful at producing young.<br />
13
Landscape Context<br />
Nest sites were located in landscapes dominated by Urban, Deciduous and Herbaceous<br />
Wetlands, and Coastal Waters. The landscape context <strong>of</strong> nesting sites changed over time. As the<br />
population increased, more nest sites were located in urban landscapes in greater proportion than<br />
the entire landscape (Table 3). The RI osprey population appears to not only do well in human<br />
dominated landscapes, but also seek nest locations within urban landscapes. Other studies have<br />
found that ospreys are not as successful within human influenced landscapes (Swenson 1979,<br />
Van Daele & Van Daele 1982). Bai et al. (2009) found that an osprey population in Germany<br />
shifted their use <strong>of</strong> land cover from forested areas to agricultural. The RI population did shift<br />
away from forested landscapes but to urban landscapes (Table 2). The RI population probably<br />
did not make the shift to agriculture, because agriculture comprises a small percentage <strong>of</strong> the<br />
total landscape (5.3%). However, Bai et al. suggested that the shift they observed was due to the<br />
eutrophication <strong>of</strong> water bodies surrounding agriculture landscapes, which increase water body<br />
productivity. Urban landscapes can have a similar effect through nutrient run<strong>of</strong>f, a possible<br />
explanation <strong>of</strong> ospreys nesting in the RI urban landscape. Another explanation is the pattern <strong>of</strong><br />
human development intersects osprey site selection patterns. <strong>Osprey</strong>s in Rhode Island nest along<br />
coastal areas, and humans tend to settle intensely along coastal regions. The observed pattern<br />
could be a byproduct <strong>of</strong> human development trends.<br />
The distance between nest sites also changed over time. There was a decrease in the<br />
average distance between active nest sites. The decrease was not linear though. Overall, there<br />
was an approximate decline <strong>of</strong> 5000 meters between nest sites. The decline occurred gradually in<br />
some years and then sharply in others. There were three sharp declines, the first was between<br />
1977 and 1981, then again between 1989 and 1992, and the last appears recently between 2007<br />
14
and 2012. The sharp declines appear to correspond with an increase in active nest sites. It<br />
appears that as the population increases, ospreys are nesting near conspecifics when possible and<br />
then expanding their range into new territory. Hence, the increases in nesting distance after the<br />
sharp declines in distance. <strong>Osprey</strong>s gain protection from predators by nesting in colonies (Hagan<br />
and Walters 1990) but there may be other benefits and costs <strong>of</strong> colonial nesting. Bretagnolle et<br />
al. (2008) found a similar pattern in nest distance among colonizing ospreys in a western<br />
Mediterranean population. They found periods <strong>of</strong> decline, followed by periods <strong>of</strong> stability where<br />
provisioning rate and prey size increased as the density <strong>of</strong> ospreys increased, however<br />
productivity decreased. The RI population exhibited the same pattern <strong>of</strong> decline in reproductive<br />
success while the distance between nest sites decreased. The reproductive rate declined from 1.8<br />
to 1.0 between 1988 and 1993, encompassing the same period when nesting distance declined<br />
sharply, e.g. increase in nest density (Figure 4). One area <strong>of</strong> future research is analyzing clusters<br />
<strong>of</strong> nest sites and how they change over time and how reproductive metrics are influenced.<br />
Conclusion<br />
The RI osprey population is increasing and there is no indication at this time that the<br />
population is stabilizing. The growth is occurring with the support <strong>of</strong> artificial platforms. Based<br />
on the pattern <strong>of</strong> colonization and reproductive rate, platform location should be within 2 km <strong>of</strong><br />
other nest sites, but an effort to locate platforms in areas without existing nest structures should<br />
be made. This would ease the density dependent effects observed in osprey populations. In<br />
addition, based on observed patterns, nest sites should be located in areas with deciduous and<br />
15
herbaceous wetlands within 3 km, and urban landscapes do not appear to negatively affect<br />
ospreys, so selecting locations within an urban landscape may benefit ospreys in RI.<br />
Future research should focus on understanding the dynamics between fish stocks and<br />
yearly production. In addition, contaminant exposure can affect population growth, so an<br />
assessment <strong>of</strong> potential contaminates that are affecting the RI population is recommended.<br />
Because the Rhode Island population bottlenecked and is repopulating near urban land cover, an<br />
in-depth review <strong>of</strong> the effects <strong>of</strong> landscape on site selection, population distribution, nesting<br />
behavior, and success should be a focus <strong>of</strong> future research.<br />
16
Literature Cited<br />
Ames, P. (1966). DDT Residues in the Eggs <strong>of</strong> the <strong>Osprey</strong> in the North-Eastern United States<br />
and Their Relation to <strong>Nesting</strong> Success. Journal <strong>of</strong> Applied Ecology , 3, 87-97.<br />
Bai, M.L., D. Schmidt, E. Gottschalk, and M. Muhlengerg. (2009) Distribution pattern <strong>of</strong> an<br />
expanding <strong>Osprey</strong> (<strong>Pandion</strong> haliatus) population in a changing environment. Journal <strong>of</strong><br />
Ornithology, 150: 255-263<br />
Berger, D. and A. H. Mueller. (1969) <strong>Osprey</strong>s in Northern Wisconsin. in J.J. Hickey, ed.<br />
Peregrine falcon populations: their biology and decline. , 340-341.<br />
Bretanolla, V., F. Mougeot, and J.-C. Thibault. (2008) Density dependence in a recovering<br />
osprey population: demographic and behavioural processes. Journal <strong>of</strong> Animal Ecology.<br />
77: 998-1007<br />
Eriksson, M. O. G. (1986) Fish delivery, production <strong>of</strong> young, and nest density <strong>of</strong> <strong>Osprey</strong><br />
(<strong>Pandion</strong> <strong>haliaetus</strong>) in southwest Sweden. Canadian Journal <strong>of</strong> Zoology. 64: 1961-19<br />
Flemming, S.P. & Smith, P.C.C. (1990). Environmental influences on <strong>Osprey</strong> foraging in<br />
Northeastern Nova Scotia. Journal <strong>of</strong> Raptor Research. 24 (3): 64–67.<br />
Hagan, J.M. III and J.R. Walters. (1990) Foraging behavior, reproductive success, and colonial<br />
nesting in ospreys. Auk, 107: 506-521<br />
Henny, C. J. and J. L. Kaiser. (1996) <strong>Osprey</strong> Population Increase Along the Willamette River,<br />
Oregon, and the Role <strong>of</strong> Utility Structures, 1976–1993’, in D. M. Bird, D. E. Varland and<br />
J. J. Negro(eds), Raptors in Human Landscapes, Academic Press, Ltd., London, pp. 97–<br />
108<br />
17
Henny, C.J., M.A. Byrd, J.A. Jacobs, P.D. Mclain, M.R. Todd, and B.F. Halla. (1977) Mid-<br />
Atlantic coast <strong>Osprey</strong> populations: present numbers, productivity, pollutant<br />
contamination, and status. Journal <strong>of</strong> Wildlife Management. 41: 254-265<br />
Henny, C.J., R.A. Grove, J. L. Kaiser, and B.L. Johnson. (2010) North American <strong>Osprey</strong><br />
Populations and Contaminants: Historic and Contemporary Perspectives. Journal <strong>of</strong><br />
Toxicology and Environmental Health, Part B. 13: 579-603<br />
Hughes, J. (1983) On <strong>Osprey</strong> habitat and productivity: a tale <strong>of</strong> two habitats. In Bird, D.M., ed.<br />
Biology and Management <strong>of</strong> Bald Eagles and <strong>Osprey</strong>s. Harpell Press, Ste. Anne De<br />
Bellevue, Quebec. pp 269-273<br />
Levenson, H. and A. J. Koplin. (1984) Effects <strong>of</strong> human sctivity on productivity <strong>of</strong> nesting<br />
ospreys. The Journal <strong>of</strong> Wildlife Management 48 (4), 1374-1377.<br />
Lohmus, A. (2001) Habitat selection in a recovering <strong>Osprey</strong> <strong>Pandion</strong> <strong>haliaetus</strong> population. Ibis<br />
143: 652-657<br />
MacCarter, D. (1972). Reproductive performance and population trends <strong>of</strong> osprey at Flathead<br />
Lake, Montana. M.S. Thesis , 80.<br />
McGarigal, K., SA Cushman, and E Ene. (2012). FRAGSTATS v4: Spatial Pattern Analysis<br />
Program for Categorical and Continuous Maps. Computer s<strong>of</strong>tware program produced by<br />
the authors at the University <strong>of</strong> Massachusetts, Amherst. Available at the following web<br />
site: http://www.umass.edu/landeco/research/fragstats/fragstats.html<br />
Newton, I. (1980). The role <strong>of</strong> food in limiting bird numbers. Ardea 68 (1), 11-30.<br />
18
Poole, A.F. (1982) Brood reduction in temperate and sub-tropical <strong>Osprey</strong>s. Oecologia 53: 111-<br />
119<br />
Poole, A.F. (1989) A Natural and unnatural history. Cambridge University Press, NY.<br />
Prevost, Y. (1977) Feeding ecology <strong>of</strong> osprey in Antigonish County, Nova Scotia. M.S. Thesis ,<br />
111.<br />
Reese, J. G. (1969) A Maryland <strong>Osprey</strong> population 75 years ago and today. Maryland Birdlife<br />
25:116-119<br />
Saurola, P. (2005) Monitoring and conservation <strong>of</strong> Finnish ospreys <strong>Pandion</strong> <strong>haliaetus</strong> in 1971-<br />
2005. Status <strong>of</strong> Raptor Populations in Eastern Fennoscandia. Proceedings <strong>of</strong> the<br />
workshop, Kostomuksha, Karelia, Russia, November 8-10, 2005.<br />
Spitzer, P. and A.F. Poole. (1980) Coastal <strong>Osprey</strong>s between New York City and Boston.<br />
American Birds , 34 (3), 234-241.<br />
Swenson, J. E. (1979) Factors affecting status and reproduction <strong>of</strong> ospreys in Yellowstone<br />
National Park. Journal <strong>of</strong> Wildlife Management. 43:595-601.<br />
Swenson, J. E. (1981) <strong>Osprey</strong> nest site characteristics in Yellowstone National Park. Journal <strong>of</strong><br />
Field Ornithology, 52(1): 67–69.<br />
Toschik, P. C., M. C. Christman, B. A. Rattner, and M. A. Ottinger. (2006) Evaluation <strong>of</strong><br />
<strong>Osprey</strong> Habitat Suitability and Interaction with Contaminant Exposure. Journal <strong>of</strong><br />
Wildlife Management. 70 (4): 977-988<br />
19
Van Daele, L., & Daele, a. H. (1982) Factos affecting the productivity <strong>of</strong> ospreys nesting in<br />
west-central Idaho. Condor. 84 (1): 292-299.<br />
Vana-Miller, S. (1987) Habitat Suitability Index Models. Biological Reports 82 (10.154): 46.<br />
Watts, B.D. and B.J. Paxton. (2007) <strong>Osprey</strong>s <strong>of</strong> the Chesapeake Bay: population recovery,<br />
ecological requirements, and current threats. Waterbirds. 30: 39-49<br />
Wiemeyer, S. N., Spitzer, P. R., Krantz, W. C., & Cromartie, T. G. (1975). Effects <strong>of</strong><br />
Environmental Pollutants on Connecticut and Maryland <strong>Osprey</strong>s. The Journal <strong>of</strong> Wildlife<br />
Management , 39 (1), 124-139.<br />
20
Appendix A<br />
140<br />
Total Number <strong>of</strong> Active and Sucessful Nest<br />
Sites<br />
# <strong>of</strong> Nests<br />
120<br />
100<br />
80<br />
60<br />
40<br />
20<br />
0<br />
Active<br />
Successful<br />
Figure 1. The total recorded number <strong>of</strong> Active and Successful osprey nest sites in Rhode Island between 1977 and 2012.<br />
Number <strong>of</strong> Fledglings<br />
Total Number <strong>of</strong> <strong>Osprey</strong> Fledglings<br />
200<br />
180<br />
160<br />
140<br />
120<br />
100<br />
80<br />
60<br />
40<br />
20<br />
0<br />
1977 1979 1981 1983 1985 1987 1989 1991 1993 1995 1997 1999 2001 2003 2005 2007 2010 2012<br />
Figure 2. The total number <strong>of</strong> observed osprey fledglings in Rhode Island between 1977 and 2012.<br />
21
3.0<br />
Average Number <strong>of</strong> Fledglings per Successful<br />
Nest Site<br />
Number <strong>of</strong> Fledglings<br />
2.5<br />
2.0<br />
1.5<br />
1.0<br />
0.5<br />
0.0<br />
1977<br />
1978<br />
1979<br />
1980<br />
1981<br />
1982<br />
1983<br />
1984<br />
1985<br />
1986<br />
1987<br />
1988<br />
1989<br />
1990<br />
1991<br />
1992<br />
1993<br />
1994<br />
1995<br />
1996<br />
1997<br />
1998<br />
1999<br />
2000<br />
2001<br />
2002<br />
2003<br />
2004<br />
2005<br />
2006<br />
2007<br />
2008<br />
2010<br />
2011<br />
2012<br />
Figure 3. The average number <strong>of</strong> osprey fledglings per successful nest in Rhode Island between 1977 and 2012.<br />
2.0<br />
Average Number <strong>of</strong> Fledgelings per Active<br />
Nest<br />
Number <strong>of</strong> Fledglings<br />
1.5<br />
1.0<br />
0.5<br />
0.0<br />
1977<br />
1978<br />
1979<br />
1980<br />
1981<br />
1982<br />
1983<br />
1984<br />
1985<br />
1986<br />
1987<br />
1988<br />
1989<br />
1990<br />
1991<br />
1992<br />
1993<br />
1994<br />
1995<br />
1996<br />
1997<br />
1998<br />
1999<br />
2000<br />
2001<br />
2002<br />
2003<br />
2004<br />
2005<br />
2006<br />
2007<br />
2008<br />
2010<br />
2011<br />
2012<br />
Figure 4. The average number <strong>of</strong> osprey fledglings per Active nest, also known as the reproductive rate with the<br />
replacement rate <strong>of</strong> 0.08 (Blue Line).<br />
22
60<br />
Number <strong>of</strong> Active Nests per Year<br />
50<br />
Number <strong>of</strong> Ative Nests<br />
40<br />
30<br />
20<br />
10<br />
cell<br />
light<br />
platform<br />
telephone<br />
tree<br />
0<br />
Figure 5. The number <strong>of</strong> Active osprey nests in Rhode Island per year per structure type between 1977 and 2012.<br />
2.50<br />
Average Number <strong>of</strong> Fledglings per Structure<br />
Type<br />
2.00<br />
Number <strong>of</strong> Fledglings<br />
1.50<br />
1.00<br />
0.50<br />
0.00<br />
cell channel light other platform telephone tree unknown<br />
Figure 6. The average number <strong>of</strong> osprey fledglings per structure type in Rhode Island between 1977 and 2012.<br />
23
1.4<br />
Average Percent Successful Nests per Structure<br />
Type<br />
1.2<br />
1<br />
Percent<br />
0.8<br />
0.6<br />
0.4<br />
0.2<br />
0<br />
cell light other platform telephone tree unknown<br />
Figure 7. The average percent Successful osprey nest site per structure type in Rhode Island between 1977 and 2012.<br />
1.2<br />
Percent Successful Cell Tower Nest Sites <strong>of</strong> the<br />
Active Sites<br />
1<br />
0.8<br />
0.6<br />
0.4<br />
0.2<br />
0<br />
Figure 8. The percent Successful osprey nest sites <strong>of</strong> the Active Cell tower structured nest sites in Rhode Island between<br />
1977 and 2012.<br />
24
1.2<br />
Percent Successful Platform Nest Sites <strong>of</strong> the<br />
Active Sites<br />
Percent<br />
1<br />
0.8<br />
0.6<br />
0.4<br />
0.2<br />
0<br />
1977<br />
1978<br />
1979<br />
1980<br />
1981<br />
1982<br />
1983<br />
1984<br />
1985<br />
1986<br />
1987<br />
1988<br />
1989<br />
1990<br />
1991<br />
1992<br />
1993<br />
1994<br />
1995<br />
1996<br />
1997<br />
1998<br />
1999<br />
2000<br />
2001<br />
2002<br />
2003<br />
2004<br />
2005<br />
2006<br />
2007<br />
2008<br />
2010<br />
2011<br />
2012<br />
Figure 9. The percent Successful osprey nest sites <strong>of</strong> the Active Platform structured nest sites in Rhode Island between<br />
1977 and 2012.<br />
1.2<br />
Percent Successful Telephone Nest Sites <strong>of</strong> the<br />
Active Sites<br />
Percent<br />
1<br />
0.8<br />
0.6<br />
0.4<br />
0.2<br />
0<br />
1977<br />
1978<br />
1979<br />
1980<br />
1981<br />
1982<br />
1983<br />
1984<br />
1985<br />
1986<br />
1987<br />
1988<br />
1989<br />
1990<br />
1991<br />
1992<br />
1993<br />
1994<br />
1995<br />
1996<br />
1997<br />
1998<br />
1999<br />
2000<br />
2001<br />
2002<br />
2003<br />
2004<br />
2005<br />
2006<br />
2007<br />
2008<br />
2010<br />
2011<br />
2012<br />
Figure 10. The percent Successful osprey nest sites <strong>of</strong> the Active Telephone structured nest sites in Rhode Island between<br />
1977 and 2012.<br />
25
8000<br />
Average Distance Between Nest Sites<br />
7000<br />
6000<br />
Distance (m)<br />
5000<br />
4000<br />
3000<br />
2000<br />
1000<br />
0<br />
Figure 11. The average distance between osprey nest sites in Rhode Island between 1977 and 2012.<br />
60.0%<br />
50.0%<br />
40.0%<br />
30.0%<br />
20.0%<br />
10.0%<br />
0.0%<br />
Distribution <strong>of</strong> Land Cover within Rhode<br />
Island<br />
1972<br />
1985<br />
1999<br />
2010<br />
Figure 12. The overall distribution <strong>of</strong> land cover types in Rhode Island in 1972, 1985, 1999, and 2010.<br />
26
50.0%<br />
45.0%<br />
40.0%<br />
35.0%<br />
30.0%<br />
25.0%<br />
20.0%<br />
15.0%<br />
10.0%<br />
5.0%<br />
0.0%<br />
Distribution <strong>of</strong> Land Cover within 3 km <strong>of</strong><br />
<strong>Osprey</strong> Nest Sites<br />
1972<br />
1985<br />
1999<br />
2010<br />
Figure 13. The distribution <strong>of</strong> land cover types within 3km <strong>of</strong> osprey nest sites in Rhode Island in 1972, 1985, 1999, and<br />
2010.<br />
140.0<br />
120.0<br />
100.0<br />
80.0<br />
60.0<br />
40.0<br />
20.0<br />
0.0<br />
-20.0<br />
-40.0<br />
Percent Change <strong>of</strong> Fledglings from Previous<br />
Year<br />
1977<br />
1978<br />
1979<br />
1980<br />
1981<br />
1982<br />
1983<br />
1984<br />
1985<br />
1986<br />
1987<br />
1988<br />
1989<br />
1990<br />
1991<br />
1992<br />
1993<br />
1994<br />
1995<br />
1996<br />
1997<br />
1998<br />
1999<br />
2000<br />
2001<br />
2002<br />
2003<br />
2004<br />
2005<br />
2006<br />
2007<br />
2008<br />
2010<br />
2011<br />
2012<br />
Figure 14. The percent change <strong>of</strong> osprey fledglings in Rhode Island from the previous year's total production between<br />
1977 and 2012.<br />
27
700<br />
Total Number <strong>of</strong> Active Nest Sites per<br />
Structure Type<br />
664<br />
Number <strong>of</strong> Active Nest Sites<br />
600<br />
500<br />
400<br />
300<br />
200<br />
100<br />
0<br />
360<br />
308<br />
206<br />
103<br />
141<br />
2 11<br />
channel other tree cell light unknown telephone platform<br />
Figure 15. The total number <strong>of</strong> Active osprey nest sites in Rhode Island per structure type between 1977 and 2012.<br />
Number <strong>of</strong> Successful Nest Sites<br />
600<br />
500<br />
400<br />
300<br />
200<br />
100<br />
0<br />
Total Number <strong>of</strong> Successful Nest Sites per<br />
Structure Type<br />
0 9<br />
78<br />
116<br />
channel other tree cell light unknown telephone platform<br />
170<br />
218<br />
279<br />
520<br />
Figure 16. The total number <strong>of</strong> Successful osprey nest sites in Rhode Island per structure type between 1977 and 2012.<br />
28
Figure 17. The distribution <strong>of</strong> all nest sites in Rhode Island as <strong>of</strong> 2012.<br />
29
Percent Area<br />
35.0<br />
30.0<br />
25.0<br />
20.0<br />
15.0<br />
10.0<br />
5.0<br />
0.0<br />
Percent Area <strong>of</strong> Land Cover within 3km <strong>of</strong><br />
Nest Sites Fixed for Open Coastal Water<br />
1972<br />
1985<br />
1999<br />
2010<br />
Figure 18. The percent <strong>of</strong> land cover within 3 km <strong>of</strong> osprey nest sites in RI adjusted for the amount <strong>of</strong> coastal water.<br />
Imagery/Model Year Cohort <strong>of</strong> <strong>Years</strong> Number <strong>of</strong> <strong>Years</strong> Number <strong>of</strong> Nests<br />
1972 1977-1981 4 19<br />
1985 1982-1992 11 56<br />
1999 1993-2003 11 119<br />
2010 2004-2010 6 205<br />
Table 1. The imagery years used in the land cover analyses and the associated nesting years.<br />
30
RI Land Cover<br />
Change<br />
Buffer Land<br />
Cover Change Difference<br />
Agriculture 5.2% 5.9% 0.8%<br />
Coniferous Forest 2.8% 3.1% 0.2%<br />
Coniferous Wetland -0.3% -0.7% -0.5%<br />
Deciduous Forest -27.6% -27.6% 0.0%<br />
Deciduous Wetland 1.0% -4.8% -5.8%<br />
Herbaceous<br />
Wetland -1.3% -2.6% -1.3%<br />
Mixed Forest 9.9% 6.5% -3.4%<br />
Urban 8.5% 18.7% 10.2%<br />
Open Water 0.0% -1.5% -1.5%<br />
Table 2. The percent change <strong>of</strong> each <strong>of</strong> the 12 categories <strong>of</strong> land cover for the entire state <strong>of</strong> Rhode Island and the 3<br />
km buffer zones surrounding each nest site between 2010 and 1972. The far right column indicates the difference<br />
between the overall change within the buffers and the total landscape. For example, there was an increase in<br />
Agriculture between 1972 and 2010 by 5.2% and within the buffer zone by 5.9%. Therefore, Agriculture increased<br />
within the buffer zone over the entire landscape by 0.8%. The areas highlighted in yellow are considered significant<br />
increases or decreases in land cover use compared to the entire landscape.<br />
1972 1985 1999 2010<br />
Average<br />
Difference<br />
over Time<br />
Agriculture 0.0% 1.3% 0.8% 0.7% 0.7%<br />
Coniferous Forest ‐1.2% ‐2.3% ‐0.9% ‐1.0% ‐1.3%<br />
Coniferous<br />
Wetland 0.4% 0.2% 0.0% ‐0.1% 0.1%<br />
Deciduous Forest ‐5.7% ‐6.1% ‐8.4% ‐5.7% ‐6.5%<br />
Deciduous Wetland 6.1% 4.0% 1.0% 0.2% 2.8%<br />
Herbaceous<br />
Wetland 2.3% 1.6% 1.1% 0.9% 1.5%<br />
Mixed Forest ‐0.3% ‐2.4% ‐1.5% ‐3.7% ‐2.0%<br />
Urban ‐3.4% 2.4% 6.7% 6.8% 3.1%<br />
Open Water 1.5% 0.9% 0.5% 0.1% 0.8%<br />
Table 3. The percent difference between the 3 km osprey nest buffer zone and the entire Rhode Island<br />
landscape for <strong>of</strong> each <strong>of</strong> the 12 categories <strong>of</strong> land cover for each year. The far right column indicates the<br />
average difference between the overall change within the buffers and the total landscape. For example, on<br />
average the landscape within 3 km <strong>of</strong> an osprey nest site had 6.5% less Deciduous Forest than would be<br />
expected given the total coverage <strong>of</strong> Deciduous Forest for the state. The highlighted values are considered<br />
significant because they are greater than 1%.<br />
31