

The Eleventh Regional Wheat Workshop For Eastern ... - Cimmyt
The Eleventh Regional Wheat Workshop For Eastern ... - Cimmyt
The Eleventh Regional Wheat Workshop For Eastern ... - Cimmyt

You also want an ePaper? Increase the reach of your titles
YUMPU automatically turns print PDFs into web optimized ePapers that Google loves.
<strong>The</strong> <strong>Eleventh</strong> <br />
<strong>Regional</strong> <strong>Wheat</strong> <strong>Workshop</strong> <br />
<strong>For</strong> <strong>Eastern</strong>, Central and <br />
Southern Africa <br />
Addis Ababa, Ethiopia<br />
18- 22 September, 2000<br />
ClMMYTICIDA Ea.~tern Africa Cereals Program <br />
CIMMYT <strong>Wheat</strong> Program <br />
CIMMYTIEU MWIRNETIRSA Project <br />
ClMMYT Economics Program <br />
Ethiopian Agricultural Research Organization
<strong>The</strong> <strong>Eleventh</strong> <br />
<strong>Regional</strong> <strong>Wheat</strong> <strong>Workshop</strong> <br />
<strong>For</strong> <strong>Eastern</strong>, Central and <br />
Southern Africa <br />
Addis Ababa, Ethiopia<br />
18-22 September, 2000<br />
Sponsored by:<br />
CIMMYT/CIDA <strong>Eastern</strong> Africa Cereals Program <br />
CIMMYT <strong>Wheat</strong> Program <br />
CIMMYT/EU MWIRNETIRSA Project <br />
CIMMYT Economics Program <br />
Ethiopian Agricultural Research Organization
CIMMYT® (www.cimmyt.cgiar.org) is an internationally funded, nonprofit scientific<br />
research and training organization. Headquartered in Mexico, the Center works with<br />
agricultural research institutions worldwide to improve the productivity, profitability, and<br />
sustainability of maize and wheat systems for poor farmers in developing countries. It is one<br />
of 16 similar centers supported by the Consultative Group on International Agricultural<br />
Research (CGIAR, www.cgiar.org). <strong>The</strong> CGIAR comprises about 60 partner countries,<br />
international and regional organizations, and private foundations. It is co-sponsored by the<br />
Food and Agriculture Organization (F AO) ofthe United Nations, the International Bank for<br />
Reconstruction and Development (World Bank), the United Nations Development<br />
Programme (UNDP), and the United Nations Environment Programme (UNEP). Financial<br />
support for CIMMYT's research agenda also comes-from many other sources, including<br />
foundations, development banks, and public and private agencies.<br />
CIMMYT supports Future Harvest®-a public awareness campaign that builds<br />
understanding about the importance of agricultural issues and international agricultural<br />
research. Future Harvest links respected research institutions, influential public figures, and<br />
leading agricultural scientists to underscore the wider social benefits of improved<br />
agriculture-peace, prosperity, environmental renewal, health, and the alleviation of human<br />
suffering (www.futureharvest.org).<br />
© International Maize and <strong>Wheat</strong> Improvement Center (CIMMYT) 2000. All rights reserved.<br />
Responsibility for this publication rests solely with CIMMYT. <strong>The</strong> designations employed in<br />
the presentation of material in this publication do not imply the expressions of any opinion<br />
whatsoever on the part of CIMMYT or contributory organizations concerning the legal status<br />
of any country, territory, city, or area, or of its authorities, or concerning the delimitation of<br />
its frontiers or boundaries. <strong>The</strong> views expressed in the papers included in this publication are<br />
the authors' and do not necessarily reflect the policies of their respective institutions.<br />
CIMMYT encourages fair use of this material. Proper ci!ation is requested.<br />
Printed in Ethiopia.<br />
Correct citation: CIMMYT. 2000. <strong>The</strong> <strong>Eleventh</strong> <strong>Regional</strong> <strong>Wheat</strong> <strong>Workshop</strong> for <strong>Eastern</strong>,<br />
Central and Southern Africa. Addis Ababa, Ethiopia: CIMMYT.<br />
ISBN: 92-9146-087-7<br />
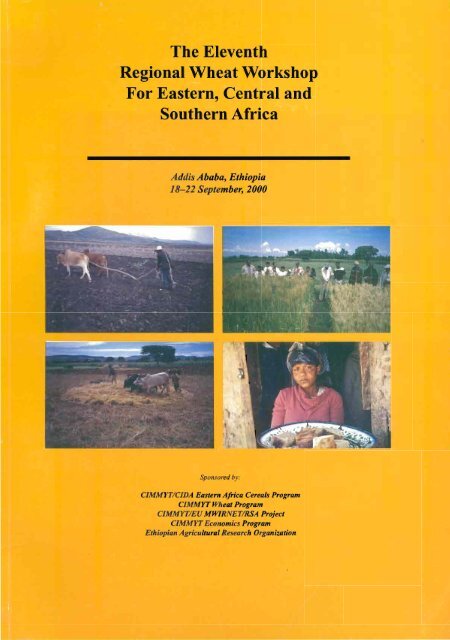
On the cover: Upper left: Land preparation by "maresha" (Debre Zeit, Ethiopia).<br />
Upper right: Farmer Research Group assessing wheat genotype by<br />
management level participatory trial (Debre Mewi, Ethiopia).<br />
Lower left: Farmers threshing wheat (Adet, Ethiopia).<br />
Lower right: <strong>The</strong> end product -- home-made "dabo" (Kulumsa, Ethiopia).<br />
[Photos provided by Douglas Tanner, CIMMYT]
TABLE OF CONTENTS <br />
Vll<br />
V111<br />
Acknowledgments.<br />
Countries participating in the <strong>Eleventh</strong> <strong>Regional</strong> \Vbeat <strong>Workshop</strong> for <strong>Eastern</strong>,<br />
Central and Southern Africa.<br />
A welcome on behalfofthe CIMMYT Board ofTmstees. lohan Holmberg.<br />
Crop Improvement<br />
6 CIMMYT's new approach to address production constraints in marginal areas <br />
Global Project 5. W.H. Pfeiffer, R.M. Trethowan and T.S. Payne.<br />
16 Sources of variation for grain yield performance of bread wheat in north-western<br />
Ethiopia. Tadesse Dessalegn, Bedada Girma, T.S. Payne, C.S. van Deventer and M.T.<br />
Labuschagne.<br />
25 Germplasm enhancement through wide hybridization and molecular breeding. Harjit<br />
Singh, H.S. Dhaliwal and Yifru Teklu.<br />
34 Quality of Ethiopian durum wheat cultivars. Efrem Bechere, R.1. Pena and Demissie<br />
Mitiku.<br />
45 On-farm demonstration of improved durum wheat varieties under enhanced drainage<br />
on Vertisols in the central highlands ofEthiopia. Fasil Kelemework, Teklu Erkosa,<br />
Teklu Tesfaye and Assefa Gizaw.<br />
49 Identification ofEthiopian wheat cuItivars by seed storage protein electrophoresis.<br />
Amsal Tarekegne, M.T. Labuschagne and H. Maartens.<br />
60 Genetic improvement in grain yield and associated changes in traits of bread wheat<br />
cultivars in the Sudan. Izzat S.A. Tahir, Abdalla B. Elahmedi, Abu EI Hassan S.<br />
Ibrahim and O.S. Abdalla.<br />
67 Increasing yield potential for marginal areas by exploring genetic resources<br />
collections. B. Skovmand and M.P. Reynolds.<br />
78 Bread wheat yield stability and environmental clustering of major wheat growing<br />
zones in Ethiopia. Debebe Masresha, Desalegn Debelo, Bedada Girma, Solomon<br />
Gelalcha and Balcha Yaie.<br />
87 Milling and baking quality of Ethiopian bread wheat cuItivars. Solomon Gelalcha,<br />
Desalegn Debelo, Bedada Girma, T.S. Payne, Zewdie Alemayehu and Balcha Yaie.<br />
97 Response of bread wheat genotypes to drought simulation under a mobile rain shelter<br />
in Kenya. P.K. Kimurto, M.G. Kinyua and 1.M. Njoroge.<br />
III
Table a/Contents<br />
105 Developing wheat varieties for the drought-prone areas of Kenya: 1996-1999. M.G.<br />
Kinyua, B. Otukho and O.S. Abdalla.<br />
112 Milling and baking quality of South African irrigated wheat cultivars. I. Mamuya,<br />
H.A. van Niekerk, M. Smith and F.P. Koekemoer.<br />
121 Response of elite wheat genotypes to sowing date in the northern region of the Sudan.<br />
Orner H. Ibrahim and O.S. Abdalla.<br />
129 Field performance of mixtures of four wheat cultivars in Sudan. Mohamed S.<br />
Mohamed, Abu Elhassan S. Ibrahim, AsharafM. Elhashim and Izzat S.A. Tahir.<br />
Crop Protection<br />
134 <strong>The</strong> assessment and significance of pathogenic variability in Puccinia striiformis in<br />
breeding for resistance to stripe (yellow) rust: Australian and international studies.<br />
C.R Wellings, RP. Singh, RA. McIntosh and A. Yahyaoui.<br />
144 Sources and genetic basis of variability of major and minor genes for yellow rust<br />
resistance in CIMMYT wheats. Ravi P. Singh and Julio Huerta-Espino.<br />
152 Performance of four new leaf rust resistance genes transferred to common wheat from<br />
Triticum tauschii and T monococcum. Temam Hussien.<br />
160 Host range of wheat stem rust in Ethiopia. Zerihun Kassaye and O.S. Abdalla.<br />
164 Stability of stem rust resistance in some Ethiopian durum wheat varieties. Sewalem<br />
Amogne, Woubit Dawit and Yeshi Andenow.<br />
169 Field response of bread wheat genotypes to Septoria tritid blotch. Temesgen Kebede<br />
and T.S. Payne.<br />
183 Is it necessary to apply insecticides to Russian wheat aphid resistant cultivars? V.<br />
Tolmay and R Mare.<br />
190 Russian wheat aphid resistant wheat cultivars as the main component of an integrated<br />
control program. V. Tolmay, G. Prinsloo and J. Hatting.<br />
195 Development of linear equations for predicting wheat rust epidemics in New HaIfa,<br />
Sudan. M.A. Mahir.<br />
208 Breeding for disease resistance in wheat in Uganda. William Wamala Wagoire.<br />
Crop Management<br />
216 Spatial tools for wheat research in <strong>Eastern</strong> and Southern Africa. D.P. Hodson, J.W.<br />
White, J.D. Corbett and D.G. Tanner.<br />
229 Response of some durum wheat landraces to nitrogen application on Ethiopian<br />
Vertisols. Teklu Erkossa, Tekalign Mamo, Selamyihun Kidane and Mesfin Abebe.<br />
IV
Table o/Contents<br />
239 Agronomic and economic evaluation of the on-farm Nand P response of bread wheat<br />
grown on two contrasting soil types in central Ethiopia. Amsal Tarekegne, D.G.<br />
Tanner, Taye Tessema and Chanyallew Mandefro.<br />
253 Effects of soil waterlogging on the concentration and uptake of selected nutrients by<br />
wheat genotypes differing in tolerance. Amsal Tarekegne, A.T.P. Bennie and M.T.<br />
Labuschagne.<br />
264 Effect of crop rotation and fertilizer application on wheat yield performance across<br />
five years at two locations in south-eastern Ethiopia. Amanuel Gorfu, Kefyalew<br />
Girma, D.G. Tanner, Asefa Taa and Shambel Maru.<br />
275 Effects of tillage and cropping sequence practices on wheat production over eight<br />
years on a farmer's field in the south-eastern highlands of Ethiopia. Asefa Taa, D.G.<br />
Tanner, Kefyalew Girma, Amanuel Gorfu and Shambel Maru.<br />
291 Survey of weed community structure in bread wheat in three districts of Arsi Zone in<br />
south-eastern Ethiopia. Kefyalew Girma, Shambel Maru, Amanuel Gorfu, Workiye<br />
Tilahun and Mekonnen Kassaye.<br />
302 Evaluation of herbicides for the control of brome grass in wheat in south-eastern<br />
Ethiopia. Shambel Maru, Kefyalew Girma and D.G. Tanner.<br />
309 Evaluation of the effects of surface drainage methods on the yield of bread wheat on<br />
Vertisols in Arsi Zone. Yesuf Assen, Duga Debele and Amanuel Gorfu.<br />
316 Crop rotation effects on grain yield and yield components of bread wheat in the Bale<br />
highlands of south-eastern Ethiopia. Tilahun Geleto, Kedir Nefo and Feyissa Tadesse.<br />
325 Impact of cropping sequence and fertilizer application on key soil parameters after<br />
three years of a crop rotation trial. 1. Kamwaga, p.G. Tanner, E.W. Nassiuma and P.<br />
Bor.<br />
336 <strong>The</strong> introduction of disease and pest resistant wheat cultivars to small-scale farming<br />
systems in the highlands of Lesotho. 1. Tolmay, M.L. Rosenblum, M. Moletsane, M.<br />
Makula and T. Pederson.<br />
341 Reducing mechanical harvesting losses of wheat under large-scale production in the<br />
Gezira Scheme, Sudan. Mamoun I. Dawelbeit.<br />
347 Effects of crop rotation, tillage method and N application on wheat yield at Hanang<br />
<strong>Wheat</strong> Farms, Tanzania. P.L. Antapa and W.L. Mariki.<br />
352 On-farm evaluation of the response of four bread wheat varieties to nitrogen fertilizer<br />
in Karatu district in northern Tanzania. H.A. Mansoor, RV. Ndondi, D.G. Tanner, P.<br />
Ndakidemi and R.T. Ngatokewa.<br />
360 Timing nitrogen application to enhance wheat grain yields in northern Tanzania. M.L.<br />
Mugendi, C. Lyamchai, W.L. Mariki and M. Israe1.<br />
v
Table o/Contents<br />
366 Delayed nitrogen application and late tiller production in wheat grown under<br />
greenhouse conditions. l.A. Adjetey and L.C. Campbell.<br />
370 Response of weed infestation and grain yield of wheat to frequency of tillage and<br />
weed control methods under rainfed conditions at Arsi Negelle, Ethiopia. Tenaw<br />
Workayehu.<br />
Economics<br />
379 Globalization ofthe wheat market and the emerging trends in wheat research and<br />
technology generation. P. Pingali.<br />
380 Farmer participatory evaluation ofpromising bread wheat production technologies in<br />
north-western Ethiopia. Aklilu Agidie, D.G. Tanner, Minale Liben, Tadesse<br />
Dessalegn and Baye Kebede.<br />
391 A client oriented research approach to the transfer of improved durum wheat<br />
production technology. Fasil Kelemework, Benmet Gashawbeza, Teklu Tesfaye and<br />
Teklu Erkosa.<br />
395 Economics of fertilizer use on durum wheat. Hailemariam T/Wold and Gezahegen<br />
Ayele.<br />
403 On-farm analysis of durum wheat production technologies in central Ethiopia. Kenea<br />
Yadeta, Setotaw Ferede, Hailemariam T/Wold and Fasil KlWork.<br />
411 A study of the adoption of bread wheat production technologies in Arsi Zone. Setotaw<br />
Ferede, D.G. Tanner, H. Verkuijl and Takele Gebre.<br />
427 Farmer participatory evaluation of bread wheat varieties and its impact on adoption of<br />
technology in West Shewa zone of Ethiopia. Kas~a Getu, Kassahun Zewdie, Amsal<br />
Tarekegne and Girma Taye.<br />
435 <strong>Eleventh</strong> <strong>Regional</strong> <strong>Wheat</strong> <strong>Workshop</strong> Participants.<br />
VI
ACKNO\VLEDGMENTS <br />
<strong>The</strong> Organizing Committee for the <strong>Eleventh</strong> <strong>Regional</strong> <strong>Wheat</strong> <strong>Workshop</strong> for <strong>Eastern</strong>, Central<br />
and Southern Africa wish to thank the following groups, organizations and individuals for<br />
their contributions towards the success of this workshop:<br />
• <strong>The</strong> management and staff of the ILRJ-Ethiopia campus for providing the conference and<br />
accommodation facilities, and for catering for the participants' requirements.<br />
• <strong>The</strong> CIMMYT/CIDA <strong>Eastern</strong> Africa Cereals Program, the CIMMYT <strong>Wheat</strong> and<br />
Economics Programs, and the CIMMYT/EU MWIRNETIRSA Project for supporting the<br />
travel and accommodation expenses for most of the 55 participants.<br />
• <strong>The</strong> management and staff of the Ethiopian Agricultural Research Organization (EARO)<br />
for organizing the field day visits to the Kulumsa and Debre Zeit research centers, and for<br />
arranging the hospitality enjoyed during each visit.<br />
• Dr. Seyfu Ketema, Director General of EARO, for officially opening the workshop, and<br />
welcoming the participants to Ethiopia.<br />
• H.E. Ambassador lohan Holmberg, Vice Chair of the Board of Trustees ofCIMMYT, for<br />
welcoming the workshop participants on behalf of the CIMMYT Board.<br />
• Dr. Sanjaya Rajaram, Director of the CIMMYT <strong>Wheat</strong> Program, for welcoming the<br />
workshop participants on behalf of the CIMMYT Director General and the <strong>Wheat</strong><br />
Program, and for his concluding comments to the workshop.<br />
• <strong>The</strong> keynote speakers: Drs. Wolfgang Pfeiffer, Prabhu Pingali, Ravi Singh and Colin<br />
Wei lings.<br />
• Mr. Antenyismu Workalemahu ofCIMMYT-Ethiopia for invaluable assistance with all<br />
aspects of local organization and logistics.<br />
• <strong>The</strong> technical and layout editors for the workshop proceedings: Thomas Payne for crop<br />
breeding and protection papers, and Douglas Tanner for crop management and socioeconomICS<br />
papers.<br />
• Mrs. Aklilewerk Bekele ofCIMMYT-Ethiopia for incorporating all revisions in the word<br />
processor files.<br />
• <strong>The</strong> Publications Unit of the International Livestock Research Institute (ILRJ) for printing<br />
the workshop proceedings in Ethiopia.<br />
Vll
e>.....<br />
I<br />
Countries participating in the <strong>Eleventh</strong> <strong>Regional</strong> <strong>Wheat</strong> <strong>Workshop</strong><br />
for <strong>Eastern</strong>, Central and Southern Africa.<br />
Vlll
A WELCOME ON BEHALF OF THE CIMMYT BOARD OF TRUSTEES<br />
lohan Holmberg<br />
Ambassador of Sweden to Ethiopia and Vice Chair, CIMMYT Board of Trustees<br />
Dear participants and friends,<br />
I may be an ambassador now, but my background is in agriculture and I worked with rural<br />
development in Ethiopia during the 1970s. I am here today as a representative of the<br />
CIMMYT Board to welcome you all to this workshop. Let me say at the outset that I am<br />
proud to represent CIMMYT. This is, as most of you know, one of the oldest and also largest<br />
of the CGIAR centers. Allow me on this occasion to brag a little about CIMMYT. While I<br />
may be partial, I have reason to believe that it is one of the very best CGIAR centers in terms<br />
of scientific output. It certainly is one of the leading CGIAR centers in terms of<br />
biotechnology and it is in the forefront as regards policies on IPRs. Given its mandate on<br />
maize and wheat it is what is called a commodity center and as such has a better sense of<br />
purpose than other centers with less clear mandates. World class research is being conducted<br />
at CIMMYT. Recently, CIMMYT received a prestigious prize for its research on highprotein<br />
maize. I am pleased that you can come here and share some of CIMMYT' s results.<br />
I already mentioned that I lived in Ethiopia during the 1970s. In fact, I lived here for five<br />
years working in agriculture and in the very area that you will visit tomorrow, the Arsi region<br />
some 170 km from here. I often get the question how Ethiopia of today compares with the<br />
Ethiopia that I knew 25 years ago. What I will do this morning is to try to answer that<br />
question from the perspective of agricultural development.<br />
It pleases me enormously that you will all be making a field trip tomorrow to the Kulumsa<br />
Research Center. In the bad old days, Kulumsa was an Italian farm; there are still Italian<br />
writings visible on some of the buildings. Later, in the· 1960s, Swedish experts identified<br />
Chilalo awraja in Arsi region as suitable for a new experimental rural development project<br />
trying what were then very innovative ideas, derived from the Comilla Academy in<br />
Bangladesh, to integrate different development activities designed to reduce rural poverty.<br />
This project started in 1967 after one year of preparation. From the outset, it developed<br />
Kulumsa as a seed farm and research station. When you go there tomolTow, most of the<br />
buildings that you will see were constructed as part of the Swedish-supported Chilalo<br />
Agricultural Development Unit, or CADU project. If you go on to Asella, you may see the<br />
project center with many more buildings - all built as part of CADU.<br />
<strong>The</strong> Swedes left the project in the late 1980s. By then, there were considerable problems<br />
arising out of the then government's policy of promoting collective approaches to agriculture,<br />
including forcing farmers to move into collective villages. It had become very difficult to<br />
assess project results and staff were very disenchanted. I think it is fair to say that it was with<br />
a certain relief that the Swedes terminated their support, but we were eventually replaced by<br />
Italians. Earlier this year, I participated in an OECD-sponsored evaluation of the large Italian<br />
aid program to Ethiopia. I was pleased to note that the Italian support in Arsi not only<br />
continues, but is regarded as one of the best projects in the Italian portfolio today!<br />
1
Welcome on behalfo/CIMMYT Board a/Trustees - lohan Holmberg<br />
I said that CADU was an integrated rural development project. <strong>The</strong>re has been much debate<br />
on the merits of such integrated projects and I will not go into that now. But I will say that I<br />
strongly believe that the basic concept remains valid. Farmers have multiple needs. It makes<br />
little sense to promote higher agricultural yields, if they cannot get their produce to market.<br />
<strong>The</strong>y need water, soil conservation, trees, support for their animals, and so on. And while all<br />
of that need not happen under the same roof, as it were, it must be attended to, otherwise<br />
bottlenecks will soon appear.<br />
And that takes me to one of the major accomplishments of the project that you will visit<br />
tomorrow. Because of its immediate success, to which I will return in a moment, CADU<br />
spawned a number of similar projects elsewhere in Ethiopia. <strong>The</strong>re was one around Debre<br />
Zeit, in Ada wereda, supported by USAID. <strong>The</strong>re was one in Welayta supported by the<br />
World Bank called W ADU. <strong>The</strong>n there was TAHADU up in Tigray close to the border with<br />
Eritrea. Most importantly, there was the nation-wide Minimum Package Program supported<br />
by the World Bank and a host of bilaterals that extended the basic features of these so called<br />
maximum package programs throughout the country. All of these programs basically were<br />
closed down or radically changed during the 1980s. But to this day there is recognition in<br />
Ethiopia that rural development is a process of promoting a set of co-ordinated actions<br />
ranging from agricultural research to road construction. <strong>The</strong> fact that this approach is so<br />
firmly grounded in Ethiopia derives, I believe, from the success of the package projects<br />
started in the 1960s, of which CADU was the first.<br />
I will not bore you with figures and data from a project started over 30 years ago - it would<br />
be easy for me to wax sentimental and get carried away. However, the number of credit<br />
recipients increased from 189 in 1967/68 to 57,000 in 75176 and on to some 90,000 in<br />
1982/83. What theproject did was to essentially promote green revolution type technology,<br />
principally
Welcome on behalfofCIMMYT Board ofTrustees - Johan Holmberg<br />
<strong>The</strong> urban population is only 16.7% and the country basically lacks urban growth centers that<br />
can absorb labor surpluses from the countryside. Industry makes a contribution to GDP of<br />
only 6.7%, the smallest of any country in the world. <strong>The</strong> topography is dramatic with<br />
agriculture being practiced at altitudes ranging from 1,000 to almost 4,000 m a.s.1. providing<br />
strong challenges to agricultural research and extension. Average road density is only 0.44<br />
km per 1,000 population, one of the lowest in Africa. This means that 75% of all farms lie<br />
more than a half-day walk from an all-weather road, or, put differently, three-quarters of all<br />
farms cannot be reached by car. Nearly two-thirds of rural holdings are less than 1 ha.<br />
All of this, of course, means tremendous challenges for the agricultural sector. Few countries<br />
are as dependent on raising productivity in agriculture as Ethiopia. Few countries are as<br />
sensitive to setbacks affecting that sector as Ethiopia, be they caused by the vagaries of the<br />
climate or by policy failure. <strong>The</strong> government is well aware that agriculture is the engine of<br />
growth in the Ethiopian economy. However, agricultural growth rates are still inadequate<br />
when compared to the rate of growth of population. Production levels fluctuate with rainfall.<br />
Growth in the sector has declined in recent years due to bad weather conditions. Some 10<br />
million people are this year requiring emergency food aid.<br />
Key to agricultural development today, as was the case 25 years ago, is land policy. While I<br />
lived here the revolutionary government in 1975 proclaimed what was then called the most<br />
radical land reform anywhere in the world which in one bold stroke abolished privately<br />
owned land saying that all land belongs to the state, nationalized commercial holdings into<br />
state farms, and gave all peasants usufruct rights to land under the slogan "land to the tiller".<br />
In the 25 years that have passed since then the country's population has doubled. <strong>The</strong>re is<br />
now a desperate shortage of arable land. Holdings are getting smaller and smaller, indeed<br />
fully 45% of all households are said to farm less than 0.5 ha. <strong>The</strong>re is a desperate need to<br />
consolidate farm holdings and get people off the land into alternative employment<br />
opportunities. As you travel around the country, you frequently see large fertile areas suitable<br />
for modern, mechanized agriculture which are fragmented into tiny plots each being<br />
cultivated by a man using oxen and a wooden plough. Surely this is one of the major factors<br />
behind Ethiopia's chronic food insecurity. <strong>The</strong> population pressure has made this issue much<br />
more acute than it was 25 years ago, and it has therefore become politically sensi tive as well.<br />
But I believe the government understands that this issue requires attention.<br />
<strong>The</strong> other aspect is, of course, the need to raise yields on fanners' fields. I am aware of<br />
CIMMYT papers showing the rising yield trends of bread wheat cultivars released in<br />
Ethiopia since the 1950s. But the number of farmers using improved wheat varieties is still to<br />
this day tiny, relative to the total farming popUlation; remember that I just said that 75% of<br />
rural households remain largely inaccessible. <strong>The</strong>re has been an increase in cereal output in<br />
the last decade, but that has largely been due to expansion of the area cultivated, often at the<br />
expense of increased soil erosion and reduced fallow. Clearly, this is not sustainable and does<br />
not bode well for food security in the long term.<br />
A major characteristic of modern farm input use in Ethiopia is the dependence on only one<br />
input, fertilizer. Again, this is probably a consequence of the package programs of the 1970s<br />
which arguably promoted fertilizer use, as such successfully, but often at the expense of<br />
improved seeds. Fertilizer use increased by nearly 10% per year during 1991-98, one reason<br />
being that unlike in other African countries fertilizer was not seriously affected by the<br />
removal of subsidies. But the potential of fertilizer is not being fully exploited. <strong>The</strong> seed<br />
3
Welcome on behalfofCIMMYTBoard ofTrustees - Johan Holmberg<br />
quality is often low which reduces possible yield increases. ShOltcomings in the extension<br />
service often mean that farmers do not apply the right quantities. Having invested in<br />
fertilizer, farmers are usually too poor to afford other modern inputs, such as pesticides,<br />
despite rampant insect and disease problems. Further, fertilizer marketing is marred by<br />
regional monopolies and an absence of competition.<br />
<strong>The</strong> regionalized administrative structure in the country has made important progress relative<br />
to 25 years ago. <strong>The</strong> constitution now gives the country a federal structure where the regional<br />
states have considerable autonomy in designing and implementing development<br />
interventions. This has addressed perhaps the major shortcoming of the old package<br />
programs, namely that they were independent entities with minimal ties to the local<br />
administration. I remember that in CADU we regarded the local administration as crooked<br />
and corrupt and tried to avoid it as far as possible. Obviously that is not sustainable over the<br />
long-term. Today, the local administrations are much more in control of development.<br />
Projects for rural development are implemented through the regional authorities at various<br />
levels, representing a vast improvement.<br />
What this means is that at the regional state level there are agencies for farm credit,<br />
agricultural extension and agricultural research. Capabilities in this regard vary from one<br />
regional state to another, as might be expected. But this structure gives a stronger sense of<br />
local ownership and better possibilities of adaptation to the varying local circumstances than<br />
was the case 25 years ago.<br />
<strong>For</strong> example, most regional states now have their own micro-finance credit institutions, often<br />
using a group approach to extending credit. While many of these institutions are struggling<br />
with difficult issues of finance and operating costs, their lending is expanding and loan<br />
recovery rates are surprisingly high, e.g., in Arnhara <strong>Regional</strong> State, recovery rates are<br />
consistently claimed to be close to 100%. Despite existing problems, there seems to be in<br />
place a sustainable structure for the provision of farm credit.<br />
<strong>The</strong> extension system appears to be more problematic. It would seem to have expanded too<br />
fast with regards to quantity at the expense of quality. In the Minimum Package Program 25<br />
years ago, there was a strict structure with one agricultural extension agent for about 2,000<br />
farmers, five extension areas located adjacent to one another along an all-weather road, and<br />
one supervisor for one such zone with five extension agents. An extension agent usually had<br />
completed 12th grade in school and in addition had studied for two years at an agricultural<br />
college. Today, there are altogether 13,651 so-called development agents, in addition to 935<br />
home agents, and 1,178 supervisors in the extension system. This means over 12 agents per<br />
supervisor, too high a number for effective supervision.<br />
A development agent is expected to serve 700-1,000 farmers. But he/she is less well trained<br />
than the extension agents of old: today an agent often has less than 12 years of schooling and<br />
receives specialized training for only nine months. <strong>The</strong> development agents are frequently<br />
required to perform work unrelated to agriculture which reduces the time they have for their<br />
regular tasks. Often agents lack practical farming knowledge and specific information about<br />
the technologies that they are asked to promote. <strong>The</strong> validity of their advice can therefore<br />
often be called into question. <strong>The</strong> expansion of the extension service has been carried out in<br />
the interest of reaching as many farmers as possible, an as such laudable egalitarian policy<br />
4
Welcome on behalfofCIMMYT Board ofTrustees - Johan Holmberg<br />
first introduced by the previous socialist government. But there is no doubt that extension<br />
today is a weak link in the chain of services promoting increased agricultural productivity.<br />
But the extension service is also hampered by the weaknesses of the seed multiplication<br />
system and of research. Less than 2% of all fanners use improved seed. Besides, the quality<br />
of improved seeds is generally low. One of the major problems is loss of genetic quality due<br />
to long periods of repeated use. <strong>The</strong> research system is weak and unable to replace old<br />
varieties with new ones at the right time. Erratic rainfall has in places affected seed<br />
production, and irrigation is insufficiently developed in support ofseed production. <strong>The</strong>re is a<br />
national parastatal company responsible for seed multiplication and distribution, but its<br />
capabilities are totally inadequate relative to the needs. <strong>The</strong> only international seed company<br />
operating in the country, Pioneer, produces only hybrid maize seed. No other private seed<br />
producer is operating in the country. In Amhara <strong>Regional</strong> State, promising approaches have<br />
been made to contract private fanners to multiply seed, but the bottleneck then becomes the<br />
shortage of basic seed. Clearly, this is an area with considerable room for improvement.<br />
This brings me to the shortcomings in the agricultural research system. Here I need to weigh<br />
my words carefully since I am acutely aware than I am talking to many representatives of that<br />
system. I believe the organizational changes brought about in research since 25 years ago<br />
have been on the whole conducive to making the system more responsive to the great<br />
locational variability that is characteristic of Ethiopian agriculture with a national umbrella<br />
organization coupled with attempts to strengthen research at the regional state level. But<br />
clearly the resources available to the system are far from adequate. <strong>The</strong> latest figures I have<br />
are from 1993/94. In that year, research expenditure in Ethiopia was equivalent to only 0.2%<br />
of agricultural GDP which is far below the recommendation from the CGIAR institute<br />
ISNAR - that 2% of agricultural GDP be invested in agricultural research. Lack of funds<br />
creates difficulty in retaining qualified staff and creating the essential critical mass of<br />
scientists. Since private agricultural research is non-existent in Ethiopia, those who leave the<br />
national research system either join other professions or go abroad. At a recent well-attended<br />
conference on economic development in Ethiopia, the need for increased attention to<br />
agricultural research was scarcely mentioned. This begs the question of whether the<br />
importance of more investment in this area is well underst'Ood by decision-makers.<br />
Dear friends and colleagues,<br />
It is time to wind up. You only need to be a casual reader of newspapers to understand that<br />
Ethiopia is facing serious problems with regards to national food security. While important<br />
improvements have been made over the 25 years or so during which I have been able to<br />
monitor agricultural development in this country, many difficult issues remain. I have tried to<br />
give you some perspective for the visit that you will make to Kulumsa tomorrow. Once more,<br />
most welcome to this workshop which I hope will be interesting and productive. I thank you.<br />
5
CIMMYT'S NE\V APPROACH TO ADDRESS WHEAT PRODUCTION <br />
CONSTRAINTS IN MARGINAL AREAS - GLOBAL PROJECT 5 <br />
Wolfgang H. Pfeiffer\ Richard M. Trethowan 1 and Thomas S. Payne 2<br />
lCIMMYT <strong>Wheat</strong> Program, Apdo. Postal 6-641, 06600 Mexico D.F., Mexico<br />
2CIMMYT/EU East Africa, P.O. Box 5689, Addis Ababa, Ethiopia<br />
ABSTRACT<br />
Recently, CIMMYT has instituted a project-based management system<br />
(PBMS) to better organize and integrate its research activities. <strong>The</strong> aim of<br />
PBMS is to increase our research effectiveness and efficiency by enhancing<br />
cross-program and collaborative partner interactions through multidisciplinary<br />
research. Global Project 5 (GP5) - "Increasing <strong>Wheat</strong> Productivity and<br />
Sustainability in Stressed Environments" - emphasizes germplasm<br />
improvement, production systems and natural resource management for<br />
marginal environments. It has a strong strategic research component and<br />
consists of a multi-disciplinary team of scientists. <strong>The</strong> project capitalizes on<br />
synergies resulting from an integrated, interdisciplinary focus on major<br />
stresses across crop commodities. SUb-projects 1 to 3 concentrate on crop<br />
enhancement targeting moisture, temperature, and nutrient stresses,<br />
respectively. Sub-projects 4 to 6 generate knowledge and methodologies for<br />
crop improvement and management while integrating applied and strategic<br />
research within sustainable wheat production systems. <strong>The</strong> concepts and<br />
strategies of GP5 are developed from recent research data, linking strongly<br />
with current "state-of-the-art" breeding.<br />
INTRODUCTION<br />
Borlaug and Dowswell (1997) observed, "<strong>The</strong> only way' for agriculture to keep pace with<br />
population and alleviate world hunger is to increase the intensity of production in those<br />
ecosystems that lend themselves to sustainable intensification, while decreasing intensity of<br />
production in the more fragile ecosystems." By 2020, "<strong>The</strong> world's farmers will have to<br />
produce 40% more grain . . . most of which will have to come from yield increases"<br />
(Pinstrup-Andersen et aI., 1999). Projecting diminishing per capita land and water resources<br />
during the coming century, recent studies predict production must increase by 1.6% per<br />
annum over the next 20 years to meet the increasing demand for wheat on the global level.<br />
About half the required production increases are expected to come from crop management<br />
research (CMR), with crop improvement required to contribute nearly 1% per annum. This<br />
poses an immense challenge to wheat improvement research, given that in recent years<br />
genetic gains of such magnitude have been infrequently realized (Byerlee and Traxler, 1999;<br />
Calderini et al., 1999).<br />
About 60% of the wheat area in the developing world - 75 million hectares - are affected by<br />
abiotic stress, with approximately 45 million hectares subject to moisture stress, and<br />
temperature extremes and nutrient stresses affecting a similar acreage. Impact from<br />
agricultural research can be seen in farmer's fields and production statistics (Byerlee and<br />
6
CIMMYT's Global Project 5 - Pfeiffer et al.<br />
Moya, 1993). Adoption rates indicate that modern varieties grown in dry regions are<br />
approaching those in more optimal irrigated and high rainfall areas. After an initial lag,<br />
adoption rates in drought prone rainfed areas in Argentina, Pakistan and Syria are above<br />
90%. Data from 1998 exhibits a similar situation in North Africa with adoption rates<br />
between 80% and 90% for Morocco and Tunisia. Only Algeria lacks behind with adoption<br />
rates of modern varieties below 50%.<br />
Increasing and stabilizing production in abiotically stressed environments poses one of the<br />
greatest challenges for agricultural research in the 21 sl century. <strong>The</strong>se environments are<br />
fragile, highly variable and crop yields are often non-economic due to deteriorating natural<br />
resources. Constraints are intrinsic: gains for agronomic inputs decrease with increasing<br />
moisture stress. Translated to crop improvement, genetic gains are hard to measure and<br />
therefore difficult to achieve. This situation implies that over-proportional genetic gains and<br />
production increases are required to change this disparity, frequently even to reach economic<br />
production levels (low and unstable farm-level yields and aggregate regional production<br />
from rainfed environments).<br />
Another complication is the high variability of abiotic stress environments. Singh and<br />
Byerlee (1990) analyzed wheat yield variability in 57 countries over 35 years. Yield<br />
variability was measured by calculating coefficients of variation of yields around linear<br />
trends. Amount and distribution of rainfall was the predominant factor influencing yield<br />
variability: countries in which half the wheat was sown in dryland conditions experienced<br />
twice as much variability as countries in which wheat is mostly grown under well watered<br />
conditions. Yield variability also tended to be higher in warmer subtropical countries due to<br />
heat stress. Genotypes selected in one year under severe stress often perform poorly in<br />
subsequent years when moderate stress may occur. Consequently selection gains tend to<br />
cancel each other out because genotypes are unlikely to be superior over the wide range of<br />
production conditions experienced. <strong>The</strong>se changing environmental indices and subsequent<br />
low realized heritabilities mask genetic potential, while adaptive traits and trait combinations<br />
are complex and difficult to identify.<br />
Many cereal breeders working in dry environments long ago gave up attempting to screen for<br />
drought tolerance per se. <strong>The</strong> genetics of drought tolerance is poorly understood and the<br />
highly variable nature of rainfall in these environments makes genetic progress for drought<br />
tolerance extremely difficult, as drought patterns are not consistent among years. In addition,<br />
many biotic and abiotic factors are frequently misinterpreted as expression of drought<br />
tolerance. <strong>For</strong> example, plants tolerant to nematodes or micro-nutrient imbalances, may be<br />
selected as drought tolerant by the plant breeder, simply because they have healthier root<br />
systems. Some of the key constraints confronting breeders in stress environments are listed in<br />
Table 1. Breeders have therefore concentrated on improving tolerance to those factors,<br />
particularly diseases, for which they have known and repeatable variation.<br />
To improve genetic gains and realize production increases in stressed environments,<br />
researchers need to:<br />
• Better characterize environments using physical parameters and probability ranges for<br />
climatic variables to identify relevant traits and apply weighted selection indices;<br />
• Identify morpho-physiological drought adaptive traits and molecular markers with higher<br />
heritability than yield;<br />
• Develop more efficient screening and selection methodologies and tools;<br />
7
CIMMYT's Global Project 5 - Pfeiffer et at.<br />
• Develop and implement sustainable crop management practices.<br />
In January 1998, CIMMYT instituted a project-based management system (PBMS) to<br />
organize research under its Medium Term Plan. <strong>The</strong> aim of PBMS is to increase research<br />
effectiveness and efficiency by enhancing cross-program interactions and multidisciplinary<br />
research including improved collaborative opportunities with CIMMYT's partners. Global<br />
Project 5 (GP5) - "Increasing <strong>Wheat</strong> Productivity and Sustainability in Stressed<br />
Environments" --emphasizes germplasm improvement, production systems and natural<br />
resource management in marginal environments. It has a strong strategic research component<br />
and consists of a multi-disciplinary team of scientists.<br />
GP5 employs a concept different from the traditional crop commodity oriented approach with<br />
individual crop programs (bread wheat, durum and triticale) addressing applied and strategic<br />
research. <strong>The</strong> project capitalizes on synergies resulting from an integrated, interdisciplinary<br />
focus on major target stresses across crop commodities. Sub-projects 1, 2, and 3 concentrate<br />
on crop enhancement for the major stress areas - SP I moisture stress, SP2 temperature<br />
extremes, and SP3 nutrient stress and pH extremes. SP 4, 5, and 6 generate knowledge and<br />
methodologies required by integrating applied and strategic research (crop physiology, crop<br />
management, biotechnology, biometrics, IWIS/International Testing, GIS). This paper<br />
outlines the project structure and some recent findings.<br />
<strong>The</strong> Structure Of <strong>The</strong> PBMS <br />
<strong>For</strong> Improving Productivity In Abiotically Stressed Environments <br />
(1) Development of drought, temperature and pH tolerant wheat and triticale<br />
germplasm<br />
Expansion of genetic variability:<br />
To build upon past successes in the development of drought tolerant wheat, it will be<br />
necessary to expand the genetic variability currently available in both the hexaploid and<br />
tetraploid gene pools. Among the hexaploid bread wheats, new and useful variation is being<br />
exploited through the production of synthetic wheats. <strong>The</strong>se wheats result from crosses<br />
between the two putative progenitors of wheat (Aegi/ops tauchii and Triticum durum) with<br />
subsequent chromosome doubling. Historically, this cross has probably occurred on few<br />
occasions and consequently, there has been limited sampling of the genetic resources of these<br />
two species in the development of bread wheat. <strong>The</strong> A. tauchii accessions currently available<br />
have been collected in some of the harshest environments on earth and have evolved over<br />
thousands of years in conditions of periodic drought, heat, flooding and frosting. This<br />
material should also be more amenable to the identification and application of molecular<br />
marker technology as the frequency of polymorphisms can be expected to be considerably<br />
higher than that found in conventional wheat. <strong>The</strong> T dicoccum wheats and tetraploid<br />
landraces provide useful potential sources of variation that can also be further exploited.<br />
Figure 1 outlines the impact on bread wheat breeding for drought tolerance of germplasm<br />
derived from crosses with synthetic and tetraploid germplasm at CIMMYT. Crosses with<br />
synthetic and tetraploid parents give respective genetic gains 4% and 3% greater than crosses<br />
among bread wheat alone.<br />
8
CIMMYT's Global Project 5 - Pfeiffer et at.<br />
Refinement of selection environments to better predict drought tolerance per se:<br />
<strong>The</strong> variable nature of rainfall leads to low realized heritability for grain yield during the<br />
selection of segregating generations for drought tolerance in most dry environments. Large<br />
Genotype x Year interactions frequently obscure genetic gains. <strong>The</strong> more repeatable the<br />
selection environment, the greater the genetic gain. <strong>The</strong> CIMMYT wheat program utilizes a<br />
dry, arid location near Cuidad Obregon in north-western Mexico (27°N, 40 m a.s.!.) to screen<br />
for drought tolerance per se. <strong>The</strong> heritability of selection in this environment is high, ranging<br />
between 0.5 and 0.7 year-to-year. Germplasm is developed by alternating the selection of<br />
segregating generations between this dry environment and a high rainfall site in the central<br />
Mexican highlands (19°N, 2640 m a.s.!.). <strong>The</strong> strategy was developed to combine drought<br />
tolerance with input responsiveness and resistance to the foliar diseases.<br />
However, whilst this methodology has been successful in providing elite drought tolerant<br />
germplasm to many countries, the question remains 'can this selection process be modified or<br />
fine tuned to better reflect the target environments in the NARS?' A trial consisting of bread<br />
wheat, durum wheat and triticale genotypes, already tested extensively internationally, has<br />
been grown using various moisture stress scenarios in Obregon. Moisture stress was<br />
generated using gravity-fed, overhead sprinkler and drip irrigation regimes. <strong>The</strong> results from<br />
1998-1999 and 1999-2000 are presented as a dendrogram in Figure 2. <strong>The</strong> initial results<br />
indicate that the simulated "Mediterranean" or post-anthesis stress (identified as ME4A in<br />
Figure 2) simulated using either gravity, sprinkler or drip irrigation in Obregon does not<br />
cluster well with most global test locations. Similarly, the gravity fed continuous stress trials<br />
from Obregon (Gravity ME4C) which represent residual moisture stress environments and<br />
the optimally irrigated drip experiment (Drip MEl) tended to cluster with the Obregon<br />
generated ME4A treatments only. However, late sowing (Gravity heat), pre-anthesis<br />
generated drought (Sprinkler ME4B) and severe stress generated using drip irrigation (Drip<br />
ME4C) demonstrated closer associations with global drought locations. <strong>The</strong>se results indicate<br />
association among environments on the basis of their correlated ranks, it does not preclude<br />
the selection of high yielding, well adapted germplasm from CIMMYT's elite nurseries<br />
traditionally selected in Obregon using; gravity fed ME4A and C conditions.<br />
Analysis of the international trial data for bread and durum wheat indicates significant G x E<br />
interactions among global testing locations (De Lacy et ai., 1994; Abdalla et at., 1996). To<br />
better understand the underlying causes of G x E in key wheat growing stress environments,<br />
an investigative performance nursery has been assembled. This nursery or International<br />
Adaptation Trial (lA T) contains probe genotypes that differentiate most major soil borne<br />
stresses, both biotic and abiotic. <strong>The</strong> aim of the IAT is to:<br />
• Target environments subject to drought, heat and low pH in client NARS countries;<br />
• Identify production constraints and relevant traits to better tailor germplasm to these<br />
areas;<br />
• Identify and verify morpho-physiological and molecular markers;<br />
• Examine the relevance of Mexican breeding/testing locations to stress patterns in client<br />
countries;<br />
• Investigate agronomic practices, trial designs and biometrical techniques. <strong>The</strong> results<br />
generated from the deployment of the IAT during the next three years will enable<br />
breeders from all participating countries to better target their crossing programs. Data can<br />
also be used to improve and validate both genetic and agronomic simulation models.<br />
9
CIMMYT's Global Project 5 - Pfeiffer et al.<br />
Progress in breeding for phosphorous use efficiency has been significant over time (Ortiz<br />
Monasterio, unpublished data) (Figure 3). Whilst genotype response to applied P has been<br />
significant over time, the newer cultivars also outperform their predecessors at low levels of<br />
P. Similar patterns of response have also been observed for nitrogen (Ortiz-Monasterio et aI.,<br />
1997).<br />
(2) Determination of the physiological and genetic basis for abiotic stress tolerance and<br />
the development of efficient selection methodologies<br />
Identification and inheritance of drought adaptive traits:<br />
To improve genetic progress for drought tolerance the existing variation must be properly<br />
characterized and the physiological, morphological and genetic basis understood. While a<br />
number of traits or trait combinations have been proposed for indirect selection (Marshall,<br />
1987; Richards and Condon, 1994), there has been little progress in the practical application<br />
of selection for these traits in wheat breeding programs. This has been largely due to the<br />
cumbersome and time-consuming nature of most assays for these characters. However, an<br />
exception is canopy temperature depression (CTD), a measure of the difference between<br />
canopy temperature and ambient temperature, is being successfully used at CIMMYT to<br />
select genotypes tolerant to heat (Amani et al., 1996; Reynolds et aI., 1994).<br />
<strong>The</strong> previous section deals with the quantification of repeatable genetic variation, once this<br />
has been determined, those traits or trait combinations contributing to improved performance<br />
can be identified. Quantification of differences among drought tolerant and intolerant<br />
populations in repeatable environments will be an important first step in understanding both<br />
the physiological and molecular basis of drought tolerance.<br />
Development and implementation of molecular strategies:<br />
Once key areas of the genome are identified that contribute to drought tolerance under a<br />
particular set of environmental conditions, the plant breeder can then begin combining<br />
adaptation to various types of drought. <strong>The</strong> development of QTLs may also identify regions<br />
orthe genome that are constant to all moisture limiting conditions. To date, this technology is<br />
not available to the wheat breeder, however QTLs offer potential for the enhancement of<br />
drought tolerance per se in wheat improvement programs around the world. At CIMMYT two<br />
mapping populations combining drought tolerant and intolerant parents are currently being<br />
assessed with the view to identifying possible QTLs. However, of perhaps greater<br />
significance will be the application of functional genomics. Examining proteins produced by<br />
different loci in different environments will allow breeders to optimize their crossing<br />
strategies and in time, may lead to the identification of key genes responsible for both<br />
specific and general adaptation to drought.<br />
Among the technologies currently available, DNA finger printing of key germplasm once<br />
characterized for drought tolerance offers the most potential. Breeders could more accurately<br />
estimate coefficients of parentage and increase the efficiency of their crossing programs.<br />
Finger printing could also provide useful information on those regions of the genome<br />
contributing to drought tolerance.<br />
10
CIMMYT's Global Project 5 .. Pfeiffer et al.<br />
(3) Develop and disseminate sustainable crop and resource management strategies to<br />
increase productivity and stability of rainfed wheat systems<br />
To realize genetic gains in drought tolerance in farmer's fields, suitable agronomic practices<br />
must be implemented. Moisture conservation practices such as reduced or zero tillage and<br />
stubble retention require a change in infrastructure. Many farmers, particularly those from<br />
developing countries, are unable to cope with the associated expense of implementation of<br />
these new techniques, however, the interaction of tillage regime x genotype will be very<br />
important in realizing significant gains in productivity in dry environments. Other practices<br />
such as shifting cultivation or periods of fallow and water harvesting will also better utilize<br />
available moisture. This sub project aims to: 1) disseminate crop management solutions to<br />
intelmediate users (NARS, NGOs) and farmers; 2) advise breeding programs re appropriate<br />
management practices for germplasm screening; 3) develop crop management strategies to<br />
optimize productivity in different agro-ecological systems.<br />
Results from residue management experiments conducted at EI Batan (K. Sayre, unpublished<br />
data) indicate wheat and maize yields can be significantly improved through zero tillage and<br />
stubble retention practices (Figure 4). Significant advances have been made in water and<br />
nitrogen management in the Yaqui Valley in northwestern Mexico through the introduction<br />
of bed planting (Sayre, 1998). <strong>The</strong> teclmology is now being evaluated in India, Pakistan, Iran<br />
and China with the aim of increasing farmer returns per hectare.<br />
(4) Develop and use data bases, such as the International <strong>Wheat</strong> Information System<br />
(IWIS), to improve the adaptation of wheat to abiotic stress<br />
Improved collection/use of information and characterization of testing environments:<br />
<strong>The</strong> CIMMYT wheat program distributes wheat germplasm around the world each year.<br />
Cooperators from many countries return yield and disease information collected on these<br />
germplasm sets. <strong>The</strong> information on the performance of key lines in low yielding<br />
--environments is used to drive the crossing program at base in Mexico. Environments are<br />
-characterized on the basis of their stress patterns and crosses are made among the various<br />
specific and general performers. <strong>The</strong> aim of this strategy is to combine those parts of the<br />
genome contributing to drought tolerance in different stress environments. Whilst most<br />
cooperators will return yield data, there is scant information returned on environmental<br />
parameters or other potentially confounding stresses, such as disease and micro-nutrient<br />
imbalances. <strong>The</strong> mechanism contributing to the superior perfornlance of a particular genotype<br />
in one environment cannot be properly understood. It is therefore critical that the global<br />
testing environments are properly characterized year to year. <strong>The</strong> same principle applies to<br />
multi-location yield evaluation networks within smaller regional wheat improvement<br />
programs.<br />
Data management systems such as IWIS are of fundamental importance if breeders and<br />
associated researchers are to fully utilize these international data. IWIS is currently undergoing<br />
modification to encompass a wider range of cultivated cereals. This new system, now<br />
known as the International Crop Information System (lCIS), will provide both pedigree and<br />
data management options to breeders and genetic resource managers working in different<br />
crop species.<br />
11
CIMMYT's Global Project 5 - Pfeiffer et al. <br />
REFERENCES <br />
Abdalla, O.S., Crossa, J., Autrique, E. and I.H. DeLacy. 1996. Relationships among International testing sites of<br />
spring durum wheat. Crop Sci. 36: 33-40.<br />
Amani, I., Fischer, R.A. and M.P. Reynolds. 1996. Canopy temperature depression association with yield of<br />
irrigated spring wheat cultivars in a hot climate. 1. Agronomy and Crop Sci. 176: 119-129.<br />
Borlaug, N.E. and C.R. Dowswell. 1997. <strong>The</strong> acid lands: One of agriculture's last frontiers. pp. 5-15. In: Plant<br />
Soil Interactions at Low pH. Moniz, A.c. et al. (ed.). Brazilian Soil Science Society, Brazil.<br />
Byerlee, D. and P. Moya. 1993. Impacts ofInternational <strong>Wheat</strong> Breeding Research in the Developing World,<br />
1966-1990. Mexico, D.F.: CIMMYT.<br />
Byerlee, D. and G. Traxler. 1999. Estimation of actual spillovers of national and international wheat<br />
improvement research. pp. 46-59. In : <strong>The</strong> Global <strong>Wheat</strong> Improvement System: Prospects for<br />
Enhancing Efficiency in the Presence of Spillovers. Maredia, M.K. and Byerlee, D. (eds.). CIMMYT<br />
Research Report No.5. ClMMYT, Mexico.<br />
Calderini, D.F., Reynolds, M.P. and G.A. Siafer. 1999. Genetic gains in wheat yield and main physiological<br />
changes associated with them during the 20 lh century. In: <strong>Wheat</strong>: Ecology and Physiology of Yield<br />
Determination. Satorre, E.H. and G.A. Slafer, (eds.). Food Products Press, New York.<br />
DeLacy, I.H., Fox, P.N., Corbett, J.D., Crossa, J., Rajaram, S., Fischer, R.A. and M. van Ginkel. 1994. Longterm<br />
association of locations for testing spring bread wheat. Euphytica 72: 95-106.<br />
Marshall, D.R. 1987. Australian plant breeding strategies for rainfed areas. pp. 89-100. In: 'Drought tolerance in<br />
winter cereals'. Srivastava, J.P. Porceddu, E., Acevedo, E. and S. Varma (eds.). John Wiley & Sons.<br />
Ortiz-Monasterio R., J.1., Sayre, K.D., Rajaram, S. and M. McMahon. \997. Genetic Progress in <strong>Wheat</strong> Yield<br />
and Nitrogen Use Efficiency under four N Rates. Crop. Sci. 37(3): 898-904.<br />
Pinstrup-Andersen, P., Pandya-Lorch, R. and M.W. Rosegrant. 1999. World food prospects: Critical issues for<br />
the early twenty-first century. 2020 Vision Food Policy Report. IFPRl, Washington, D.C. 32p.<br />
Reynolds, M.P., Balota, M., Delgado, M.I.B., Amani, 1. and R.A. Fischer. \994. Physiological and<br />
morphological traits associated with spring wheat yield under hot irrigated conditions. Aust. J. Plant<br />
Physiol. 21: 717-730.<br />
Richards, R.A. and A.G. Condon. 1994. New 'yield genes' for wheat. Proc. 7 1h Australian <strong>Wheat</strong> Breeding<br />
Assembly, South Australia, Sept. pp. 159-163.<br />
-- Sayre, K.D. 1998. Ensuring the use of sustainable crop management strategies by small wheat farmers in the 21 sl<br />
century. <strong>Wheat</strong> Special Report No. 48. Mexico. D.F.:CIMMYT.<br />
Singh, AJ. and D. Byerlee. 1990. Relative variability in wheat yields across countries and over time. J. ofAgric.<br />
Econ. 41: 21-32.<br />
Questions and Answers:<br />
Izzat S.A. Tahir: One of the constraints of wheat production under marginal areas is the cost<br />
of production relative to yield per unit area, also the quality of wheat produced (especially<br />
under heat stress), so what will be CIMMYT's approach to address such production<br />
constraints?<br />
Answer: Concerted approach: increase in yield via incorporation of stress-adaptive traits and<br />
enhanced N use efficiency while decreasing cost of production via modern crop management<br />
research technologies (co-development). Effect on production per se and improved end-use<br />
quality.<br />
M.A. Mahir: Try to fulfil the great goals of GP5 via simple biotechnology - for example: the<br />
Japanese are experimenting on the possibility of developing a kind of symbiotic relationship<br />
between a rhizobium strain and wheat.<br />
Answer: We have colleagues from biotechnology in the GP5 team. <strong>The</strong>y are involved in the<br />
development of molecular markers for stress-adaptive traits and to monitor other traits<br />
12
CIMMYT's Global Project 5 - Pfeiffer et al.<br />
available which could be used. Biotechnological tools have great potential and are an integral<br />
part of GP5 research activities.<br />
Figure 1. Yield performance ofbread wheat derived<br />
from crosses with Synthetic and Durum "'heat parents<br />
under drought (Yaqui Valley 1998-99).<br />
103<br />
102<br />
I:<br />
C\l<br />
Q)<br />
E<br />
101<br />
(Ụ<br />
.. 100<br />
Q)<br />
> 0<br />
....<br />
0<br />
~<br />
99<br />
a 98<br />
97<br />
Synthetic<br />
Derivatives<br />
Crosses with<br />
Durum<br />
All other<br />
Materials<br />
Table 1.<br />
Characterization of the GP5 target abiotic stress environments.<br />
.. . Moisture stress scenarios<br />
• Terminal<br />
• Pre-Anthesis<br />
• Residual Moisture<br />
• Reduced Irrigation<br />
• General Low Rainfall<br />
• Shallow, Marginal,<br />
Infeliile, Eroded Soils<br />
Temperature extremes ..<br />
• Heat Stress Humid<br />
• Heat Stress Dry<br />
• Cold Stress<br />
• Cold Stress .- Late Frost<br />
Nutrient stress -macro/micro<br />
and pH extremes<br />
• P and N Deficiency/<br />
Efficiency<br />
• Deficiency (e.g. Zinc)<br />
• Toxicity (e.g. Boron)<br />
• Acid Soils Mineral<br />
• Acid Soils Volcanic/Organic<br />
• Alkaline Soils<br />
13
CIMMYT's Global Project 5 - Pfeiffer et at.<br />
6<br />
M<br />
a<br />
x 5<br />
m<br />
u<br />
m<br />
D 4<br />
i<br />
s<br />
t<br />
a<br />
n<br />
c 3<br />
e<br />
B<br />
e<br />
t 2<br />
\&I<br />
e<br />
e<br />
n I<br />
C<br />
J<br />
u 1 j<br />
s<br />
t<br />
e 0<br />
r<br />
s<br />
Figure 2. Dendogram of SAWYT test sites clustered against drought simulated<br />
environments at Cd. Obregon, Sonora, Mexico in 1998-99 and 1999-00.<br />
Figure 3. Genetic Progress in Phosphorus Efficiency in<br />
Bread <strong>Wheat</strong><br />
Year of Release<br />
14
CIMMYT's Global Project 5 - Pfeiffer et al.<br />
Figure 4. Effect of crop residue management and tillage on maize and<br />
wheat yields under rainfed conditions (EI Batan, average 1996-1998).<br />
5500 ~----------------------,<br />
Iii! <strong>Wheat</strong><br />
• Maize<br />
15
SOURCES OF VARIATION FOR GRAIN YIELD PERFORMANCE <br />
OF BREAD WHEAT IN NORTHWESTERN ETHIOPIA <br />
Tadesse Dessalegnl, Bedada Ginna 2 , T.S. Payne 3 , C.S. van Deventer 4 and<br />
M.T. Labuschagne 4<br />
IAdet Research Center, P.O. Box 8, Bahir Dar, Ethiopia<br />
2Kulumsa Research Center (EARO), P.O. Box 489, Kulumsa, Ethiopia<br />
3CIMMYT, P.O. Box 5689, Addis Ababa, Ethiopia<br />
4Plant Breeding Department, UOFS, P.O. Box 339, Bloemfontein 9300, South Africa<br />
ABSTRACT<br />
Precise genotypic yield estimates from data of regional variety trials will<br />
increase the probability of successful selection. Additive main effects and<br />
multiplicative interaction (AMMI) analysis helps to understand sources of<br />
variation, to interpret the genotype by environment (GE) interaction, and to<br />
improve the probability of successful selection. A regional variety trial<br />
conducted in 12 environments was subjected to AMMI analysis to reveal the<br />
sources of grain yield variations and interaction. Environment and genotypes<br />
were highly significant but their interaction was non-significant. <strong>The</strong><br />
environment sum of squares (SS) dominated the analysis even though the<br />
interaction SS was larger than genotypic SS. AMMI partitioned the interaction<br />
SS into six Interaction Principal Component Axes (IPCAs) with two of them<br />
significant; the AMMI biplot described different patterns of interactions. <strong>The</strong><br />
contribution of environment was 86.4%, indicating differences in<br />
environments (i.e., genotype yields ranged from 6205 kglha at Adet to 1643<br />
kg/ha at Injibara, as lnjibara is the lowest potential area for wheat production).<br />
Genotypes contributed 5.7% of the variation and the difference between them<br />
was significant. Genotypes such as HAR1868, HAR18.65 and HAR2096 were<br />
consistently high yielding varieties across environments with mean yields of<br />
4105, 3932 and 3786 kglha, respectively. <strong>The</strong>y had positive interaction with<br />
high yielding locations (Adet, Motta, Fenoteselam and Dabat) indicating their<br />
adaptation to these locations. <strong>The</strong> above locations showed consistency of main<br />
effects and interactions across years (i.e., the environments were suitable to<br />
discriminate this set of genotypes). <strong>The</strong>refore, the result indicated consistency<br />
of ranking of genotypes (i.e., the top yielding in the top four ranks in both<br />
AMMI predicted and observed yields) that facilitates the use of mean yields as<br />
a selection criterion for variety recommendations. As a result, HAR1868<br />
(Shina) was recommended for production in 1998 and HAR2096 was verified<br />
for release in 1999.<br />
INTRODUCTION<br />
Bread wheat (Triticum aestivum L.) is a major crop in Northwestern Ethiopia. Fanners<br />
demand to grow high yielding semi-dwarf bread wheat cultivars, because of better grain yield<br />
potential than many traditional crops. <strong>Wheat</strong> grows in a wide range of areas in the region<br />
differing in altitude, soil type, temperature, rain fall distribution, and the grain yield potential<br />
16
Sources ofvariation for grain yield performance - Tadesse et al.<br />
varies from place to place. Multi-environmental trials play important role in selecting the best<br />
cultivars (or agronomic practices) for different locations and in assessing a cultivar's stability<br />
across environments before it's commercial release (Mateo et at., 1999). Grain yield is the<br />
major criterion for selection in multi-environment testing. Cultivars react differently to<br />
environmental changes and differential responses of cultivars vary from one environment to<br />
another i.e., genotype by environment (GE) interaction. <strong>The</strong> potential of a genotype to be<br />
stable under different environments is important and understanding of the interaction is vital<br />
for selecting superior genotypes.<br />
GE interaction can be a result of genotype rank changes from one environment to another,<br />
difference in scale among environments, or a combination of both (Cornelius et at., 1993).<br />
<strong>The</strong> occurrence or absence of GE interaction in multi-environment testing of genotypes is<br />
important in a plant breeding program. In GE interaction, it is worthwhile distinguishing<br />
between interaction due to heterogeneity of genotypic variances among environments and the<br />
lack of correlations of genotypic perfOlmance among environments, the latter results in reranking<br />
of genotypes across environments (Cooper and DeLacy, 1994). Yield data observed<br />
during multi-location trials can be divided into pattern and noise (Freeman, 1973). <strong>The</strong><br />
observed mean should not be taken as a true mean because of error and noise in the data and<br />
therefore it is important to adjust (Gauch and Zobel, 1988; Zobel et at., 1988) past yields to<br />
predict and improve future yields.<br />
<strong>The</strong> options to improve predictive accuracy of a yield trial include improved experimental<br />
techniques, improved experimental design (more replications or sophisticated layouts of the<br />
replications) or more efficient statistical analysis. Many models have been developed to<br />
describe GE interaction and the additive main effects and multiplicative interaction (AMMI)<br />
model is a widely used statistical analysis of yield trial data. AMMI gives adjusted means,<br />
which have better predictive accuracy and hence greater value for making selection than<br />
unadjusted (observed) means (Gauch and Zobel, 1989). <strong>The</strong> total sum of squares (SS) for<br />
grain yield data can be partitioned into several sources: the genotype main effect, the<br />
environment main effect, and the genotype by environment interaction. By definition, main<br />
effects are additive and interactions (residual from the additive model) are non-additive, and<br />
all the three sources are important (Zobel et at., 1988) .. AMMI uses the usual analysis of<br />
variance (ANOVA) to compute genotype and environmental additive effects and appJies<br />
principal component analysis (PCA) to analyze non-additive interaction effects. Furthermore,<br />
the biplot of AMMI displays both main effects (genotype and environment means) and<br />
interactions (IPeAs) for interpretation of these relationships. Changes in Y-axis and X-axis<br />
on the biplot shows changes in interaction and main effects, respectively. This paper uses<br />
AMMI to analyze the multi-location yield trial conducted in 1997 and 1998 in Northwestern<br />
Ethiopia and examines the GE interaction and identify sources for grain yield variation.<br />
MATERIALS AND METHODS<br />
A regional variety yield trial was conducted in 1997 and 1998 in Northwestern Ethiopia. <strong>The</strong><br />
trial was a full factorial consisting of 20 varieties along with the standard and local checks in<br />
12 environments (two years at six locations). Year by site combinations were taken as an<br />
environment. <strong>The</strong> design was a randomized complete block in four replications with a plot<br />
size of 3 m 2 , i.e., 6 rows at 20 cm spacing and 2.5 m length. Seed rate of 150 kg ha- I and<br />
fertilizer rate of 92/46 kg N/P 2 0 s ha- 1 were used. All other growing practices were as<br />
recommended for all sites. <strong>The</strong> locations were Adet, Motta, Debre Tabor, Dabat, Fenote<br />
Selam and Injibara, Ethiopia separated between 75 to 300 km from the breeding center, Adet,<br />
17
Sources ojvariation Jar grain yield pelformance - Tadesse et al.<br />
and ranging from 1900 to 2650 m a.s.l. <strong>The</strong> soil was drained at all sites. <strong>The</strong> data was<br />
balanced, i.e., experiments at all environments had 20 varieties and four replications. Grain<br />
yield was expressed in kg ha- 1 at 12.5% moisture. AMMI analysis was performed using<br />
Agrobase software (1998). <strong>The</strong> significance of the grain yield data was tested using the F<br />
test. <strong>The</strong> observed and AMMI predicted grain yields were considered for interpretation. <strong>The</strong><br />
genotype by environment interaction was illustrated by means of biplot, i.e., genotype and<br />
site mean on the X-axis and interaction principal components of the genotypes and sites on<br />
Y-axis.<br />
RESULTS AND DISCUSSION<br />
<strong>The</strong> ANOV A suggested environmental diversity and varietal variability in grain yield. <strong>The</strong><br />
observed mean grain yield performance of varieties across environments ranged from 2895 to<br />
4105 kg ha- 1 (Table 1). <strong>The</strong> highest mean yielding variety was HAR1868 followed by<br />
HAR1685 (the standard check) and HAR2096. <strong>The</strong> highest yielding site was Adet (4752 kg<br />
ha- I ) and the least Injibara (2760 kg ha- 1 ) . <strong>The</strong> top ranking varieties produced higher yields<br />
than the overall mean yield at most environments. <strong>The</strong> AMMI analysis of variance indicated<br />
that additive effects of environments and genotypes were significant, but their interaction was<br />
not significant (Table 2). <strong>The</strong> environment sum of squares (SS) dominated the analysis even<br />
though the interaction SS was larger than genotype SS. However, the interaction was more<br />
important and AMMI partitioned the interaction SS into six IPCAs (interaction principal<br />
component analysis) and the F-test indicated that AMMI2 (lPCAl and IPCA2) explained the<br />
GE interaction. Both IPCAs captured 56 % of the interaction SS and 28 % interaction degrees<br />
of freedom (d.f.). <strong>The</strong> large residual d.f. of 153 contained non-significant IPCAs. <strong>The</strong><br />
contribution of each of the sources of variation is presented in Table 3. <strong>The</strong> contribution of<br />
environment (86.4%) was high for yield variation which indicated differences among the<br />
environmen ts.<br />
<strong>The</strong> AMMIl biplot provided further interpretation of the results with different patterns of<br />
interaction displaying both genotype and environment main effects (mean yields) and<br />
interaction (Fig. 1). <strong>The</strong> genotype and environment means are shown on the abscissa and<br />
interaction PCA values on the ordinate representing both .main effects and interactions. <strong>The</strong><br />
biplot captured the genotype SS, environment SS and IPCA 1 SS of the interaction. <strong>The</strong> biplot<br />
revealed 94.4 % of the treatment SS (Treatment = genotype + environment) explaining the<br />
interaction leaving 5.6 % to the residual SS where in most trials the first IPCA is selected as<br />
most predictive. <strong>The</strong>refore, most of the treatment SS were explained by the biplot leaving<br />
5.6% of the residual SS as noise with no interpretable value.<br />
Genotypes and environments having the same sign on the IPCA axis have positive interaction<br />
and negative interaction with the opposite sign. <strong>The</strong> IPCA scores of a genotype in the AMMI<br />
analysis are an indication of the stability of a genotype over environments. <strong>The</strong> greater the<br />
IPCA scores, either negative or positive, as it is a relative value, the more specifically adapted<br />
a genotype is to a certain environment. <strong>The</strong> more the IPCA score is approximate to zero, the<br />
more stable the genotype is over the sampled environments (Purchase, 1997). Environments<br />
showed variability in main effects (mean yields) and interaction (IPCA). Four of the six<br />
environments (Adet, Fenote Selam, Dabat and Motta) in 1997 had above average yield<br />
response and had negative interactions. In 1998, some of the environments performed poorly<br />
and gave below average grain yield and had positive interaction indicating the variability<br />
between years and/or environments. However, the highest yielding environment (Adet in<br />
1997 and 1998) had consistent main effect and repeated interactions. It also had positive<br />
18
Sources ofvariation for grain yield performance - Tadesse et al.<br />
interaction with the highest yielding varieties. Other high yielding sites like Motta, Fenote<br />
Selam and Dabat also interacted well with high yielding varieties even though Dabat and<br />
Motta were variable for either interaction and/or main effects in both years. <strong>The</strong> lowest<br />
yielding sites, Debre Tabor and Injibara had consistent interaction and main effects.<br />
However, the presence of grain yield variation in testing environments did not cause<br />
significant GE interaction.<br />
Many of the genotypes had a similar main effect but with varying negative and positive<br />
interaction (Fig. 1). Genotypes 2, 5, 6, 9 and 20 had positive interaction with genotype 20<br />
having the highest positive IPCA score. Genotypes 3, 12, and 18 had interactions close to<br />
zero indicating their stability of performance. Above average mean yield performance was<br />
scored by genotypes HAR 1868, HAR 2096 and HAR 1685 in both years and they showed<br />
similar interaction with most environments in 1997 and a few in 1998. All three genotypes<br />
were consistently top ranking across environments and achieved good yields in high yielding<br />
sites. <strong>The</strong> AMMI predicted (adjusted) yield and observed mean had little variation in ranking<br />
of varieties where most high yielding varieties fall with in the top four rankings (Table 1).<br />
AMMI selected HAR 1868 as first in eight environments, HAR 1865 as first and second in<br />
seven environments and HAR 2096 as third in overall mean performance. <strong>The</strong> same varieties<br />
were ranked similarly by the observed means. HAR 1868 maintained its ranking both seasons<br />
which indicated the level of GE interaction was low to the responses of the varieties where<br />
the top yielding varieties maintained their superiority across environments under the selected<br />
regional testing sites. As a result, HAR 1868, higher yielding than the standard check (HAR<br />
1685), was released in 1998 and HAR2096 was verified for release in 1999.<br />
CONCLUSIONS<br />
Adet, Fenote Selam, Debre Tabor and Injibara showed consistency in both main effects and<br />
interactions and are suitable environments for selecting for wider adaptability. Injibara had<br />
the highest positive interaction and lowest yield performance indicating the area had the<br />
lowest potential for wheat production. Motta showed differences in main effects in both years<br />
with little change in interaction. <strong>The</strong> most variable site for interaction was Dabat but with<br />
little change in relative ranking of genotypes in both years. Regardless of the yield levels, the<br />
testing environments/sites may be considered effective for selection since most of them<br />
discriminate or rank the varieties similarly, i.e., environments had low or insignificant GE<br />
interaction. <strong>The</strong>refore, low level of GE interaction and the consistency of ranking of varieties<br />
will give an opportunity to exploit the mean yields of varieties as a recommendation criterion<br />
or the best estimate for yield of a genotype is the treatment mean. As a result, the top mean<br />
yielding variety (HAR 1868) had positive interaction with most of the environments and was<br />
verified and approved for release in 1998. <strong>The</strong> other high yielding variety, HAR 2096, was<br />
verified for release in the 1999 cropping season. <strong>The</strong>se varieties are semi-dwarf which<br />
showed great potential for grain yield. <strong>The</strong> breeding program must focus on developing<br />
widely adapted, high yielding semi-dwarf wheats to increase its efficiency by targeting to<br />
potential areas for higher production and productivity. Furthermore, confirmation of<br />
repeatability of low GE interaction with different sets of genotypes and more environments in<br />
the region helps to evaluate, select and make reliable recommendations in the region.<br />
ACKNOWLEDGMENTS<br />
<strong>The</strong> wheat breeding program at Adet annually receives germplasm either as introductions, or<br />
bred and advanced by the national program. <strong>The</strong>se materials are subjected to regional<br />
19
Sources ofvariation for grain yield performance - Tadesse et at.<br />
environments for releasing a variety for the region. <strong>The</strong> Adet wheat program is delighted to<br />
thank the national breeding program for the provision of advanced materials for such use.<br />
Also, we would like to acknowledge the technical and material assistance of CIMMYT/CIDA<br />
EACP and CIMMYTIEU Breeding/Pathology programs.<br />
REFERENCES<br />
Cooper, M. and I.H. DeLacy. 1994.Relationships among analytical methods used to identify genotypic variation<br />
and genotype-by-environment interaction in plant breeding multi-environment experiments. <strong>The</strong>or. Appl.<br />
Genet. 88: 561-572.<br />
Cornelius, P.L., van Sanford, D.A. and M.S. Seyedsadr. 1993. Clustering cultivars in to groups with out rank<br />
change interaction. Crop Sci. 33 : 1193-1200.<br />
Freeman, G.H. 1973 . Statistical methods for the analysis of genotype-environment interactions. Heredity 31:<br />
339-354.<br />
Gauch, H.G. and R.W. Zobel. 1989. Accuracy and selection success in yield trial analysis. <strong>The</strong>or. Appl. Genet.<br />
77: 473-481.<br />
Mateo Y., Crossa, J., van Eeuwijk, F.A., Ramirez, M.E. and K. Sayre. 1999. Using partial least squares<br />
regression, factorial regression, and AMMI models for interpreting genotype by environment interaction.<br />
Crop Sci. 39: 955-967.<br />
Purchase, J.L. 1997. Parametric analysis to describe genotype x environment interaction and yield stability in<br />
winter wheat. Ph.D. thesis, University of the Orange Free State, Bloemfontein.<br />
Zobel, R.W., Wright, and H.G. Gauch. 1988. Statistical analysis of a yield trial. Agron. J. 80: 388-393.<br />
20
1-<br />
Sources ofvariation jor grain yield performance - Tadesse et at.<br />
Table 1. Grain yield (kg ha- 1 ) observed (OM) and AMMI predicted (AMMIZ) of 20 wheat varieties tested at 12 environments in northwestern<br />
Ethiopia.<br />
Environment<br />
# Genotype AD97 AD98 FS97 FS98 M097 M098 DA97 DA98 DT97 DT98 IN97 . IN98 , Mean, IPeA2<br />
1 HAR1868 AMMI2 5019(1) 6205(1) 4799(1 ) 3725(1 ) 5750(1) 2781(3) 5028(1) 3076(4) 2869(1) 3674(4) 3988(1) 2344(5) 4105(1) -6.5<br />
OM 4845(1) 6094(2) 4758(1) 3774(1) 5737(3) 2908(4) 5406(1) 2876(5) 2917(2) 3921(4) 3970(1) 2053(14)<br />
2 HAR1918 AMMI2 3936(12) 5663(5) 4109(10) 3352(4) 5712(2) 2106(20) 4218(18) 2574(16) 2557(8) 4094(1) 3576(8) 2556(2) 3705(7) -22.7<br />
OM 4091(10) 5569(11 ) 4154(9) 3623(2) 5351(8) 1564(20) 4154(16) 2759(12) 2840(3) 4034(2) 3604(6) 2722(1)<br />
3 HAR2096 AMMI2<br />
OM<br />
4 HAR2103 AMMI2<br />
OM<br />
4332(6)<br />
4089(11)<br />
3856(15)<br />
3784(15)<br />
5756(4)<br />
6155(1)<br />
5506(11 )<br />
5580(8)<br />
4322(6<br />
4324(5)<br />
4078(12)<br />
3918(17)<br />
3384(3)<br />
3520(3)<br />
3266(6)<br />
3244(8)<br />
5331(3)<br />
5317(9)<br />
5505(4)<br />
5502(4)<br />
2426(7)<br />
3092(1)<br />
2396(8)<br />
2653(Zl<br />
4548(6)<br />
4204(141<br />
4345(11)<br />
4391(10)<br />
2805(9)<br />
2798(8)<br />
2863(7)<br />
2816(6)<br />
2638(6)<br />
2271(16)<br />
2695(4)<br />
2719(6)<br />
3683(3)<br />
4018(3)<br />
3894(2)<br />
4163(1 )<br />
-=<br />
3668(3)<br />
3686(3)<br />
3603(5)<br />
3593(7)<br />
2345(4)<br />
1964(15)<br />
2616(1)<br />
2260(6)<br />
3786(3) -10.3<br />
3719(5) -11.1<br />
5 HAR 1875 AMMI2 3848(16) 5232(14) 3868(15) 2901(15) 4982(14) 2151(18) 4182(19) 2531(18) 2280(18) 3140(14) 3248(15) 1914(13) 3359(15) -3.9<br />
OM 3682(18) 5473(13) 4229(6) 2629(17) 5066(12) 1961(17) 4085(17) 2776(11) 2130(20) 2968(13) 3267(15) 2076(12)<br />
6 HARI781 AMMI2 3756(18) 5256(13) 3909(13) 3006(13) 5124(11) 2349(10) 4265(15) 2778(10) 2509(9) 3411(5) 3395(13) 2278(6) 3503(14) -2.9<br />
OM 3699(17) 5175(16) 4083(10) 2689(16) 5357(7) 2415(10) 4381(11) 2753(13) 2435(10) 3438(6) 3378(14) 2235(7)<br />
7 HAR2025 AMMI2 4143(10) 5529(10) 4082(11) 3124(10) 5263(8) 2111(19) 4285(13) 2474(20) 2321(14) 3366(7) 3386(14) 1992(11) 3506(13) -11.3<br />
OM 3992(12) 5741(4) 4080(11 ) 3302(6) 5285(11) 1896(19} 4192(15) 2690(16) 2321(14) 3121(9) 3398(13) 2056(13)<br />
8 HAR2524 AMMI2 4670(4) 5852(2) 4420(4) 3349(5) 5389(5) 2331 (13) 4620(5) 2620(15) 2440(11) 3293(9) 3588(6) 1914(15) 3707(6) -8.5<br />
OM 4843(2) 5577(10) 3933(16) 3151(11) 5940(1) 2631(8) 5138(3) 2191(20) 2264(17) 3112(11) 3543(8) 2166(18)<br />
9 HAR2530 AMMI2 3651(19) 5143(16) 3901(14) 2984(14) 5025(13) 2662(5) 4400(9) 3111(3) 2716(3) 3379(6) 3480(9) 2466(3) 3576(10) 6.6<br />
OM 3552(19) 5438(12) 3946(15) 2585( 18) 4841(13) 2927(3) 4558(7) 3040(3) 2465(8) 3724(5) 3481(9) 2360(3)<br />
10 HAR2534 AMMI2 3967(11 ) 5146(15) 3863(16) 2774(18) 4710(17) 2221(16) 4258(16) 2541(17) 2188(20) 2712(18) 3162(18) 1643(20) 3265(18) 4.6<br />
OM 3878(14) 5339(14) 3846(18) 2584(19) 4600(16) 1952(18) 441~ 2663(17) 2447(9) 2817(17) 3158(18) 1484(20)<br />
11 HAR2536 AMMI2 3894(13) 5100(18) 3852(18) 2776(17) 4698(18) 2344(11) 4300(12) 2683(12) 2288(17) 2753(16) 3206(17) 1766(17) 3305(17) 7.6<br />
OM 3990(13) 4838(18) 4061(12) 2775(15) 4451(17) 2226(15) 4374(12) 2810(7) 2228(18) 3118(10) 3191((6) 1598(18)<br />
12 HAR2165 AMMI2 3881(14) 5131(17) 3856(17) 2806(16) 4767(16) 2301(15) 4273(14) 2651(14) 2290(16) 2849(15) 3218(16) 1812(16) 3320( 16) 4.9<br />
OM 4169(9) 4705(19) 4212(7) 3303(5) 4339(19) 2340(11) 3715(20) 2796(9) 2175(19) 3073(12) 3189(17) 1819(16)<br />
13 HAR2195 AMMI2 4181(9) 5450(12) 4135(9) 3099(12) 5096(12) 2470(6) 4499(7) 2817(8) 2505(10) 3169(12) 3472(10) 2050(10) 3579(9) 1.2<br />
OM 4556(5) 5578(9) 3965(14) 2818(14) 4794(14) 2258(12) 4425(8) 2725(14) 2733(5) 3182(7) 3473(11) 2407(2)<br />
14 HAR2258 AMMI2 4313(8) 5542(9) 4190(7) 3134(9) 5140(10) 2376(9) 4498(8) 2700(11) 2430(12) 3145(13) 3462(11) 1940(14) 3573(11 ) -1.9<br />
15 Dashen<br />
OM<br />
AMMI2<br />
4180(8)<br />
4405(5)<br />
5211(15)<br />
5597(7)<br />
4551(2)<br />
4323(5)<br />
3232(9)<br />
3240(7)<br />
5428(5)<br />
5176(9)<br />
2241(13)<br />
2718(4)<br />
4629(5)<br />
4732(4)<br />
2668(16)<br />
3046(5)<br />
2302(15)<br />
2683(5)<br />
2859(15)<br />
3197(10)<br />
3439(12)<br />
3640(4)<br />
(bucxpun) OM 4421(7) 5585(7) 4165(8) 3382(4) 5386(6) 2700(6) 4563(6) 3004(4) 2993(1) 2956(14) 3644(4) 2109(11 )<br />
2130(9)<br />
2149(9) 3742(4) 5.3<br />
16 HAR2018 AMMI2 4780(2) 5569(8) 4441(3) 31\9(11) 4779(15) 2940(2) 4990(3) 3147(2) 2599(7) 2484(20) 3585(7) 1663(19) 3675(8) 20.7<br />
OM 4695(4) 5918(3) 4368(4) 3281 (7) 4627(20) 2755(5) 4962(4) 3416(1) 2553(7) 2752(18) 3628(5) 1504(19)<br />
21
Sources ofvariation for grain yield performance - Tadesse et al.<br />
Table 1. Continued.<br />
17<br />
18<br />
19<br />
20<br />
HAR2527 AMM12<br />
OM<br />
HARI709 AMMI2<br />
(st.ch I) OM<br />
HAR1685 AMMI2<br />
(st.ch2) OM<br />
ET-13A2 AMMI2<br />
JL. chec10 OM<br />
Mean<br />
[peA2<br />
4314(7)<br />
4518(6)<br />
3777(17)<br />
3719(16)<br />
4749(3)<br />
4739(3)<br />
2448(20)<br />
2479(20)<br />
4096<br />
-1.3<br />
5622(6)<br />
5626(6)<br />
4981(19)<br />
4971(17)<br />
5815(3)<br />
5704(5)<br />
4078(20)<br />
3932(20)<br />
5409<br />
-11.5<br />
4185(8)<br />
4002(13)<br />
3775(19)<br />
3826(19)<br />
4578(2)<br />
4546(3)<br />
2988(20)<br />
2991(20)<br />
4083<br />
-0.9<br />
3182(8)<br />
3166(10)<br />
2675(19)<br />
3002(13)<br />
3421 (2)<br />
3088(12)<br />
2135(20)<br />
2304(20)<br />
3073<br />
-7.6<br />
5281(6)<br />
5306(10)<br />
4582(19)<br />
4646(15)<br />
5276(7)<br />
5898(2)<br />
4128(20)<br />
4404(18)<br />
5096<br />
-19.3<br />
2180(17)<br />
2092(16)<br />
2313(14)<br />
2616(9)<br />
2978(1 )<br />
3011(2)<br />
2342(12)<br />
2229(14)<br />
2425<br />
22.8<br />
4391(10)<br />
4268(13)<br />
4232(17)<br />
3830(19)<br />
5018(2)<br />
5138(2)<br />
3715(20)<br />
3971(18)<br />
4440<br />
11.8<br />
2515(19)<br />
2548(18)<br />
2657(13)<br />
2412(19)<br />
3266(1)<br />
3209(2)<br />
2878(6)<br />
2783(10)<br />
2787<br />
21.3<br />
2347(13)<br />
2406(11)<br />
2235(19)<br />
2396(12)<br />
2855(2)<br />
2815(4)<br />
2306(15)<br />
233~(13)<br />
2487<br />
3170(8)<br />
2650(19)<br />
2410(20)<br />
3193(11)<br />
2844(16)<br />
2731(17)<br />
2448(19)<br />
3206<br />
-22.8<br />
8.5<br />
-<br />
3310(8)<br />
3440(12)<br />
3476(10)<br />
3128(19)<br />
3121(19)<br />
3832(2)<br />
3838(2)<br />
2817(20)<br />
2819(20~<br />
3445<br />
I.l<br />
1942(12)<br />
2129(10)<br />
1709(18)<br />
1745(17)<br />
2197(7)<br />
2349(4)<br />
2172(8)<br />
2340(5)<br />
2075<br />
-2.4<br />
3559(i2)<br />
3224(19)<br />
3932(2)<br />
2895(20)<br />
AMMI2 = AMMI2 predicted mean yield; OM = observed mean yield; ( ) = numbers in parenthesis are ranks; IPCA2 = interaction principal component axis 2;<br />
Environments are indicated by location codes followed by year. E.g. AD97 = location Adet in 1997; DT = Debre Tabor; FS = Fenote Selam; DA = Dabat;<br />
MO = Motta; IN = Injibara.<br />
22 <br />
-9.9<br />
9.6<br />
9.3<br />
19.4<br />
-<br />
-
Sources ofvariation for grain yield performance - Tadesse et al.<br />
Table 2.<br />
AMMI2 analysis of variance for grain yield.<br />
Source<br />
d.f.<br />
Sum of Squares<br />
Mean· Square<br />
F-value<br />
Total<br />
959<br />
1509825707.5<br />
Environments<br />
11<br />
1018222644.2<br />
92565694.9 75.27***<br />
Rep within environments<br />
36<br />
44269979.7<br />
1229721.7<br />
Genotype<br />
19<br />
67755892.9<br />
3566099.6 8.03***<br />
Genotype x environment<br />
209<br />
92787046.3<br />
443957.2 1.06 NS<br />
IPCAI<br />
29<br />
27355096.0<br />
943279.2 2.25***<br />
IPCA2<br />
27<br />
20639342.8<br />
764420.1 1.82*"<br />
IPCA residual<br />
153<br />
44792607.5<br />
292762.1<br />
Residual<br />
684 286790144.4<br />
NS = non-significant; *** = significant at P 0.001.<br />
419283.8<br />
Table 3.<br />
Contribution of each source for grain yield variation.<br />
Sources of variation ' Contribution (%)<br />
Environment 86.5<br />
Genotype 5.7<br />
Environment by genotype 7.8<br />
23
Sources ofvariation for grain yield performance - Tadesse et at.<br />
Figure 1. AMMI biplot of means (kg ha- 1 ) and IPCA score for 20 genotypes and 12<br />
environments.<br />
36<br />
,<br />
32 . '20<br />
28<br />
1 .1N98<br />
j n ~ ,;-;-<br />
24<br />
i DT98<br />
20 .... <br />
,<br />
16 9.<br />
,<br />
12 - ·4<br />
uT9i<br />
....L<br />
-=-'<br />
.DA98<br />
8 •<br />
6·<br />
4<br />
M097<br />
..- 1-1VIOB13<br />
+5 i id7<br />
« • ..<br />
(.) 0<br />
9:<br />
-,.<br />
- ...:.- ..
GERMPLASM ENHANCEMENT <br />
THROUGH WIDE HYBRIDIZATION AND MOLECULAR BREEDING <br />
Harjit Singh'.2, H.S. Dhaliwaf and Yifru Teklu'<br />
I Alemaya University of Agriculture, P.O. Box 219, Alemaya, Ethiopia<br />
2Department of Biotechnology, Punjab Agricultural University, Ludhiana-141004, India<br />
ABSTRACT<br />
Wild relatives of wheat are a rich source of novel variability for disease<br />
resistance, quality and other traits of economic importance. Evaluation and<br />
cataloguing of 1,000 accessions of wild Triticum and Aegilops species<br />
identified a number of new sources of resistance to leaf rust, stripe rust,<br />
powdery mildew, loose smut, leaf spots and cereal cyst nematode. Study of<br />
high molecular weight (HMW) glutenin subunit composition by SDS-P AOE<br />
revealed large intra-specific diversity in the wild species and identified novel .<br />
A.'( and Ay subunits at the Glu Al locus. Interspecific crossing of resistant<br />
accessions of three wild Triticum species with susceptible Triticum durum<br />
(AABB) lines, followed by back-crossing to the cultivated species, resulted in<br />
the transfer of: leaf rust resistance from six diverse accessions of T<br />
araraticum (AAOO); stripe rust resistance from one accession of T urartu<br />
(AUAU), two accessions of T araraticum and one accession of T dicoccoides<br />
(AABB); and powdery mildew resistance from two accessions of T<br />
araraticum. Transfer of novel Ax and Ay subunits from T urartu, T<br />
boeoticum (AbA b ), T dicoccoides and T araraticum resulted in significant<br />
increase in gluten strength indicated by increases in SDS sedimentation value<br />
from 37-40 for T durum to 48-75 for the derivatives. Non-progenitor Aegilops<br />
species with C, U and M genomes have been found to be excellent sources of<br />
resistance to leaf rust and stripe rust. Rust resistant interspecific derivatives<br />
carrying alien chromosome substitution/addition or translations from Ae. ovata<br />
(UUMM) and Ae. triuncialis (UUCC) have been identified using C-banding<br />
and genomic in-situ hybridization techniques. Studies showed that the<br />
inhibitor of the Ph locus (Phi) from Aegilops speltoides, now available in the<br />
background of T aestivum cv. Chinese Spring, is useful to induce<br />
homoeologous pairing of alien chromosomes with wheat chromosomes in<br />
interspecific crosses. Induced homologous pairing coupled with C-banding<br />
and genomic in-situ hybridization are useful to transfer small alien segments<br />
carrying desirable genes and thus reduce linkage drag. A molecular linkage<br />
map has been constructed for the diploid cultivated species T monococcum <br />
a good source of resistance to diseases and pests and possessing resistance to<br />
herbicides. Molecular markers linked to protein content and seed size have<br />
also been identified. Also, in a pre-breeding program to improve two spring<br />
wheat cultivars, novel genes for disease resistance, high protein content, bread<br />
making quality and other agronomically important traits have been transferred<br />
from various genetic stocks. <strong>The</strong> improved durum and bread wheat materials,<br />
particularly those with rust resistance and processing quality, seem to have<br />
great potential for deployment in East Africa including Ethiopia.<br />
25
Germplasm enhancement through molecular breeding - Harjit Singh et at.<br />
INTRODUCTION<br />
Wild relatives of wheat provide a rich reservoir of genes for desirable traits (Shanna and Gill,<br />
1983; Jiang et al., 1994; Friebe et al., 1994). A number of genes for disease resistance,<br />
quality and other traits of economic importance have been transferred from both close as well<br />
as distantly related species. Evaluation of different accessions of wild Triticum and Aegi/ops<br />
species (1000 accessions), both under natural and artificial conditions at the Punjab<br />
Agricultural University, identified a number of new sources of resistance to leaf rust, stripe<br />
rust, powdery mildew, loose smut, Kamal bunt, leaf spots and cereal cyst nematode.<br />
(Dhaliwal et ai., 1993; Pannu et ai., 1994; Dhaliwal and Harjit-Singh, 1997; Harjit-Singh et<br />
ai., 1998). It was found that Ae. speitoides (S) and T. boeoticum (Ab),are good sources of<br />
resistance to leaf rust (Puccinia recondita f.sp. tritici) and stripe rust (Puccinia striiformis).<br />
Among relatively less closely related species, diploid Aegi/ops species with C, U and M<br />
genomes and polyploid species carrying combinations of these genomes are excellent sources<br />
of resistance to these two rusts (Dhaliwal et ai., 1991, 1993; Harjit-Singh and Dhaliwal,<br />
2000). Cataloguing of variability for resistance to leaf rust and stripe rust among accessions<br />
of wild Triticum and Aegilops species with individual isolates of rust revealed a large<br />
intraspecific diversity within these species (Harjit-Singh and Dhaliwal, 2000). <strong>The</strong>, study<br />
identified 45 accessions, majority of which belonged to Ae. speitoides (S), T. boeoticum (A b )<br />
and Ae. triuncialis (DC), that maintained their resistance to the two rusts over years (1984 to<br />
1998) and locations, thereby further supporting usefulness of these species as the sources of<br />
rust resistance (Harjit-Singh et ai., 1998) .<strong>The</strong> screening of gennplasm for resistance to<br />
powdery mildew (Erysiphe graminis f.sp. tritici) under natural epiphytotic conditions and in<br />
the laboratory conditions, by inoculation of seedling and detached leaves using two isolates<br />
of known virulence, identified 25 sources of resistance among two wild Triticum (T.<br />
araraticum and T. boeoticum) and two Aegilops (Ae. speitoides and Ae. squarrosa) species<br />
(Gill et ai., 1995). Evaluation of wild Triticum and Aegiiops species for loose smut resistance<br />
under artificial conditions indicated that T boeoticum, T. dicoccoides, T. araraticum and Ae.<br />
cyiindrica are good sources of resistance (Grewal et ai., 1997). Screening of four wild<br />
Triticum and 14 Aegilops species for resistance to Punjab population of cereal cyst nematode,<br />
Heterodera avenae, under artificial conditions, suggested that Aegilops species with C and U<br />
genome are good sources ofresistance to this pest (Singh et ai., 1991; Gill et ai., 1995). Also,<br />
a large variability for High molecular weight (HMW) glutenin submit composition, a<br />
character associated with bread making quality, has been observed in wild Triticum and<br />
Aegilops species (Randhawa et ai., 1995, 1997). Keeping this in view a program was initiated<br />
to transfer genes for disease resistance and novel HMW glutenin subunits from the alien<br />
identified sources.<br />
Nine wild species (Table 1) were used as donors for transfer of desirable traits which included<br />
leaf rust, powdery mildew, Kamal bunt and cereal cyst nematode resistance, and novel HMW<br />
glutenin subunits. Susceptible T. durum lines were used as recipient cultivated parent to<br />
transfer leaf rust, stripe rust and powdery mildew resistance from wild Triticum species. An<br />
agronomically superior but susceptible bread wheat cultivar, WL 711, was crossed to one<br />
resistant accession each ofAe. ovata (UM) and Ae. triuncialis (UC) to transfer leaf rust, stripe<br />
rust, powdery mildew, Kamal bunt and cereal cyst nematode resistance by backcross method<br />
(Harjit Singh et al., 1993). To transfer disease resistance genes from two non progenitor<br />
diploid Aegilops species, Ae. candata (C) and Ae. umbelluiata (U), T. durum (susceptible) -<br />
Aegilops species ampliiploids were developed. <strong>The</strong>se amphiploids were crossed with<br />
susceptible T. aestivum to transfer the genes to hexaploid background. Data on chromosome<br />
26
Germplasm enhancement through molecular breeding - Harjit Singh et al.<br />
number and meiotic chromosome pairing was recorded in the F I and subsequent backcross<br />
and selfed progenies. <strong>The</strong> addition, substitution or translocation of the alien chromosome(s)<br />
or chromosome partes) were investigated through Giemsa C-banding (Friebe et al., 1992) and<br />
genomic in-situ hybridization (Mukari and Gill, 1991). A T aestivum cv. Chinese Spring line<br />
possessing Phi (Ph suppressor) gene from Ae. speltoides was crossed with Secale cereale,<br />
Aegi/ops ventricosa and amphiploids of T durum-Ae caudata and T durum-Ae. umbellulata<br />
to study the usefulness of Phi gene in inducing homoeologous pairing between the<br />
chromosomes of the alien and the cultivated species. Amphiploids of T durum-squarrosa<br />
were crossed to susceptible T aestivum cv. Veery to transfer leaf rust and Kamal bunt<br />
resistance from one accession each ofAe. squarrosa. Backcrossing was used to transfer novel<br />
HMW glutenin subunits from four wild Triticum species into T durum cv. PBW 34.<br />
Successful transfer of desired variability has been achieved in many interspecific crosses<br />
(Table 1). In others, the material is in advance generations. Leaf rust resistance has been<br />
transferred from six diverse accessions of T araraticum into rust susceptible T durum lines.<br />
Fully fertile resistance plants with 14 bivalents were selected in BC2IBC2F2 generation to<br />
produce backcross derivatives with the desired resistance. Similarly, stripe rust resistance and<br />
powdery mildew resistance has been transferred from two accessions each of T araraticum.<br />
Fertile stripe rust resistance derivatives have been developed from the cross of susceptible T<br />
durum cv. Bijaga Yellow with T dicoccoides Acc. 4656. Stripe rust resistance has also been<br />
transferred from another accession (4637) of T dicoccoides into T aestivum cv. Hybrid 65 . A<br />
derivative carrying stripe rust resistance from T urartu in susceptible T durum has also been<br />
developed. Leaf rust resistance segregants have been selected from the cross of the<br />
susceptible T aestivum parent with T. durum-Ae. squarrosa (Acc 3743) amphiploids (Table<br />
1). A similar cross involving Ae. squarrosa Acc 3806 is being used to transfer Kamal bunt<br />
resistance from this progenitor species.<br />
Alien substitution/addition lines carrying resistance to one or more of leaf rust, stripe rust,<br />
powdery mildew, Kamal bunt and/or cereal cyst nematode from Ae. triuncialis and Ae. ovata<br />
in the background of susceptible T. aestivum cv. WL 711 have been developed. One group of<br />
derivatives with 42 chromosomes, spe1ta-type head and resistance to cereal cyst nematode<br />
and powdery mildew in addition to moderate resistance. to leaf rust were recovered from<br />
crosses with Ae. triuncialis. Giemsa C banding of mitotic metaphase chromosomes showed<br />
that these derivatives possess a substitution of 5U chromosome of Ae. triuncialis for 5A of<br />
bread wheat (Harjit-Singh et aI., 2000). Another set of interspecific derivatives with disomic<br />
addition of an acrocentric Ae. triuncialis chromosome possessed leaf rust, Kamal bunt and<br />
powdery mildew resistance. Genomic in-situ hybridization showed that this set of derivatives<br />
also possesses a pair of translocated chromosomes involving break point in the centromere<br />
and short arm of Ae. triuncialis chromosome (Harjit-Singh et al., 2000). In some of the rust<br />
resistant backcross derivatives from Ae. triuncialis, no alien chromatin could be detected with<br />
C-banding and GISH studies. However, molecular cytogenetic characterization of these<br />
derivatives indicated that an alien segment carrying leaf rust resistance gene(s) from Ae.<br />
triuncialis has been transferred to wheat and a STMS (sequence tagged microsatellite) marker<br />
(gwm 368) allele on 4BS specific to Ae. triuncialis is tightly linked to it (Aghaee-Sarbarzeh,<br />
Harjit-Singh and Dhaliwal, unpublished data). Similarly, backcross derivatives carrying one<br />
or more of the leaf rust, stripe rust and powdery mildew resistance from Ae. ovata have been<br />
developed. <strong>The</strong> C-banding study showed a substitution of 5 M chromosome of Ae. ovata for<br />
5D of wheat in a uniformly leaf rust and stripe rust resistant derivative. Study of selected<br />
interspecific derivatives with mapped microsatellite markers confirmed the substitution of<br />
5M with 5D (Dhaliwal, Harjit-Singh and Williams, unpublished data). This study also<br />
27
Germplasm enhancement through moiecular breeding - Harjit Singh et al.<br />
showed that these derivatives possess at least 3 alien translocations, one each to 1BL, 2AL<br />
and 5BS. A translocation involving 5DS of wheat and the substituted chromosome 5M ofAe.<br />
ovata was also observed and the susceptibility of this derivative indicated that the leaf rust<br />
resistance gene(s) are located on 5MS. <strong>The</strong> study also indicated the presence of rust<br />
resistance genes on the alien segment translocated to 5BS.<br />
A T. aestivum cv. Chinese Spring line possessing Ph' (Ph suppressor) gene from Ae.<br />
speltoides was crossed with Secale cereale (R ) and Aegi/ops ventricosa (DU) to determine<br />
the extent of homoeologous pairing induced by the Ph' gene so that small segments carrying<br />
useful genes on the alien chromosomes (particularly from the less related species like C, U<br />
and M genome species) could be transferred to the chromosomes of the cultivated species<br />
through genetic recombination. An increase in homoeologous paring between the<br />
chromosomes of the alien and the cultivated species in the two crosses (Aghaee-Sarbarzeh et<br />
al., 2000) was observed. <strong>The</strong> same was true in crosses of the T. aestivum line carrying Ph'<br />
with the amphiploids ofAe. caudata as well as Ae. umbellulata. This suggested that the Ph'<br />
gene from Ae. speltoides is useful to transfer small alien segments through genetic<br />
recombination. <strong>The</strong> availability of this system in T. aestivum would allow the exploitation of<br />
this system for reducing the linkage drag during the transfer ofalien genes.<br />
Most of the T. durum lines do not possess HMW glutenin subunits at the GluAl locus<br />
whereas T. aestivum lines have a null allele or alleles expressing only x subunit. Fertile<br />
backcross progenies carrying both Ax and Ay subunits from T. urartu (AU), T. boeoticum<br />
(A b ), T. dicoccoides (AB) and T. araraticum (AG) have been obtained. Sodium dodecyl<br />
sulphate (SDS) sedimentation test has demonstrated the superiority of T. durum derivatives<br />
carrying the novel HMW glutenin subunits (Table 2). <strong>The</strong> derivatives canying both Ax and<br />
Ay subunits from the progenitor wild Triticum species had SDS sedimentation value of 54.0<br />
to 75.0 against 38.0 of T. durum parent. Though the interspecific derivatives possessing oniy<br />
Ax sub unit from the wild parent had lower SDS sedimentation value than those possessing<br />
both Ax and Ay subunits, the increase in sedimentation value over the cultivated recurrent<br />
parent was still significant. Transfer of novel HMW glutenin subunits from the progenitor<br />
species may make the T. durum suitable for bread making and also provide new variability<br />
for improving bread making quality of T. aestivum.<br />
COMMERCIAL UTILIZATION OF ALIEN VARIABILITY<br />
Although wild relatives of wheat provide a rich reservoir of genes for resistance and a<br />
number of genes for resistance have been transferred from both close as well as distantly<br />
related species, a number of transferred genes have yet not been used in commercial cultivars.<br />
It is, because, the majority of translocations involve the substitution of a segment of alien<br />
chromatin for a terminal segment ofwheat chromatin (Friebe et al., 1996). Deleterious effects<br />
may arise either because of the loss of desirable wheat genes or more probably, from the<br />
effects of deleterious genes linked to the desirable alien gene. Induction of homoeologous<br />
pairing and molecular tagging of the desirable alien genes is helpful in reducing the linkage<br />
drag by retaining the desirable derivatives with closely linked markers (Dundas and<br />
Shepherd, 1996). Since smaller the alien segment lower the chances of transfer of associated<br />
deleterious genes, the monitoring of alien segment through in-situ hybridization (using<br />
species specific probes) and selection of segregants with smaller alien segment (Castilho et<br />
al., 1996) shall be useful in this regard. <strong>The</strong>refore, disease resistant addition/substitution lines<br />
of Ae. ovata (UM) and Ae. triuncialis (UC) in the background of T. aestivum cv. WL711 as<br />
well as T. durum-Ae caudata and T. durum-Ae umbellulata amphiploids were crossed with<br />
28
Germplasm enhancement through molecular breeding - Harjit Singh et al.<br />
the Chinese Spring line carrying Ph suppressor system (from Aegilops speltoides) to induce<br />
homoeologous pairing and reduce the linkage drag through GISH and molecular marker<br />
aided selection. F 1's of the crosses of two substitution lines, 5U of Ae triuncialis for 5A of T<br />
aestivum cv. WL 711 ,and 5M of Ae ovata for 5D of WL711 carrying genes for rust resistance,<br />
with Chinese Spring carrying Ph!, were backcrossed to WL 711. Rust resistant backcross<br />
derivatives were characterized with a set of sequence tag microsatellite (STMS) markers of<br />
wheat. <strong>The</strong> study showed that rust resistance gene(s) from both the alien substituted<br />
chromosomes were transferred to wheat with reduced alien chromatin (Aghaee-Sarbarzeh,<br />
Harjit-Singh and Dhaliwal, unpublished data). Similarly, induced transfer of rust resistance<br />
genes from Ae. caudata and Ae. umbellulata into wheat by crossing of T durum-Aegilops<br />
species amphiploids with Chinese Spring (Ph!) and characterization of derivatives using<br />
microsatellites has shown that in some of the derivatives chromosomal exchanges between<br />
the alien chromosomes and their homoeologous wheat chromosomes carrying gene(s) for<br />
resistance has taken place (Aghaee-Sarbarzeh, Harjit-Singh and Dhaliwal, unpublished data).<br />
Also, efforts are being made to tag the alien disease resistance genes with molecular markers<br />
in various other interspecific derivatives developed through wide hybridization. Molecular<br />
linkage map of the diploid donor species, T monococcum, has been constructed (Pal et al.,<br />
1997) and work is in progress to saturate the molecular linkage map as well as to identify<br />
molecular markers for leaf rust, stripe rust, Kamal bunt, the cereal cyst nematode and<br />
weedicide resistance genes. .<br />
GERMPLASM ENHANCEMENT USING GENETIC STOCKS<br />
In a pre-breeding program to improve the agronomically superior spring wheat cultivars<br />
WL711 and HD2329, a number of genes for resistance to leaf rust, quality characters and<br />
other desirable traits have been transferred from various genetic stocks (Table 3). It may be<br />
desirable to test the improved rust resistant bread wheat lines carrying rust resistant genes<br />
which have yet not been tried in East Africa. Similarly, the novel variability for other traits<br />
available in the background of cultivars WL 711 and HD2329 could be utilized in bread wheat<br />
improvement programs of Africa.<br />
MOLECULAR TAGGING OF GENES OF ECONOMIC IMPORTANCE<br />
Since the heritability of many traits of economic importance is low, their improvement<br />
through direct selection becomes tedious. In such cases, identification of molecular markers<br />
linked to genes governing these traits facilitates selection for these traits through marker<br />
aided selection (MAS). Keeping this in view, populations were developed to find molecular<br />
markers for grain protein content, pre-harvest sprouting tolerance and seed size in bread<br />
wheat. Screening of contrasting parents and recombinant inbred lines (RILs) developed from<br />
crosses between them with various molecular markers (Table 4), resulted in identification of<br />
markers linked with these traits.<br />
TESTING OF IMPROVED GERMPLASM IN EAST AFRICAN COUNTRIES<br />
Rust diseases are one of the major constraints in wheat production in East African countries<br />
including Ethiopia. Like other air-borne pathogens, new pathotypes of these rusts, virulent on<br />
already deployed resistance genes, evolve thereby reducing the useful life of newly bred<br />
cultivars. In Ethiopia, two recently developed durum wheat cultivars with high yield potential<br />
succumbed to stripe rust. <strong>The</strong>refore, it becomes necessary to introduce novel rust resistance<br />
genes that can provide long term resistance. <strong>The</strong> evaluation of improved stocks with<br />
29
Gennplasm enhancement through molecular breeding - Harjit Singh et al.<br />
resistance genes from the wild relatives as well as other genetic stocks in both T. durum and<br />
T aestivum backgrounds will be desirable. <strong>The</strong> improved resistant lines are available for<br />
evaluation in respective wheat growing areas. Similarly, T durum derivatives with high SDS<br />
sedimentation value (and thus higher gluten strength) could be utilized for improving the<br />
African cultivars for'durum products, such as pasta. <strong>The</strong> evaluation of these lines for direct<br />
introduction could provide cultivars with high quality of durum products.<br />
REFERENCES<br />
Aghaee-Sarbarzeh, M., Harjit-Singh, and H.S. Dhaliwal. 2000. PhI gene derived from Aegilop speltoides<br />
induces homoeologous chromosome paring in wide crosses of Triticum aestivum. J Hered (in the<br />
press).<br />
Castilho, A., Miller, T.E. and J.S. Helop-Harrison. 1996. Physical mapping of translocation breakpoint in a set<br />
ofwheat-Aegilops umbellulata recombinant lines using in situ hybridization. <strong>The</strong>or Appl Genet 93:<br />
816-25.<br />
Dhaliwal, H.S., Harjit-Singh, Gupta, S.K., Bagga, P.S. and K.S. Gill. 1991. Evaluation ofAegilops and wild<br />
Triticum species for resistance to leaf rust (Puccinia reconditafsp. tritici) of wheat. Intern J Trop<br />
Agric 9: 118-22.<br />
Dhaliwal, H.S., Harjit-Singh, Gill, K.S. and H.S. Randhawa. 1993. Evaluation and cataloguing of wheat genetic<br />
resource for resistance and quality. pp. 123-40. In: Biodiversity and <strong>Wheat</strong> improvement Dhamamia,<br />
A.B. (ed.). John Wiley & Sons, Chichester, U.K. .<br />
Dundas, I.S. and K.W. Shepherd. 1996. Towards yield improvement of wheat with stem rust resistance gene Sr<br />
26 by cytogenetical methods using molecular-based marker selection. In: Second Int. Crop. Sci.<br />
Congr., November 1996, New Delhi.<br />
Friebe, B., Jiang, J., Raupp, WJ., McIntosh, R.A. and B.S. Gill. 1996. Characterization of wheat alien<br />
translocations conferring resistance to diseases and pests: Current status. Euphytica, 91: 59-87.<br />
Gill, K.S., Dhaliwal, H.S. and Harjit-Singh. 1995. Cataloguing and pre-breeding ofwheat genetic resources:<br />
terminal report of US IF Project. Biotechnology Center, Punjab Agriculture University, Ludhiana. 141<br />
pp.<br />
Grewal, A.S., Naanda, G.S. Harjit -Singh and H.S. Dhaliwal. 1997. Alien sources ofloose smut resistance in<br />
wheat. In: Int. Conf. On Integrated Disease Management for Sustainable Agriculture, Nov. 1997, New<br />
Delhi. p. 393.<br />
Harjit-Singh, Dhaliwal, H.S., Kaur, J. and K.S. Gill. 1993 . Rust resistance and chromosome paring in Triticum x<br />
Aegi/ops crosses. <strong>Wheat</strong> InfServ.76: 23-26.<br />
Harjit -Singh, Grewal, T.S., Dhaliwal, H.S., Panu, P.P.S. and P.S. Bagga. 1998. Sources ofleafrust and stripe<br />
rust resistance in wild relatives of wheat. Crop Improvement. 25 (1): 26-33.<br />
Harjit-Singh, and H.S. Dhaliwal. 2000. Intraspecific genetic diversity for resistance to wheat rusts in wild<br />
Triticum and Aegilops species. <strong>Wheat</strong> Inf Servo 90 (in the press).<br />
Harjit-Singh, Tsujimoto, H., Sakhuja, P.K., Singh, T. and H.S. Dhaliwal. 2000. Transfer of resistance to wheat<br />
pathogens from Aegi/ops triuncialis into bread wheat. <strong>Wheat</strong> InfServo 91 (in the press).<br />
Jiang, J., Friebe, B. and B.S. Gill. 1994. Recent advances in alien gene transfer in wheat. Euphytica, 73: 199<br />
211.<br />
Pal, N., Sidhu, 1.S., Harjit- Singh, Singh, S. and H.S. Dhaliwal. 1998. Construction of molecular linkage map in<br />
Triticum monococcum. Crop Improv. 25 (2): 159-166.<br />
Pannu, P.P.S., Harjit- Singh, Singh, S. and H.S. Dhaliwal. 1994. Screening of wild Triticum and Aegilops<br />
species for resistance to Kamal but disease ofwheat. Plant Genetic Resources, 97: 47-48.<br />
Prasad, M., Varshney, R.K., Kumar, A., Balyan, H.S., Sharma, P.c., Edwards, K.J. Harjit-Singh, Dhaliwal,<br />
H.S., Roy, 1.K. and P.K. Gupta. 1999. A microsatellite marker linked with QTL for grain protein<br />
content in bread wheat. <strong>The</strong>or Appl Genet. 99(1/2): 336-340.<br />
Randhawa, H.S., Dhaliwal, H.S., Harjit-Singh, and K. Harinder. 1995. Cataloguing of wheat germplasm for<br />
HMW glutenin subunit composition. pp. 13-26. In: Chopta, V.L., Sharma, R.P. and M.S. Swaminathan<br />
(eds.). Second Asia-Pacific Conference on Agricultural Biotechnology, Oxford and IBH Publishing<br />
Company, New Delhi.<br />
Randhawa, H.S., Dhaliwal, H.S. and Harjit-Singh. 1997. Diversity for HMW glutenin subunit composition and<br />
the origin ofpolyploid wheats. Cereal Res Comm. 25(1): 77-84.<br />
Roy, J.K., Prasad, M., Varshney, R.K., Balyan, H.S., Blake, T.K., Dhaliwal, H.S., Harjit-Singh, Edwards, KJ.<br />
and P.K. Gupta. 1999. Identification ofa microsatellite on chromosome 6B and a STS on 7D of bread<br />
wheat showing association with pre-harvest sprouting tolerance. <strong>The</strong>or.Appl Genet, 99(1/2): 341-345.<br />
30
Germplasm enhancement through molecular breeding - Harjit Singh et al.<br />
Sharma, H.C. and B.S. Gill. 1983. Current status of wide hybridization in wheat. Euphytica, 32: 17-31.<br />
Singh, 1., Sukhija, P.K., Harjit- Singh, Dhaliwal, H.S. and K.S. Gill. 1991. Source of resistance to cereal cyst<br />
nematode (Heterodera avenae) in wild Triticum and Aegi/ops species. Ind. 1. Nematol, 21: 145-148.<br />
Questions and Answers:<br />
Ravi P. Singh: Most wide cross programs look for chromosome segments as small as<br />
possible worrying about undesirable traits that may be present in the longer segments. I<br />
suggest that all transfers, even longer ones, must be maintained and perhaps evaluated for<br />
genes other than the targeted resistance genes.<br />
Answer: All interspecific derivatives carrying large alien segments as well as those with<br />
complete substituted/added alien chromosomes are being maintained and evaluated for other<br />
desirable traits. However, for effective commercial utilization of alien genes with minimum<br />
linkage drag, one needs to select for small alien segments.<br />
Table 1.<br />
Wide hybridization for transfer of desirable traits from wild Triticum and<br />
Aegi/ops species.<br />
No of<br />
Donor species with sources Recurrent<br />
genome(s) Character(s) utilized parent<br />
Triticum urartu (AU) - Stripe rust* 1 T durum<br />
- New HMW subunits (Ax + Ay) 3 - do-<br />
T boeoticum (A b ) - New HMW subunits (Ax + Ay) 2 T. durum<br />
<br />
T araraticum (AG) - Leaf rust 6 T durum<br />
- Stripe rust 2 - do<br />
- Powdery mildew 2 - do<br />
- HMW glutenin subunits (Ax, Gx + Gy) 1 - do-<br />
T dicoccoides(AB) - Stripe rust 1 T. durum<br />
I - do- 1 T aestivum<br />
- HMW sub units (Ax, Ax + Ay) 3 T durum<br />
Ae. squarrosa (D) - Leaf rust 1 T. aestivum<br />
- Kamal bunt 1 - do-<br />
Ae. ovata (UM) Leaf rust, stripe rust, powdery mildew, 1 T. aestivum<br />
kamal bunt, cereal cyst nematode<br />
Ae. triuncialis (UC) - do- 1 T aestivum<br />
Ae. caudata (C) - do- 2 T. aestivum<br />
Ae. umbellulata (U) - do- 2 T aestivum<br />
* alien resistance gene for the respective disease mentioned in thiS column.<br />
31
Germplasm enhancement through molecular breeding - Harjit Singh et al.<br />
Table 2.<br />
Effect of transfer of novel alien high molecular weight glutenin subunits<br />
from wild Triticum progenitor species into T. durum cv. PBW34 on SDS<br />
sedimentation value.<br />
I<br />
'.<br />
NovellIMW SDS<br />
Donor Accession . subunit fiom. IdentificatiOn sed.<br />
species number donor line nuhtl>~r G~neration value<br />
T. boeoticum 7115 Ax+Ay L98/99-10-3 BC 4 F 3 75.0<br />
T. urartu 5301 Ax+Ay L98/99-13-1 BC 2 Fs 64.0<br />
-do- L98/99-15-3 BC 2 Fs 61.5<br />
-do- L98/99-16-3 BC 2 Fs 56.0<br />
-do- L98/99-26-5 BC 3 F 2 57.5<br />
-do- L98/99-27 -10 BC 3 F 2 75.0<br />
5340 -do- L98/99-33-8 BC 2 F 2 71.5<br />
T. dicoccoides 4630 Ax L97/98-119-1 BC 3 F 3 49.0<br />
4632 Ax+Ay L96/97-1-7 BC 2 Fs 54.0<br />
7070 Az+Ay 89 BC 2 Fs 66.0<br />
T. araraticum 4224 Ax, Gx+Gy 55-4 BC 2 F 3 48.5<br />
Check.<br />
T. durum cv. PBW34 38.0<br />
Table 3.<br />
Pre-breeding of two agronomically superior spring wheat cultivars<br />
WL711 and HD 2329.<br />
S. '.<br />
no. Character Genes/source(s)/description<br />
1 Leaf rust resistance Lr 9, Lr 19, Lr 22a, Lr 24, Lr 32, Lr 34, Lr KLM4-3B<br />
2 Stripe rust resistance Yr 9, Yr 10<br />
3 Kamal bunt resistance Major genes from HD 29<br />
4 Powdery mildew resistance From T dicoccum line NP 200<br />
5 Bread making quality Novel HMW glutenin sub units "5 +10" (from UP301)<br />
6 High protein content Two major genes from PH 132 and PH 133<br />
7 Height Lines with both Rht 1 and Rht 2 and only Rht 1<br />
8 Agronomic characters Lines with - bold seed<br />
-long head<br />
- multi floret<br />
- o1igocu]m character with strong stem<br />
- branched ear<br />
- narrow erect leaves<br />
9 Sprouting tolerance - Major genes from Acc8198<br />
32
Germplasm enhancement through molecular breeding - Harjit Singh et al.<br />
Table 4. Molecular tagging of genes for protein content, pre-harvest sprouting tolerance and seed size.<br />
...<br />
Cross ".<br />
Population<br />
used for"<br />
mol~cular<br />
... ;<br />
.<br />
Trait Parent I Parent II tagging Geil~tic control Molecular ·markers liked witb the trait<br />
Grain protein WL711 PHl32 RlLs* Two major genes I. STMS marker (wmc41) associated with QTL on 2DL (Prasad et al., 1999)<br />
content (low) (high) and QTLs 2. IISR marker (UBC844 I 100) linked with QTL on 7 AS (Dholakia et al., unpub. data)<br />
Pre-harvest HD2329 SPR8l98 RILs One major gene I. STMS marker (wmcI04) on 6B (Roy et aI., 1999)<br />
sprouting tolerance (susceptible) (tolerant) and QTLs 2. STS marker (MST I 0 I) on 7D (Roy et al., 1999)<br />
Seed size Chinese Spring Rye Selill RILs Polygenic I. Two RAPD markers (Kaur et al., unpublished data)<br />
* Recombinant inbred hnes.<br />
(small) (high)<br />
-----<br />
33 <br />
-
QUALITY OF ETHIOPIAN DURUM WHEAT CULTIVARS<br />
Efrem Bechere 1 , R.J. Pena 2 and Demissie Mitiku 1<br />
IDebre Zeit Agricultural Research Center (EARO), P.O. Box 32, Debre Zeit, Ethiopia <br />
2International Maize and <strong>Wheat</strong> Improvement Center, <br />
Apdo. Postal 6-641, 06600 Mexico DF, Mexico <br />
, ABSTRACT<br />
Eleven Ethiopian durum wheat (Triticum turgidum var. durum) cultivars were<br />
evaluated at five environments in Ethiopia for two years for 1000 kernel weight,<br />
protein concentration, gluten strength, mixogram time, mixogram height, flour<br />
color and kernel yellow berry. Gluten strength was measured by the sodium<br />
dodecyl sulfate (SDS) sedimentation test. Gliadin and glutenin proteins were<br />
electrophoretically assessed to investigate associations between these proteins<br />
and gluten strength. Significant differences between the genotypes were observed<br />
for 1000 kernel weight, protein content, gluten strength, flour color and yellow<br />
berry. Six different patterns were identified for HMW glutenin subunits with the<br />
combination null and 20 being the most common. <strong>For</strong> Giu-Bl, the alleles<br />
producing protein subunits 20 and 7+8 were the most common. <strong>The</strong> 6+8 allele<br />
was less frequent. Three cultivars expressed the LMW-1 pattern while the<br />
remaining eight cultivars had pattern LMW-2. <strong>The</strong> strongest gluten strength<br />
corresponded to the mixed subunits 7+8/6+8 and 7+8/20, followed by subunits<br />
6+8 and 7+8. Subunit 20 was associated with the lowest gluten strength. LMW-2<br />
was more strongly associated with greater gluten strength as compared to LMW<br />
1. <strong>The</strong> effects ofLMW and HMW glutenin subunits were additive. To develop<br />
high quality durum wheats, LMW-l and subunit 20 HMW genotypes should be<br />
discarded, and electrophoretic analysis and SDS-sedimentation tests used to<br />
identify superior germplasm.<br />
INTRODUCTION<br />
Durum wheat (Triticum turgidum L. var. durum Desf.) is widely known to produce superior<br />
pasta products because of its kernel size, hardiness, and golden amber color. Cooked pasta<br />
prepared from durum wheat semolina retains firmness and elasticity and is resistant to surface<br />
disintegration and stickiness. <strong>The</strong>se characteristics tend to be cultivar dependent (Dexter and<br />
Matsuo, 1977; Autran et ai., 1986; Feillet et ai., 1989). Autran and Galterio (1989) pointed out<br />
that an essential element of pasta cooking quality is the ability protein components to interact<br />
during pasta processing resulting in insoluble aggregates and viscoelastic complexes that entrap<br />
starch granules limiting surface disintegration of pasta during cooking. Gliadin and glutenin<br />
proteins interact in the presence of water to form glutenin, the protein complex responsible for<br />
the viscoelastic properties that make durum wheat superior for pasta making (Pena et aI., 1994).<br />
• <br />
<strong>The</strong> viscoelasticity of cooked pasta correlates with protein content and type (Damidaux et ai.,<br />
1980; Kosmolak et ai., 1980; Du Cros, 1987). Researchers (Galterio et ai., 1993; Mariani et ai.,<br />
1995) have indicated that when durum wheat protein concentration falls below 11 %, inferior<br />
34
Quality ofEthiopian durum wheat cultivars - Efrem et at.<br />
pasta quality occurs. Gluten composition is the primary factor determining the quality<br />
characteristics of durum wheat cultivars (Vazquez et al., 1996). Glutenins can be<br />
electrophoretically divided into high (HMW) and low (LMW) molecular weight subunits. BMW<br />
subunits are encoded by genes on the long arm ofgroup I homoeologous chromosomes (Glu-AI,<br />
Glu-Bl, and Glu-Dl) whereas the genes encoding the LMW subunits are clustered on the short<br />
ann (Glu-A3, Glu-B3, and Glu-D3) of the same chromosomes, tightly linked to the Gli-Bl<br />
complex loci which encode for y-gliadin 42 and y-gliadin 45 (D'Ovidio et al. , 1992; Payne et al.,<br />
1984; Shewry et al. , 1986; Payne, 1987).<br />
Two LMW glutenin subunit patterns, LMW-l and LMW-2, largely explain quality differences<br />
between some durum wheat genotypes. LMW-2 glutenin subunits confer superior quality with<br />
respect to genotypes possessing LMW-l (Vazquez et al., 1996; D'Ovidio, 1993). Ruiz and<br />
Carillo (1995) indicated that, in general, lines with the LMW-2 pattern had significantly greater<br />
SDS sedimentation value and better mixograms than those with the LMW -1 patterns. <strong>The</strong> y<br />
gliadin components 42 and 45 are only genetic markers, without any direct involvement in dough<br />
quality.<br />
Assessing the relationship between durum gluten strength and glutenin properties, Carillo et al.<br />
(1990) found that HMW subunits 6+8 and 7+8 were more commonly associated with superior<br />
quality subunit 20 with poorer quality. Autran and Feillet (1987) reported no significant<br />
differences between SDS means of durum genotypes with subunit 6+8 or 7+8. Genotypes with<br />
subunit 20 however, had weaker gluten strength. Peiia et al. (1995) pointed out that subunits 6+8<br />
and 7+8 showed significantly better durum quality than subunit 20, and, the subunit pair 6+8 was<br />
associated with significantly higher SDS values when combined with LMW-2 than with LMW-l.<br />
Pogna et al. (1990) indicated that gluten subunit 7+8 gave greater SDS sedimentation volume<br />
and higher elastic recoveries than subunits 6+8 and 20, and the positive effects ofLMW-2 gluten<br />
subunits and HMW subunit 7+8 were additive.<br />
Yellow color pigmentation in semolina and in the finished pasta products is a desirable quality<br />
characteristic of durum wheat. Durum contains xanthophylls (yellow pigment) and lacks<br />
lipoxidase enzyme, which destroys the yellow pigment during processing. Joppa and Walsh<br />
(1974) observed that durum genotypes differ in xanthophylls and lipoxidase quantity and quality.<br />
Ethiopia is the largest producer of durum wheat in Sub-Saharan Africa and is considered to be<br />
a center of genetic diversity for this species of wheat (Vavilov, 1951). However, very little<br />
emphasis has been placed on improving the nutritive or processing quality of durum wheat in<br />
Ethiopia. In this study, eleven durum wheat cultivars released in Ethiopia between 1966 and<br />
1996 were evaluated for agronomic and nutritive and processing quality characteristics.<br />
MATERIALS AND METHODS<br />
Eleven durum wheat cultivars released in Ethiopia between 1966 and 1996 were included in the<br />
study (Table 1). <strong>The</strong> materials were planted in five diverse and typical durum wheat growing<br />
environments (Debre Zeit, Akaki, Chefe Donsa, Bichena and Alem Tena) across the country<br />
during the 1995 and 1996 main cropping seasons. Debre Zeit and Akaki are mid-altitude<br />
environments (1900-2300 m a.s.l.) charactelized by moderate annual rainfall (700 - 900 mrn) and<br />
well drained black Vertisol soils. Chefe Donsa and Bichena are highland (>2300 m a.s.l.)<br />
environments characterized with high annual rainfall (>1000 mm) and poorly drained black<br />
Vertisol soils. Alem Tena is a lowland « 1900 m a.s.l.) site located in the Rift Valley and with<br />
35
Quality ofEthiopian durum wheat cultivars - Efrem et al.<br />
well-drained sandy soil, and an annual, erratic rainfall of 500 nun. A randomized complete block<br />
design with three replications was used. Plot sizes were 6m x 2m. Fertilizer was applied at the<br />
rate of 100 kg ha- l dianunonium phosphate (DAP) and 100 kg ha- l urea. DAP was all applied at<br />
planting time whereas urea was split-applied, especially at the high rainfall environments. Other<br />
cultural practices were based on local recommendations.<br />
Total grain protein extracts were separated by sodium dodecyl sulfate-polyacrylamide gel<br />
electrophoresis (SDS-PAGE), using 10% polyacrylamide gels. High and low-molecular weight<br />
glutenin subunits were designated according to the nomenclature system of Payne and Lawrence<br />
(1983) and Payne et al. (1984).<br />
Whole meal and flour quality assessment tests were conducted by the <strong>Wheat</strong> Quality Laboratory,<br />
at CIMMYT headquarters in Mexico. Whole meal samples were generated with a "Udy<br />
Cyclone" mill (Udy CO., Colorado, USA), fitted with a 0.5 mm screen, while flour samples were<br />
produced with a Brabender Jr. mill (Brabender OHG, Duisburg, Germany), fitted with 9XX mesh<br />
sieve. Gluten strength was estimated by the SDS-sedimentation test on I-g meal or flour samples<br />
as described by Pefia et al. (1990). Grain and flour protein were determined by NIR analysis<br />
using an Infralyzer 350 (Technicon Instruments Corp., Tarrytown, New York, USA) calibrated<br />
for protein (N X 5.7) as determined by the Kjeldahl procedure of the AACC (1983). Grain and<br />
flour color were determined with a Minolta (Minolta CO., N. Jersey, USA) Color Meter ("b"<br />
value), following manufacturer's instructions. Dough mixing time and mixogram peak height<br />
(recording paper size), were determined on 10-g flour samples with a Mixograph (National Mfg,<br />
Co. Chicago, Ill., USA) following method 54-40A of the American Association of Cereal<br />
Chemists (AACC, 1983). Yellow berry (%) was determined visually in 20-g grain samples.<br />
Separate physical, chemical and alveograph analysis of a subset of the tested cultivars, plus the<br />
recently released cultivars Tob66 and Asasa, was performed by Kaliti Food Share Co., Ethiopia.<br />
Data were analyzed using the SAS statistical program (SAS Institute, 1985). Fisher's Protected<br />
Least Significant Difference Tests (LSD) were used for means separation when the F-test<br />
indicated significant differences for genotypes. Flour quality data is presented only for the<br />
second year (1996) of testing. Samples from the three field replications were combined to<br />
generate this flour quality data, and hence, no statistical analysis was carned out on flour quality<br />
data. Homogeneity of error variance was tested before combining data across locations.<br />
RESULTS AND DISCUSSION<br />
Cocorit 71 and Kilinto exhibited the poorest yellow berry percentage, while Kilinto, Gerardo and<br />
Boohai had the highest 1000 kernel weight (Table 2).<br />
On a whole meal basis significant differences between the cultivars were found for protein<br />
concentration, SDS sedimentation volume and yellowness (Table 2). Grain protein among the<br />
cultivars ranged from 10 % to 12.3 %. Gerardo, Foka and Fetan had grain protein concentrations<br />
of 12 % or higher. Cocorit 71 exhibited a significantly higher SDS sedimentation volume than<br />
the other cultivars, based on whole meal data, though Foka, Yilma, and Kilinto also had<br />
relatively high SDS values. Quamy, Ld 357 and Fetan exhibited the lowest SDS values. Flour<br />
protein concentration correlated positively with whole meal protein. Flour SDS values were<br />
higher, but in general, followed a similar pattern. <strong>The</strong> cultivars Yilma, Foka and Cocorit 71 had<br />
the highest flour SDS values (Table 3). <strong>The</strong> longest mixing time was also observed for Cocorit<br />
36
Quality ofEthiopian durum wheat cultivars - Efrem et al.<br />
71, Vilma and Kilinto. <strong>The</strong> cultivars Vilma, Foka and Boohai had the highest mixogram height.<br />
Ld 357, Bichena, Boohai, Fetan and Vilma exhibited the highest whole meal yellowness (Table<br />
2) and flour color (Table 3).<br />
HMW and LMW glutenin subunits<br />
Six patterns were identified for HMW glutenins with the alleles null and 20 being the most<br />
common. Representing Glu-Bl, the alleles 20 and 7+8 were the most common. Less frequent was<br />
the 6+8 allele. Vilma was bi-morphic for 20 and 7+8 as was Cocorit 71 with 7+8 and 6+8.<br />
Gerardo, Ld 357, and Quamy had pattern LMW -1 and the remaining eight cultivars had pattern<br />
LMW-2 (Table 4) glutenin subunits.<br />
<strong>The</strong> relationship between HMW and LMW glutenin subunits and durum quality is summarized<br />
in Table 5. Significant differences were observed between the six HMW subunits for whole meal<br />
protein, whole meal SDS, yellow berry, and yellowness. <strong>The</strong> strongest gluten strength was<br />
associated with the subunit pair 7+8/6+8 (Cocorit 71) followed by 7+8/20 (Yilma) and 6+8<br />
(Kilinto), while subunit 20 was associated with the poorest gluten strength (Quamy and Fetan)<br />
(Tables 2 and 4).<br />
Cultivars with LMW-2 had significantly greater gluten strength than those with LMW-l as<br />
indicated by SDS sedimentation volumes (Table 5). Various researchers (D'Ovidio, 1993; Ruiz<br />
and Carillo, 1995; Porceddu et al., 1998) have also reported that band LMW-2 is responsible for<br />
endowing semolina with better properties. <strong>The</strong> effects of the LMW and HMW glutenins on<br />
gluten quality appear to be additive because cultivars showing glutenin patterns LMW-2 in<br />
association with HMW glutenin subunits 6+8 and 7+8 were among those characterized by the<br />
best gluten quality (Cocorit 71 and Kilinto) (Table 2 and Table 5). This type of additive response<br />
was also reported by Boggini et al. (1997).<br />
Quality analysis by the Kaliti Food Share Company<br />
Analysis by Kaliti Food Share Co., indicated that six of the released cultivars had amber and<br />
extra hard (AEH) kernels, a requirement for quality pasta products (Table 6). Most of the<br />
cultivars (except DZ04-118 and Gerardo) met the hectoliter weigh standard. <strong>The</strong> standard set for<br />
extra hard/soft texture ratio is 9011 0, and six of the cultivars passed this standard, with Asasa<br />
exhibiting a ratio 10010, indicating superiority for this trait (Table 6).<br />
Cultivars Tob 66, Asasa, Boohai and Quamy had wet gluten values within the standard range<br />
(27-36). <strong>The</strong> varieties Tob 66 and Asasa were quite outstanding in this regard with wet gluten<br />
percent of 35.80 and 32.70, respectively. Tob 66, Asasa, Boohai, Quamy, Kilinto, Foka and<br />
Gerardo exhibited protein concentrations ranging from 13.0 to 15.4, well within the industrial<br />
standard range.<br />
<strong>The</strong> Chopin Alveograph Analysis indicated that Tob 66, Quamy and Kilinto perfonned well for<br />
dough resistance. <strong>For</strong> dough expansion, only Tob 66, Kilinto and Gerardo met the industrial<br />
requirement. None of the cultivars had values within the standard range for dough extensibility.<br />
Based on their overall analysis, Kaliti has recommended Tob 66, Asasa, Boohai, Quamy, Kilinto<br />
and Foka (in this order) as being superior for pasta products.<br />
37
Quality ofEthiopian durum wheat cultivars - Efrem et al.<br />
CONCLUSIONS<br />
Pasta products made from durum wheat semolina require adequate level of protein for proper<br />
processing characteristics, nutritional value and overall quality. Most lines evaluated in this study<br />
had adequate levels ofprotein. In spite of the fact that qualitative traits such as protein content<br />
and gluten strength neither conferred adaptive advantage nor underwent intentional selection<br />
pressure in Ethiopia, variation for SDS sedimentation volume was found in the gennplasm<br />
studied (2.6 - 6.9 ml). <strong>The</strong> cultivars Cocorit 71, Foka, Kilinto and Yilma had the highest gluten<br />
strength. Foka was a superior genotype for most quality parameters. Gerardo, Ld 357 and<br />
Quamy, exhibited poor gluten strength.<br />
However, this study has shown that in a durum quality breeding program, it is more effective to<br />
discard gennplasm based on low molecular weight glutenin patterns (LMWG), the deleterious<br />
casual proteins, because high molecular weight glutenins (HMWG) can be associated with two<br />
different patterns ofLMWG, as has been demonstrated in this study. Genotypes with LMW-1<br />
and HMW glutenin subunit 20 should be discarded, as well. Combined electrophoretic analysis<br />
with SDS sedimentation are effective tools to select genotypes of durum wheat with good<br />
viscoelasticity and pasta finnness. <strong>The</strong> SDS test and the mixogram are effective in detecting the<br />
genetic variance related to gluten properties.<br />
SDS allows early generation selection since lines chosen for high SDS values maintain good<br />
characteristics when grown in different locations and years. Protein content, .on the other hand,<br />
is highly influenced by the environment. Genetic expression of protein content must therefore<br />
be measured with reference to environmental conditions.<br />
<strong>The</strong>se results, in addition to identifying genetic diversity for specific quality parameters, can be<br />
useful in planning more effective durum wheat breeding strategies. However, since the quality<br />
analysis by the authors and the analysis made by the Kaliti Food Share Company differ in some<br />
respects, there may be a need to repeat this experiment across more years and locations.<br />
ACKNOWLEDGMENTS<br />
This research was financially supported by the Debre Zeit Agricultural Research Center in<br />
cooperation with the CIMMYT, European Union funded project "Strengthening <strong>Wheat</strong><br />
Breeding and Pathology Research in NARS in <strong>Eastern</strong> Africa" and the Kaliti Food Share Co.,<br />
Ethiopia.<br />
REFERENCES<br />
American Association of Cereal Chemists. 1983. Approved methods of the American Association of Cereal<br />
Chemists, AACC, 7 111 Ed. St Paul, Minn.<br />
Autran, J.e., Abecassis, J. and P. Feillet. 1986. Statistical evaluation of different technological and biochemical<br />
tests for quality assessment in durum wheats. Cereal Chem. 63: 390-394.<br />
Autran, J.C. and P. Feillet. 1987. Genetic and technological basis of protein quality for durum wheat in pasta.<br />
pp. 59-71. In : Pattakon, V. (ed.), Proc. EEC Symp. on Protein Evaluation in Cereals and Legumes.<br />
Cereal Institute, <strong>The</strong>ssaloniki, Greece.<br />
Autran, J.e. and G. Galterio. 1989. Associations between electrophoretic composition of proteins, quality<br />
characteristics and agronomic attributes of durum wheats II. Protein - quality associations. J. Cereal<br />
Sci. 9: 195-215.<br />
Boggini, G., Doust, M.A., Annicchiarico, P. and L. Pecetti. 1997. Yielding ability, yield stability and quality of<br />
exotic durum wheat gennplasm in Sicily. Plant Breeding, 116: 541-545.<br />
Carrillo, J.M., Vazquez, J.F. and J. Orellana. 1990. Relationship between gluten strength and glutenin proteins in<br />
38
Quality ofEthiopian durum wheat cultivars - Efrem et at.<br />
durum wheat cultivars. Plant Breeding, 104: 325-333.<br />
Damidaux, R., Autran, J.C. and P. Feillet. 1980. Gliadin electrophoregrams and measurements of gluten<br />
viscoelasticity in durum wheats. Cereal Foods World 25: 754-756.<br />
Dexter, J.E. and R.R. Matsuo. 1977. <strong>The</strong> spaghetti making quality of developing durum wheats. Can 1. Plant<br />
Sci. 57: 7-16.<br />
D'Ovidio, R. 1993. Single-seed PCR of LMW glutenin genes to distinguish between durum wheat cultivars with<br />
good and poor technological properties. Plant Molecular Biology, 22: 1173-1176.<br />
D'Ovidio, R., Tanzarella, O .A. and E. Porceddu. 1992. Molecular analysis of gliadin and glutenin genes in T.<br />
durum cv. Lira: A model system to analyze the molecular basis of quality differences in durum wheat<br />
cultivars.1. Cereal Sci. 16: 165-172.<br />
Du Cros, D.L. 1987. Glutenin proteins and gluten strength in durum wheat. 1. Cereal Sci. 5: 3-12.<br />
Feillet, P., Ait-Mouh, 0 ., Kobrehel, K. and J.C. Autran. 1989. <strong>The</strong> role of low molecular weight glutenin<br />
proteins in the detennination of cooking quality of pasta products. Cereal Chemistry, 66( 1): 26-30.<br />
Galterio, G., Grita, L. and A Brunori. 1993. Pasta making quality in Triticum durum. New indices from the ratio<br />
among protein components separated by SDS-PAGE. Plant Breeding, 110: 290-296.<br />
Joppa, L.R. and D.E. Walsh. 1974. Quality characteristics of tall and semi-dwarf near isogenic lines of durum<br />
wheat. Crop Sci., 14: 420-422.<br />
Kosmolak, F.G., Dexter, J.E., Matsuo, R.R., Leslie, D. and B.A. Marchylo. 1980. A relationship between durum<br />
wheat quality and gliadin electrophoregram. Can 1. Plant Sci. 60: 427-432.<br />
Kovacs, M.LP., Howes, N.K., Leslie, D. and J.H. Skerritt. 1993. <strong>The</strong> effect of high Mr. glutenin subunit<br />
composition on the results from tests used to predict durum wheat quality. 1. Cereal Sci. 18: 43-51 .<br />
Mariani, B.M., D' Egidio, M.G. and P. Novaro. 1995. Durum wheat quality evaluation: Influence of genotype<br />
and environment. Cereal Chem. 72(2): 194.197.<br />
Payne, P.I. 1987. Genetics of wheat storage proteins and the effect ofal\elic variation on bread making quality.<br />
Ann. Rev. Plant Physiol. 38: 141-153.<br />
Payne, P.L and G.J. Lawrence. 1983. Catalogue of alleles for the complex gene loci, Glu-Al, Glu-Bl and Glu<br />
D1, which code for the high-molecular-weight subunit of glutenin in hexaploid wheat. Cereal Res.<br />
Commun ., 11: 29-35.<br />
Payne, P.L, Jackson, E.A. and L.M. Holt. 1984. <strong>The</strong> association between gamma-gliadin 45 and gluten strength<br />
in durum wheat varieties: A direct casual effect or the result of genetic linkage? J. Cereal Sci. 2: 73 -81 .<br />
Pena, R.J., Amaya, A., Rajaram, S. and A. Mujeeb-Kazi. 1990. Variation in quality characteristics associated<br />
with some spring IBIlR translocation wheats. 1. Cereal Sci. 12: 105-112.<br />
Pena, R.J., Zarco-Hernandez, J. and A. Mujeeb-Kazi. 1995. Gluten subunit compositions and bread-making<br />
quality characteristics of synthetic hexaploid wheats derived from Triticum turgidum oX Triticum<br />
tauschii (Coss.) Schmal crosses. 1. Cereal Sci. 21: 15-23.<br />
Pena, R.J., Zarco-Hernandez, 1. Amaya-Celis, A and A. Mujeeb-Kazi. 1994. Relationships between<br />
chromosomes IB-encoded glutenin subunit compositions and bread-making quality characteristics of<br />
some durum wheat (Triticum turgidum) cultivars. J. Cereal Sci. 19: 243-249.<br />
Pogna, N.E., Autran, J.C., Mellini, F., Lafiandra, D. and P. Feillet. 1990. Chromosome IB-encoded gliadin and<br />
glutenin subunits in durum wheat: genetics and relationship to gluten strength. 1. Cereal Sci. 11 : 15-34.<br />
Porceddu, E. , Turchetta, T., Masci, S., D 'ovidio, R., Lafiandra, D., Kasarda, D.D. Impiglia, A and M.M. Nachit.<br />
1998. Variation in endospenn protein composition and technological quality properties in durum wheat.<br />
Euphytica, 100: 197-205.<br />
Ruiz, M. and J.M. Carrillo. 1995. Relationships between different prolamin proteins and some quality properties<br />
in durum wheat. Plant Breeding, 114: 40-44.<br />
SAS Institute. 1985. <strong>The</strong> GLM procedure, SAS User's Guide, Statistics, 5 th ed. SAS Inst., Cary, NC.<br />
Shewry, P.R., Tatham, AS., <strong>For</strong>de, J., Kreis, M. and B.J. Miflin, 1986. <strong>The</strong> classification and nomenclature of<br />
wheat gluten proteins: A reassessment. 1. Cereal Sci. 4: 97-106.<br />
Vavilov, N.L 1951. <strong>The</strong> origin, variation, immunity and breeding of cultivated plants. Chronica Botanica 13: 1<br />
366.<br />
Vazquez, J.F., Ruiz, M., Nieto-Taladriz M.T. and M.M. Albuquerque. 1996. Effects on gluten strength of low<br />
Mr. glutenin subunits coded by alleles at GIIl-A3 loci and Glu-B3 loci in durum wheat. 1. Cereal Sci.<br />
24: 125-130.<br />
39
Quality ofEthiopian durum wheat cultivars - Efrem et at.<br />
Questions and Answers:<br />
Ravi P. Singh: Bread wheats carrying the Lr19 gene for leaf rust resistance have higher<br />
pigment levels than the best durum wheat; what is the possibility of developing bread wheat<br />
for pasta production?<br />
Answer: It is possible as long as these bread wheats have a low amount of lipoxidase which<br />
destroys the pigment during processing.<br />
Wolfgang H. Pfeiffer: Several of the recently released cultivars carry unfavorable alleles<br />
such as HMW GLU-B I 20 and GLIADIN 1. Do you plan in the future to correct these<br />
deficiencies via e.g. progenitor building through the backcross method?<br />
Answer: Yes, we do. In fact, the crossing of these lines has already started at Debre Zeit.<br />
Table 1.<br />
Year of release, pedigree and origin of the eleven durum wheat cultivars<br />
tested for quality in 1995 and 1996.<br />
Year of<br />
1000 Kern.<br />
Cultivar release Pedigree Origin .. Wt.<br />
---gm--<br />
DZ04-118 1966 Improved Landrace Ethiopia 34.6<br />
Cocorit 71 1976 - CIMMYT 39.9<br />
Gerardo 1976 YZ466/61-130xLdsxGII's'CM9605 CIMMYT 40.7<br />
Ld 357 1979 Ld 357/CI,8155ND58-40 U.S.A 32.9<br />
Boohai 1982 Coo's'/CII,CD 3862-BS-IBS-OGR CIMMYT/Ethiopia 40.1<br />
Foka 1993 Cit 711CII, CD 3369 CIMMYTlEthiopia 37.8<br />
Kilinto 1994 Iumillo/lnrat 69/BHN31H0ral41 Cit CIMMYT/Ethiopia 41.4<br />
711Joro, DZ 918<br />
Bichena 1995 IumillolCocorit 71, DZ 392-2 CIMMYT IEthiopia 39.1<br />
Fetan 1996 Tob 2 CIMMYT IEthiopia 38.1<br />
Quamy 1996 AOSIIPGOICIII3/JO 69/CRA//GSI<br />
SBA 8113/FGOI<br />
CRA/5IFGO/DON/6IHUICD75533-A<br />
Yilma 1996 DZ864-12 CIMMYT/Ethiopia 41.7<br />
LSD 2.15<br />
Mean 38.7<br />
CY(%) 10.9<br />
Std. Dev. 7.4<br />
YeUow<br />
Berry_<br />
---%--<br />
14.2<br />
23.0<br />
18.1<br />
21.0<br />
12.2<br />
15.9<br />
24.0<br />
14.9<br />
8.9<br />
8.2<br />
0.84<br />
16.4<br />
10.0<br />
14.6<br />
40
Quality ofEthiopian durum wheat cultivars - Efrem et al.<br />
Table 2. Quality parameters for eleven durum wheat cultivars grown across five locations during 1995 and 1996.<br />
Cultivar<br />
DZ04-118<br />
Cocorit 71<br />
Gerardo<br />
Ld-357<br />
Boohai<br />
Foka<br />
Kilinto<br />
Bichena<br />
Fetan<br />
Quamy<br />
Yilma<br />
LSD<br />
Mean<br />
CV(%)<br />
Std. Dev.<br />
WM·Protein<br />
~-%(12%M.B.)'-<br />
11.3<br />
10.0<br />
12.3<br />
11.3<br />
11.8<br />
12.0<br />
10.0<br />
11.9<br />
12.0<br />
10.9<br />
11.6<br />
0.13<br />
11.4<br />
2. 3<br />
3.0<br />
-<br />
WM SDSSed.<br />
..<br />
-ml-- .<br />
5.3<br />
6.9<br />
5.0<br />
3.9<br />
5.5<br />
6.1<br />
6.0<br />
5.6<br />
4.5<br />
2.6<br />
6.1<br />
0.15<br />
5.2<br />
5.7<br />
1.3<br />
WM YellowDt(ss .. <br />
Minolta'b' <br />
15.3 <br />
13.4 <br />
15.4 <br />
16.2 <br />
16.2 <br />
15.5 <br />
14.9 <br />
16.3 <br />
16.1 <br />
15.3 <br />
16.6 <br />
0.24 <br />
15.6 <br />
3.0 <br />
1.9 <br />
HMw(Glu"'Al). <br />
0 <br />
0 <br />
0 <br />
0 <br />
0 <br />
0 <br />
0 <br />
0 <br />
0 <br />
0 <br />
0 <br />
.:IiMW(Glu7"B.1)<br />
7+8 <br />
7+8/6+8 <br />
6+8 <br />
7+8 <br />
20 <br />
20 <br />
6+8 <br />
20 <br />
20 <br />
20 <br />
7+8/20 <br />
. .. . . I<br />
.... ·LMW(Glu~B3) :<br />
2<br />
2<br />
1 I<br />
1<br />
2<br />
2<br />
2<br />
2<br />
2<br />
1<br />
2<br />
41
Quality ofEthiopian durum wheat cultivars - Efrem et al.<br />
Table 3.<br />
Flour quality data (unreplicated) for eleven durum wheat cultivars grown<br />
during 1996.<br />
Cultivar'<br />
DZ04-118<br />
Cocorit 71<br />
Gerardo<br />
Ld 357<br />
Boohai<br />
Foka<br />
Kilinto<br />
Bichena<br />
Fetan<br />
Quamy<br />
Yilma<br />
Flour Protein "<br />
%04%M.R)<br />
10.5<br />
9.2<br />
11.5<br />
10.5<br />
10.4<br />
11.5<br />
10.2<br />
10.6<br />
11.0<br />
10.3<br />
10.8<br />
Flour SDS,Sed t<br />
--iiil"'''''<br />
5.1<br />
8.7<br />
6.1<br />
3.9<br />
6.8<br />
8.8<br />
7.6<br />
7.8<br />
5.4<br />
2.7<br />
9.7<br />
Mixjng , Ti~e ,<br />
--min-<br />
3.6<br />
3.9<br />
2.7<br />
2.1<br />
3.2<br />
2.9<br />
3.3<br />
2.8<br />
2.7<br />
2.9<br />
3.8<br />
Mixing ,Ht. 'Flour Color<br />
; paper,sl:ale Minolta'b'<br />
3.4 13.9<br />
3.5 10.5<br />
3.8 14.5<br />
3.5 15.7<br />
4.0 15.1<br />
4.1 13.8<br />
3.5 14.0<br />
3.8 15.5<br />
3.9 14.9<br />
3.5 14.9<br />
4.0 15.8<br />
42
Quality ofEthiopian durum wheat cultivars - Efrem et al.<br />
Table 4. Mean values for quality characteristics of eleven durum wheat cultivars grouped according to Glu-Bl and Glu-B3<br />
controlled low MW glutenin subunit composition.<br />
' WM Flour<br />
'WM Flour .SDS SDS Mi~in~ ¥lxing ¥ellQw ~ .' Wl\;l',<br />
..<br />
Subunit Groups PrQt~ill Protein Sed. Sed . . Time Height<br />
. .<br />
c:iJ~p.yj . YeIl6witess: ~<br />
. ..<br />
% (12 0 /0 M~B.) % (14% M.R) --ml- --ml-,;. . .;.-min-- ~Paper ~c~de- -~%~~ - Mi~~~lta'b'~~-<br />
Glu-Bl<br />
20 11.1 10.4 4.9 S.9 2.9 3.7 17.9 IS .S<br />
6+8 11.2 10.9 S.S 6.9 3.0 3.7 21.2 lS .2<br />
7+8 10.9 10.0 S.1 4.6 2.7 3.S 17.7 14.8<br />
7+8/6+8 10.0 9.2 6.9 8.7 3.9 3.S 23.0 13.4<br />
7+8/20 11.6 10.8 6.1 9.7 3.8 4.0 8.2 16.6<br />
Significance levelt ** -- ** -- -- -- ** **<br />
Glu-B3<br />
LMW-1 11.S at 10.8 3.8 b 4.2 2.6 3.6 19.8 a IS.7 a<br />
LMW-2 11.2 a 10.1 S.7 a 6.S 3.0 3.6 lS.9 b IS.4 a<br />
Combinations<br />
20/LMW-l 10.9 10.3 2.6 2.7 2.9 3.S 20.1 IS.3<br />
20/LMW-2 11.2 10.4 S.4 6.6 2.9 3.7 17.S IS .S<br />
6+8/LMW-1 12.3 11 .S S.O 6.1 2.7 3.8 18.1 lS.4<br />
6+8/LMW-2 10.0 10.2 6.0 7.6 3.3 3.S 24.0 14.9<br />
7+8/LMW-1 11.3 10.S 3.9 3.9 2.1 3.S 21.0 16.2<br />
7+8/LMW-2 10.8 9.8 S.S 4.9 2.8 3.S 16.S 14.3<br />
t ** - significant at the 0.01 level of probability.<br />
t within columns, means followed by the same letter are not significantly different according to LSD (0.05).<br />
43 <br />
I
Quality ofEthiopian durum wheat cultivars - Efrem et al.<br />
Table 5. Physical, chemical and alveograph analysis of released durum wheat varieties l •<br />
. Physical Characteristics Chemical Characteristics* Chopin Alve~gr;tpb Analysis<br />
Variety Type I HLW I E.hard/soft wet gluten dry gluten Protein dough rest. expansion extensibility<br />
-k~/hl- -% -% _%_<br />
(P) (G) (L)<br />
Tob 66 AEH 82.85 97/3 35.80 11.70 15.47 84.70 18.63 70.80<br />
Asasa AEH 83 .50 10010 32.70 10.68 14.77 71.28 15.88 51.21<br />
Boohai AEH 82.50 94/6 28.90 10.28 13.90 80.85 16.31 54.00<br />
Quamy AEH 82.15 9911 28.90 12.46 13.90 85.52 14.04 40.20<br />
Kilinto AEH 80.10 94/6 14.50 8.38 13.90 90.75 17.51 62.25<br />
Foka AEH 81.50 95/5 18.04 7.68 13.04 55.00 15.78 50.80<br />
Cocorit 71 Soft 80.50 5/95 12.60 4.20 10.20 84.00 14.92 45 .33<br />
Bichena AEH&S 85.l0 75125 19.90 7.20 11.86 108.63 16.16 53 .00<br />
Ld 357 VEH 80.60 15/85 15.40 6.70 11.86 54.78 13.66 38.00<br />
DZ04-118 WSEH 79.45 30170 23.05 4.80 10.84 47.12 15.38 48.00<br />
DZ 1640 AEH&S 82.85 71129 18.04 7.50 11 .52 50.82 14.93 45.20<br />
Gerardo AEH&S 78.60 90110 33.77 11 .26 15.01 55.66 17.81 64.40<br />
Standard 80.00 90110 . 27-36 10-12 13-15 85-110 18-22 76-110<br />
I Analysis carried out by the Kaliti Food Share Company.<br />
* samples are prepared by extracting the endosperm from each durum wheat sample.<br />
AEH - Amber and Extra hard; HL W - Hectoliter Weight; S - Soft .<br />
44
ON-FARM DEMONSTRATION OF IMPROVED DURUM WHEAT VARIETIES <br />
UNDER ENHANCED DRAINAGE ON VERTISOLS <br />
IN THE CENTRAL HIGHLANDS OF ETHIOPIA <br />
Fasil Kelemework, Teklu Erkosa, Teklu Tesfaye, and Assefa Gizaw<br />
Debre Zeit Agricultural Research Center (EARO), P.O. Pox 32, Debre Zeit, Ethiopia<br />
ABSTRACT<br />
An on-farm demonstration was conducted for two consecutive cropping<br />
seasons (1998-1999) to give farmers the opportunity to compare and evaluate<br />
a surface drainage technology, Broadbed and Furrow (BBF), and its associated<br />
production package with the traditional system, Ridge and Furrow (RF), on<br />
Vertisol areas of Gimbichu, Ethiopia. A total of 39 farmers participated in the<br />
trial. Improved durum wheat varieties Kilinto and Foka were grown on 50 x<br />
50 m 2 plots. <strong>The</strong> results revealed that the mean grain yield of the RF seedbed<br />
exceeded the BBF yield by 54 and 120% for the first and second years,<br />
• respectively. Also, the straw yield of the RF seedbed exceeded the BBF yield<br />
by 10 and 16% for the first and second years, respectively. <strong>The</strong> current results<br />
contradict previous reports of superior grain and straw yields using BBF cf.<br />
RF and other traditional seedbed preparation methods. This suggests that there<br />
may be a gap in the identification of appropriate conditions for utilization of<br />
the BBF technology (i.e., in terms of appropriate sowing date, availability of<br />
short rains for land preparation, appropriate site selection, intensity and<br />
distribution of rainfall, occurrence of frost, or desiccating wind late in the<br />
season). <strong>The</strong> participating farmers reported that the 1998-1999 seasons were<br />
characterized by heavy rainfall that started late in the season, and that the<br />
intensive rainfall each season surpassed the draining capacity of the BBF<br />
system. Farmers' weeding was constrained by the heavy and extended rainfall<br />
both years. <strong>The</strong>refore, the interaction of the technology and climatic and<br />
edaphic factors should be studied further to refine the technology for wider<br />
adoption.<br />
INTRODUCTION<br />
Bread wheat (Triticum aestivum) and durum wheat (T durum) are widely grown in Ethiopia.<br />
Traditionally, durum wheat has been dominant in Ethiopia (Hailu, 1991) though recently the<br />
area under bread wheat surpassed the durum area. Durum wheat is mostly grown on black<br />
clay soils (Vertisols) and hence farmers refer to it as "Yekoticha Sinde" meaning wheat of<br />
black soils. Vertisols constitute over 1 0% the Ethiopian land mass and hence they are<br />
agriculturally important to Ethiopia. In Gimbichu woreda, durum wheat accounts for 51 % of<br />
the total cereal production. However, yields are low because of water logging and low<br />
yielding potential of the local cultivars, among others.<br />
A wide range of practices has been developed in order to over come these problems.<br />
Traditionally farmers use low yielding crop varieties adapted to poor surface drainage, ridges<br />
45
On-farm demonstration ofimproved durum wheat varieties - Fasil et at.<br />
and furrows late planting, hand made broadbeds and furrows, and soil burning practices.<br />
However, previous studies indicated that with the exception of the hand made broadbeds and<br />
furrows, the traditionally applied surface drainage techniques are inadequate to allow the full<br />
realization of potential of vertisols. <strong>The</strong> BBF technology that emanated from precursor<br />
traditional practices (Jutzi et al., 1986) was found to adequately satisfy the need for draining<br />
excess soil moisture and promotes the advancement of cropping season in order to utilize the<br />
potential growing period of these seasonally water logged soils. Using this new practice,<br />
higher yields have been reported for many crops (Hailu 1988; Tekalign, 1989; Mesfin and<br />
Jutzi, 1993). As a result a Broadbeds and Furrows technology (BBF) is recommended as an<br />
alternative solution since this technology has performed weB in various locations and years<br />
(Mesfin and Jutzi, 1993). According to Jutzi and Mohammed-Saleem (1991) using BBF<br />
increases wheat grain yields by an average of 21 % and straw yields by 19% as compared to<br />
the farmers' ridging method.<br />
It was, therefore, hypothesized that the introduction of improved management of Vertisols<br />
along with the high yielding durum wheat varieties may increase productivity. Hence, this<br />
experiment was conducted to give farmers the opportpnity to compare and evaluate the<br />
improved surface drainage technology (BBF) and its packages as compared to the traditional<br />
systems (RF).<br />
MATERIALS AND METHODS<br />
<strong>The</strong> study was conducted for two cropping seasons (1998 and 1999) in Gimbichu watershed<br />
areas (39°08' E and 8°58' N). <strong>The</strong> area is characterized as a traditional wheat growing area<br />
(2450 m a.s.l.) on Vertisols. Two surface drainage methods (BBF) and the traditional ridge<br />
and furrow (RF) were compared on a total of 39 (27 and 12 during the first and second year,<br />
respectively) farmers' fields. Out of the 39 farmers that participated in the on-farm trial, 29<br />
grew Kilinto and the remaining 10 grew Boohai, durum wheat cultivars. Twelve of the<br />
participant farmers used both BBF and RF, thirteen used BBF while the remaining fourteen<br />
used RF only. Each variety was planted on a plot size of 50 x 50 m 2 of land.<br />
Out of the 39 farmers that took part in on-farm trial, 25 farmers used BBF while 26 of the<br />
farmers used RF technique of seedbed preparation. <strong>The</strong> number of ploughings carried out by<br />
participant farmers that used the BBF technique of seedbed preparation was four and three<br />
for 1998 and 1999 cropping season, respectively. Planting dates in general ranged from the<br />
third week of July to fourth week of August. All participant farmers applied fertilizer based<br />
on the recommendation from research i.e. 50 kg ha- 1 DAP and 150 kg ha- I urea.<br />
RESULTS AND DISCUSSION<br />
Grain and straw yields by seedbed type: <strong>The</strong> grain yield obtained by farmers who used BBF<br />
ranged from 440 to 2936 kg ha- I , with a mean of 1272 kg ha- 1 • Straw yield ranged from 533<br />
to 5877 kg ha- I with a mean of 3459 kg ha- I . Farmers who used RF received grain yield<br />
ranging from 1056 to 4538 kg ha- 1 with a mean of 2293 kg ha- I while straw yield ranging<br />
from 1018 to 6662 kg ha- I and a mean of 3851 kg ha- I . This shows there is a significant<br />
difference in both grain and straw yields between the two seedbed types. This could be<br />
attributed to the extended rainfall situation, favoring the RF method of seedbed preparation<br />
which is planted late in the season (Table 1).<br />
46
On-farm demonstration ofimproved durum wheat varieties - Fasil et at.<br />
<strong>The</strong> results of both years showed that the mean grain yields ofRF seedbed out-yielded that of<br />
BBF by 54% and 120% for the first and second years, respectively. Also, the straw yields of<br />
RF seedbed exceeded that of BBF by 10% and 16% for the first and second years,<br />
respectively (Table 1).<br />
Grain and straw yields by sowing date: Both grain and straw yields varied with sowing date<br />
and the minimum grain yield was obtained when planting was done early during the second<br />
week of July with the maximum grain yield was obtained when planting was done during the<br />
third week of August (Table 1). This has to do, once again, with the prolonged rainfall<br />
situation that prevailed during the growing season.<br />
CONCLUSIONS<br />
In general, the improved drainage technology (BBF) production packages did not out yield<br />
the traditional (RF) system with local management practices. In fact, it rather significantly<br />
reduced the yield. This is against the previous findings that have shown better grain and straw<br />
yields using BBF technologies than RF and other traditional seedbed preparation methods.<br />
Hence, this study indicates the existence of a gap in the identification of appropriate<br />
conditions for utilization of the technology. This could be in terms of appropriate sowing<br />
date, availability of short rain for land preparation, appropriate site selection, intensity and<br />
distribution of rainfall, occurrence of frost and desiccating wind late in the season, etc. This<br />
makes the probability of failure of the technology which the subsistent fanners can not<br />
tolerate and hence wiU undermine the adoption of the technology. Among the participant<br />
farmers, those who had quite a long experience of the use of the technology acknowledged<br />
that the technology works when favorable conditions prevail. However, they reported that the<br />
two seasons were characterized by heavy rainfall that started late in the season, as a result of<br />
which the BBFs could not drain the water effectively. In addition, their activities like<br />
weeding were also constrained by the heavy and extended rainfall. Consequently, crop yield<br />
went far below expectation. <strong>The</strong>refore, the interaction of the technology and climatic and<br />
edaphic factors should be studied to further refine the technology for its wide adoption and<br />
positive impact.<br />
REFERENCES<br />
Hailu Gebre. 1988. Crop Agronomy Research on Vertisols in the Central Highlands of Ethiopia. pp. 321-333.<br />
In: Jutzi, S.c., McIntire, 1. and 1.E.S. Stares (eds.). Management of Vertisols in Sub-Saharan Africa.<br />
Addis Ababa: ILCA.<br />
Hailu Gebre Mariam. 1991. <strong>Wheat</strong> production and research in Ethiopia. pp. 1-15. In: Hailu Gebre Mariam,<br />
Tanner, D.G. and Mengistu Hulluka (eds.). <strong>Wheat</strong> Research in Ethiopia: A Historical Perspective.<br />
Addis Ababa: IARICIMMYT.<br />
Jutzi, S.c.; Anderson, F.M. and Abiye Astatke. 1986. Low-cost modifications of the traditional Ethiopian tine<br />
plough for land shaping and surface drainage of heavy clay soils: preliminary results from on farm<br />
verification trials. ILCA Bulletin 27:28031.<br />
Mesfin Abebe and S.c. Jutzi. 1993. <strong>The</strong> joint project on Vertisols management: Retrospect and Prospects. pp.<br />
147-157. In: Tekalign Mamo, Abiye Astatke, Srivastava, K.L. and Asgelil Dibabe (eds.). Improved<br />
Management of Vertisols for sustainable Crop-livestock production in the Ethiopian highlands:<br />
Synthesis report 1986-1992. Technical Committee of the Joint Vertisols Project, Addis Ababa,<br />
Ethiopia.<br />
47
On-farm demonstration ofimproved durum wheat varieties - Fasil et al.<br />
Questions and Answers:<br />
Efrem Bechere: Your result is contrary to what the Vertisol Project has established for the<br />
last 15 years. I feel uncomfortable with this result.<br />
Answer: That is why I brought this paper to this forum. Much is said about the BBF<br />
technology, but its adoption is very minimal. So, further research work is required to refine<br />
the technology.<br />
Mulugeta Mekuria: Your findings contradict the established advantages of the BBF,<br />
indicating RF (traditional farmers' practice) is superior. How was BBF recommended<br />
initially? Was it not compared with RF?<br />
Answer: Initially, it was recommended because of its yield advantage over the traditional<br />
practices including the RF method. But there is time and place where this technology doesn't<br />
work at all. So I wish to identify those factors, rather than giving a blanket recommendation<br />
for all Vertisol areas.<br />
Wolfgang H. Pfeiffer: (1) Concrete: which factors/components are you going to<br />
improve/change when you use/promote the BBF to farmers in the upcoming season? (2) Out<br />
of the 29 farmers who planted the demonstration - did some fanners realize higher yields<br />
with BBF?<br />
Answer: (1) I am afraid that I could not exactly identify the factors which should be<br />
improved because I am an agricultural extensionist. So I have to receive feedback from the<br />
respective scientists to do so and that is the purpose of this paper. (2) In fact, the yi eld range<br />
is different for different fanners but none of them was in favor of BBF.<br />
Table 1.<br />
Mean grain and straw yields (kg ha- l ) by seedbed type, sowing date and<br />
variety in Gimbichu for 1998and 1999 cropping seasons.<br />
Gnlin yield--<br />
Strawyleld<br />
PartiCular 1998/99 .1999/2QQO-" 1998/9.9. 1999/20.00<br />
Seedbed type<br />
RF 2382 2204 3726 3976<br />
BBF 1542 1001 4140 3424<br />
% decrease 54* 120* (-9) 16<br />
Sowing date<br />
Second week ofJuly 1297 1253 4348 3258<br />
Third week of July 1855 917 4038 3480<br />
Fourth week of July 1619 1381<br />
Second week of August 1666 2204 2894 3976<br />
Third week of august 2833 4236<br />
* Significant at the 5% level.<br />
48
IDENTIFICATION OF ETHIOPIAN WHEAT CULTIV ARS <br />
BY SEED STORAGE PROTEIN ELECTROPHORESIS <br />
Amsal Tarekegne, M.T. Labuschagne and H. Maartens<br />
Department of Plant Breeding, UOFS, P.O. Box 339, Bloemfontein 9300, South Africa<br />
ABSTRACT<br />
Cultivar identification in wheat is an increasingly important component of<br />
genetic improvement programs and germplasm management strategies,<br />
protection of Breeders' Rights, quality control and grain marketing. Protein<br />
composition is a valuable indicator of genotype genetic identity because<br />
protein synthesis is under direct genetic control. Single seeds of Ethiopian<br />
bread (15) and durum (10) wheat cultivars and lines were identified on the<br />
basis of gliadins and high molecular weight (HMW) and low molecular weight<br />
(LMW) glutenin subunit (GS) banding patterns separated by Sodium Dodecyl<br />
Sulfate - Polyacrylamide Gel Electrophoresis (SDS-PAGE). HMW-GS, failed<br />
to distinguish the cultivars adequately. Gliadin and LMW-GS banding patterns<br />
were unique for all cultivars and lines studi,ed, and hence were able to<br />
distinguish adequately between wheat genotypes. <strong>The</strong>refore, electrophoresis of<br />
seed storage proteins are useful in a cultivar development program for<br />
germplasm management, seed certification, quality control and registration of<br />
newly released wheat cultivars.<br />
INTRODUCTION<br />
<strong>The</strong> accurate description and identification of wheat cultivars is important for the milling and<br />
baking industry. Identity verification of plant is a prerequisite for germplasm management,<br />
genetics studies, success in breeding, and for the production of pure foundation and hybrid<br />
seed, and the certification process. Cultivar identification' will become of greater importance<br />
because of Plant Breeders' Rights.<br />
Traditionally, wheat cultivars are identified by evaluating the morphological characteristics<br />
of the seed and plant. Morphological characteristics, however, can be unreliable indicators of<br />
cultivar's identity. <strong>The</strong> genetic control of many morphological characteristics is assumed to<br />
be complex often involving epistatic interactions, or is often not well understood. Many<br />
morphological markers are recessive and therefore only expressed in the homozygous<br />
conditions. Furthermore, many morphological attributes are subjected to significant genotype<br />
x environment interaction. Hence, morphological appearance may not adequately describe<br />
cultivars without extensively replicated trials (Lin and Binns, 1984). An accurate and reliable<br />
method for distinguishing and characterizing wheat cultivars and lines is therefore necessary,<br />
Recently, biochemical markers have become a frequent method of ascertaining the identity of<br />
cereal cultivars (Cooke, 1984; Wrigley, 1992). As proteins are direct product of structural<br />
gene transcription and translation, protein series contain a wealth of genetic information<br />
(Wrigley, 1982, 1992). <strong>The</strong> endosperm proteins of wheat can be fractionated into albumin<br />
(extractable in water), globulin (extractable in saline water), gliadin (extractable in aqueous<br />
49
Identification o/Ethiopian wheat cultivars by electrophoresis - Amsal et al.<br />
alcohol soJutions), and glutenin (extractable in dilute acid or alkaline) (Wall, 1979). <strong>The</strong><br />
major storage proteins of wheat are gliadins and glutenin (Wall, 1979; Shewry et at., 1978).<br />
Glutenins have been shown to include high molecular weight (HMW-GS) (Payne et at.,<br />
1981) and low molecular weight glutenin subunits (LMW-GS) (Jackson et at., 1983). <strong>The</strong><br />
genes encoding the storage proteins are located at nine main loci and two minor loci on the<br />
homeologous chromosome groups 1 and 6 (Payne, 1987).<br />
<strong>The</strong> analysis of storage proteins by various electrophoretic techniques has been shown to be a<br />
valuable method of distinguishing cereal cultivars (Cooke, 1984; Shewary et at., 1978;<br />
Wrigley et at., 1982; Wrigley, 1992) and were demonstrated to be independent of site, year<br />
and generation of seed production (Marchylo and LaBerge, 1980; Zillman and Bushuk,<br />
1979). Polyacrylamid gel electrophoresis (PAGE) of these proteins is used worldwide as a<br />
practical means of identifying cultivars of wheat (Shewry et at., 1979, Jones et at., 1982;<br />
DeVilliers and Bosman, 1993; Zillman and Bushuk, 1979; Cooke et ai., 1992; Du Cross and<br />
Wrigley, 1979), barley (Marchylo and LaBerge, 1980; DeVilliers and Bosman, 1989), oats<br />
(Hassen et at., 1988; Lookhart, 1985), rice (Hussein et at., 1989) and maize (Wilson, 1985).<br />
Ethiopia is the second largest wheat producer, after South Africa, in Sub-Saharan Africa with<br />
more than 750,000 ha of bread and durum wheat. A large number of new varieties of both<br />
bread and durum wheat are being released from the national and regional breeding programs,<br />
making cultivar identification more difficult using traditional methods of seed morphology<br />
and plant appearance in the field. This paper presents results on identification of Ethiopiangrown<br />
wheat cultivars and lines based on SDS-PAGE electrophoresis of three classes of seed<br />
storage protein from single kernels.<br />
MATERIALS AND METHODS<br />
<strong>Wheat</strong> Cultivars<br />
A total of 25 Ethiopian wheat cultivars and advanced lines (15 bread wheat and 10 durum<br />
wheat) were examined for gliadin, HMW- and LMW-GS composition. Table 1 presents year<br />
of release, area of coverage, and crosses of wheat cultivars and lines studied. <strong>The</strong>se cultivars<br />
currently cover most of the area allotted to improved bread and durum wheats in Ethiopia; the<br />
advanced lines are derived from the breeding program and have good potential for future<br />
release. All wheat materials were kindly provided by the wheat improvement programs at<br />
Debre Zeit, Holetta and Kulumsa and were multiplied in the greenhouse in 1999 at the<br />
Orange Free State University, South Africa.<br />
Extraction of Storage Proteins<br />
<strong>The</strong> different storage proteins were extracted from six random single kernels from each wheat<br />
cultivar/lines. Kernels were individually crushed to a powder with a mortar and pestle. <strong>The</strong><br />
ground kernels were then placed in individual 1.5 ml eppendorf tubes.<br />
Glutenin protein extraction: <strong>The</strong> sequential extraction procedure of Singh et ai. (1991) was<br />
used to obtain HMW- and LMW-GS. In this procedure, gliadins were first extracted by<br />
heating in a 60°C in a waterbath for 1 hr. in 300 ~l 70% aqueous ethanol and was then<br />
removed. <strong>The</strong> residue in each eppendorf tube was then washed twice by adding 1 ml 50% n<br />
propanol, vortexed briefly, incubated in a 60°C in a waterbath for 30 min. and all n-propanol<br />
was sucked off after centrifugation at 10,000 rpm for 2 min. <strong>The</strong> HMW- and LMW-GS were<br />
50
Identification ofEthiopian wheat cultivars by electrophoresis - Amsal et al.<br />
extracted from the gliadin-free residue by incubating in a 60°C waterbath in 120 !-il<br />
extraction" buffer [50% n-propanol in O.OS M Tris-HCI (pH S.O) containing freshly added<br />
1.25% (w/v) dithiothreitol)]. After a brief initial vortexing, samples were again incubated in<br />
extraction buffer containing 0.17% 4-vinyl-pyridine. After centrifugation, the supernatant<br />
was collected in a new tube then mixed with an equal volume of sample loading buffer [O.OS<br />
M Tris-HCI (pHS.O), 20% (v/v) glycerol, 1.6% (w/v) SDS and 0.016% (w/v) bromophenol<br />
blue].<br />
Gliadin extraction: Gliadin proteins were extracted from ground single wheat kernels by<br />
incubating for 1 hr at 60°C in 300 !-il extraction buffer (18% urea consisting of 1 % 2<br />
mercapto-ethanol [2-Hydroxyethylmercaptan; p-Mercaptoethanol]), vortexed briefly at every<br />
30 min. interval, the supernatant was collected in a new tube and mixed with an equal volume<br />
of sample loading buffer.<br />
Polyacrylamide Gel Electrophoresis<br />
Sodium dodecyl sulphate-polyacrylamide gel electrophoresis (SDS-PAGE), as described by<br />
Maartens (1999), was performed on a vertical slab gel electrophoresis unit, Model SE 600<br />
System (Hoefer Scientific Instruments, San Francisco, CA). A separating gel of 10%<br />
acrylamide and 1.5% crosslinker and a stacking gel of 5.7% acrylamide and 1.2% cross linker<br />
concentration were used. <strong>For</strong>ty microliters of protein samples were loaded into the stacking<br />
gel sample wells with a disposable-tip micropipette. Gels were subject to electrophoresis for<br />
at least 3 hr at a constant current of 66 rnA per gel. During electrophoresis, the temperature of<br />
the system was controlled at 15°C by circulating water using Muititemp II <strong>The</strong>rmostatic<br />
Circular. <strong>The</strong> runs ~ere terminated when the tracking dye front had reached the opposite end<br />
of the gel.<br />
Gel Staining<br />
Gels were stained following the procedure developed by Wrigley (1992). Gels· were first<br />
immersed for at least 4 hr in a fixing solution composed of acetic acid, methanol and distilled<br />
water at 1 :4:5 ratio. <strong>The</strong>n, gels were stained overnight with a solution composed of 0.58%<br />
(w/v) Coomassie Brilliant Blue G 250 in a 14% (w/v) trichloroacetic acid containing 5%(v/v)<br />
methanol and 200-ml distilled water. <strong>The</strong> background coloration of the gel was removed by<br />
destaining the gels frequently in distilled water at room temperature before examination.<br />
Gel analysis and Interpretation<br />
<strong>For</strong> the identification of HMW-GS and allele classification at each of the Glu-l loci, the<br />
nomenclature proposed by Payne and Lawrence (1983) was used. Assignment of HMW-GS<br />
identification numbers was based on comparisons with assignments of the South African<br />
wheat cuitivars the standard varieties Tugela (2*, 1 +8, 5+ 10) and Verbeterde Kenia (1,<br />
17+18, 2+ 12).<br />
Gliadin and LMW-GS compositions of wheat cuitivars/lines, relative to the banding patterns<br />
of a reference cultivar Chinese spring, were analyzed using the Molecular Analyst Finger<br />
Printing System (BioRad Labs, Hercules, CA). <strong>The</strong> migration distance of proteins was<br />
determined from a densitometric curve of every replication of each cultivar. Only bands with<br />
intensity of more than 15 were accepted. Relative staining intensities of the bands were<br />
51
Identification ofEthiopian wheat cultivars by electrophoresis - Amsal et al.<br />
determined according Bushuk and Zillman (1978) on a 1 to 5 scale; the lightest bands were<br />
given a value of 1 and the darkest bands a value of 5.<br />
RESUL TS AND DISCUSSION<br />
HMW-GS composition: High degree of homogeneity is an important criterion for variety<br />
release, grain marketing and farmers' selection of cu1tivars. In this study, all genotypes<br />
examined were homogeneous for HMW-GS composition. <strong>The</strong> cultivars and lines grouped<br />
according to their Glu-l alleles are presented in Table 2. In bread wheat, nine Glu-l alleles<br />
were identified, three at Glu-Al, four at Glu-Bl and two at Glu-Dl. In durum wheat, six Glu<br />
1 alleles, one at Glu-Al and five at Glu-Bllocus were identified.<br />
On the basis of HMW-GS composition, the 15 bread wheat cultivars were divided into eight<br />
groups and the 10 durum wheat cultivars and lines in to five different groups. In both bread<br />
and durums, three groups were represented by three varieties each and one group in bread<br />
wheat was represented by two varieties. Four groups in bread wheat and two groups in durum<br />
wheat had only one cultivar each. In bread wheat, three groups carried subunit 1 and three<br />
others subunit 2* at the Glu-Al locus. Since the HMW subunit 2* at the Al locus and subunit<br />
2 at the D 1 locus co-migrate on 10% polyacrylamide gels, two groups of bread wheat were<br />
assigned subunit NuIV2*. At the Glu-Bl locus, three groups carried subunit 7+8, three others<br />
carried subunit 7+9, and two different groups carried subunits 6+8 and 17+ 18 each. At Glu<br />
D 1 locus, four groups coded for 2+12 subunit and all others coded for 5+10 subunits. In<br />
durum wheat each group coded for one subunit at Glu-Bl and all carried a null allele at Glu<br />
AI. Branlard et al. (1989) showed that over 80% of a collection of 404 durum wheat varieties<br />
lacked HMW-GS encoded at Glu-Al10cus, containing only subunits at Glu-Bl.<br />
LMW-GS composition: <strong>The</strong> LMW-GS banding patterns were related to the nomenclature<br />
system developed by Gupta and Shepherd (1988) for Australian wheat cultivars. Table 3<br />
presents different banding combinations for the 15 bread and 10 durum wheat cultivars and<br />
lines studied. <strong>The</strong> results indicated that all wheat cultivars/lines were adequately<br />
discriminated by LMW-GS profiles. <strong>The</strong> banding patterns of cv. Enkoy, Arendato, Foka,<br />
Kilinto and Quamy in group 2 and cvs. HAR 1685, HAR 710 and HAR 604 in group 3 did<br />
not match with any of the combinations in the nomenclature and hence were considered to be<br />
new combinations. Two banding combinations were expressed by three bread wheats<br />
(Mamba, Pavon 76 and Dashen) and three durum wheats (Arendato, Bahirseded and Boohai)<br />
cultivars in group 1. Most cultivars in both wheat species had combination 'f alone or<br />
combined with combination 'a', 'c' or 'b' in group 1. In groups 3, the second slow- and fastmoving<br />
bands did not appear in cv. HAR 1709 and DZ- 1640. In group 2, the third, the first<br />
and the second slow-moving bands respectively did not appear in K 6295-4A, Gara and HAR<br />
710 profiles. Kilinto and Quamy had combination 'f in group 1, but in group 2 the pattern<br />
did not match to anyone of the patterns in the nomenclature.<br />
Gliadin composition: <strong>The</strong> electrophoregram formulas of the gliadin proteins found in the<br />
different bread and durum wheat cultivars and advanced lines are presented in Tables 4 and 5.<br />
<strong>The</strong> catalogue indicated that cultivars/lines were readily identifiable by their electrophoretic<br />
pattern composed of number and relative mobility of gliadin bands in to the gel. <strong>The</strong><br />
electrophoregrams ofbread and durum wheat were clearly different from each other. None of<br />
the durum wheat cultivars/lines contained ~ny gliadins that migrated less than 15 units on<br />
relative mobility scale into the gels. Whereas all bread wheat cultivars had at least one band<br />
that moved 12 units or less in to the gels. This was attributed to the fact that durum wheats<br />
52
Identification ofEthiopian wheat cultivars by electrophoresis - Amsal et al.<br />
lack the D genome, which is known to control the synthesis of several gliadins in bread<br />
wheats. A total of 31 and 30 gliadin bands were found in bread and durum wheat<br />
cultivars/lines, respectively. In both bread and durum wheats, the slow-moving bands were<br />
the darkest and the fast-moving bands were the lightest in the intensity. <strong>The</strong>refore, faint bands<br />
should not be used for cultivar identification purposes. Similarly, De Villiers and Bosman<br />
(1993) studying South African wheat cultivars have suggested that band intensities, as they<br />
are influenced by protein content, should not be used for cultivar identification unless equal<br />
amount of proteins across cultivars are used. In this study, we did not use an equal amounts<br />
of proteins for all cultivars and, hence, band intensities should only be used to indicate the<br />
presence and concentration of a protein band at a specific position on mobility scale in the<br />
gel.<br />
CONCLUSIONS<br />
Visual identification of wheat cultivars has become increasingly difficult because of<br />
similarity in seed morphology and plant appearance in the field. Electrophoresis of storage<br />
proteins provides protein patterns, which can be used to distinguish easily between cultivars<br />
or lines. In this study, a total of 25 Ethiopian wheat cultivars and lines were identified based<br />
on their protein banding patterns in SDS-PAGE electrophoresis. Accordingly, LMW-GS and<br />
gliadin electrophoresis adequately identified all wheat cultivars studied because each cultivar<br />
had a unique banding pattern of these proteins. <strong>The</strong> HMW -GS, however, classified 15 bread<br />
wheat cultivars into eight groups and 10 durum wheat cultivars and lines in to five groups.<br />
Electrophoresis of seed storage proteins has been shown to be operationally simple, fast,<br />
reasonable in cost, and allow purity analysis on individual seeds. It has also been indicated as<br />
a useful tool to plant breeders, certification seed enforcement agencies and millers because<br />
electrophoresis of storage proteins provide an accurate and reliable means for achieving<br />
varietal identity, distinction and uniformity with a particular commercial value. <strong>The</strong> banding<br />
patterns of proteins also provide detailed information of germplasm, investigation of pedigree<br />
relationships, checking of pedigree validity, assessment of genotypic purity and possible<br />
prediction of heterotic combinations. Hence, application of storage protein electrophoretic<br />
technique would be of great importance to the Ethiopi~ wheat improvement program to<br />
facilitate cultivar development, germplasm management, seed certification, quality r.ontrol<br />
and registration of new cultivar releases.<br />
ACKNOWLEDGEMENT<br />
<strong>The</strong> authors wish to thank researchers in Ethiopian wheat improvement program at Debre<br />
Zeit, Holetta and Kulumsa R.C. for providing wheat cultivars and lines. CIMMYT/CIDA and<br />
CIMMYT/EU financed this study in cooperation with Ethiopian Agricultural Research<br />
Organization CEARO) and the Department of Plant Breeding, <strong>The</strong> Orange Free State<br />
University, South Africa.<br />
REFERENCES<br />
Branlard, G., Autran, le. and P. Monnveax. 1989. High molecular weight glutenin subunit in durum wheat (T.<br />
durnm). <strong>The</strong>or. Applied. Genet. 78:353-358.<br />
Bushuk, W. and R.R. Zillman. 1978. <strong>Wheat</strong> cultivar identification by gliadin electrophoregrams. I. Apparatus,<br />
method and nomenclature. Can. J. Plant Sci. 58: 50S-SIS.<br />
Cooke, RJ. 1984. <strong>The</strong> characterization and identification of crop varieties by electrophoresis. Electrophoresis 5:<br />
59-72.<br />
53
Identification ofEthiopian wheat cultivars by electrophoresis - Amsal et al.<br />
Du Cros, D.C. and C.W. Wrigley, 1979. Improved electrophoretic methods for identifying cereal varieties. J.<br />
Sci. Food Agric. 30: 785-794.<br />
De Villiers, O.T. and M. Bosman. 1993. <strong>Wheat</strong> cultivar identification by electrophoretic analysis of gliadin<br />
proteins. S. Ajr. J. Plant Soil, 10: 99-104.<br />
De Villiers, O.T. and E. W. Laubscher. 1989. Barley cultivar identification by acid polyacrylamide gel<br />
electrophoresis of hordein proteins. S .Ajr. J. Plant Soil, 6(1):70-74.<br />
Gupta, R.B. and K. W. Shepherd. 1988. Low-molecular-weight glutenin subunits in wheat: <strong>The</strong>ir variation,<br />
inheritance and association with bread-making quality. pp. 943-949. In: Proc. i" Int. <strong>Wheat</strong> Genet.<br />
Symp. Miller, T.E. and R.M.D. Koebner (eds.). Cambridge, England. Cambridge, u.K.: Institute of<br />
Plant Science Research.<br />
Hussein, A., Scanlon, M.G., Juliano, B.O. and W. Bushuk. 1989. Discrimination of rice cultivars by<br />
polyacrylamid gel electrophoresis and high-performance liquid chromotography. Cereal Chem. 66:<br />
353-356.<br />
Hassen, A.E., Nassuth, A. and I. Altosaar. 1988. Rapid electrophoresis of oat (Avena sativa L.) prolamines from<br />
single seeds for cultivar identification. Cereal Chem. 65 : 153-154.<br />
Jackson, E.A., Holt, L.M. and P.I. Payne. 1983. Characterization of high-molecular-weight gliadin and lowmolecular-weight<br />
glutenin subunits of wheat endosperm by two-dimensional electrophoresis and the<br />
chromosomal localization of their controlling genes. <strong>The</strong>or. Appl. Genet. 66: 29-37.<br />
Jones, B.J., Lookhart, G.L., Hall, S.B. and K.F. Finney. 1982. Identification of wheat cultivars by gliadin<br />
electrophoresis: Electrophoregrams of the 88 wheat cultivars most commonly grown in the United<br />
States in 1979. Cereal Chem. 59: 181-188.<br />
Lin, C.S. and M.R. Binns. 1984. <strong>The</strong> precision of cultivar trials within eastern cooperative tests. Can. J. Plant<br />
Sci. 64: 586-591.<br />
Lookhart, G.L. 1985. Identification of oat cultivars by combined polyacrylamide gel electrophoresis and<br />
reversed-phase high performance liquid chromotography. Cereal Chem. 62: 345-350.<br />
Maartens, H. 1999. <strong>The</strong> inheritance and genetic expression of low molecular weight glutenin subunits in South<br />
African wheat cultivars. Ph.D. thesis. <strong>The</strong> Orange Free State University, SA. Pp. 212.<br />
Marchylo, B.A. and D.E. LaBerge. 1980. Barley cuItivar identification by electrophoretic analysis ofhorde in<br />
proteins. I. Extraction and separation of hordein proteins and environmental effects of the hordein<br />
electrophoregram. Can. J. Plant Sci. 60: 1343-1350.<br />
Payne, P.I. 1987. Genetics' of wheat storage proteins and the effect of allelic variation on bread-making quality.<br />
Ann. Rev. Plant Physiol., 38: 141-153.<br />
Payne, P.I. and G.J. Lawrence. 1983. Catalogue of alleles for the complete gene loci, Glu-Al, Glu-B I and Glu<br />
D 1, which code for high molecular weight subunits ofglutenin in hexaploid wheat. Cereal Research<br />
Communication 11: 29-34.<br />
Payne, P.I., Holt, L.M. and C.N. Law. 1981. Structural and genetical studies on the high-molecular-weight<br />
subunits of wheat gluten. Part I. Allelic variation in subunits amongst varieties of wheat (Triticum<br />
aestivum). <strong>The</strong>or. Appl. Genet. 60: 229-236.<br />
Shewry, P.R., Faulks, A.J., Pratt, M. and B.1. Miflin. 1978. <strong>The</strong> varietal identification of single seeds of wheat<br />
by sodium dodecyl-sulphate polyacrylamide gel electrophoresis of gliadin. J. Sci. Food Agric. 29: 847<br />
849.<br />
Singh, N.K., Shepherd, K.W. and G.B. Cornish. 1991. A simple SDS-PAGE procedure for separating LMW<br />
subunits of glutenin. J. Cereal Sci. 14: 203-208.<br />
Wall, J.S. 1979. <strong>The</strong> role of wheat proteins in determining baking quality. pp. 275-311. In: Laidman, D.L. and<br />
R.G. Wyn Jones (eds.). Recent Advances in the Biochemistry of Cereals. Academic Press, London,<br />
New York.<br />
Wilson, C.M. 1985 . A nomenclature for zein polypeptides based on isoelectric focusing on sodium dodecyl<br />
sulphate polyacrylamide gel electrophoresis. Cereal Chem., 62: 361-365.<br />
Wrigley, C.W. 1982. <strong>The</strong> use of genetics in understanding protein composition and grain quality in wheat. Qual.<br />
Plant Foods Human Nutr. 31: 205-227.<br />
Wrigley, C.W. 1992. Identification of cereal varieties by gel electrophoresis. pp. 17-41. In : Seed Analysis:<br />
Modem Methods of Plant Analysis. Volume 14. Linskens, H.F. and J.F. Jackson (eds.). Springer<br />
Verlog, Berlin, Heidelberg.<br />
Wrigley, C.W., Autran, J.C. and W. Bushuk. 1982. Identification of cereal varieties by gel electrophoresis of the<br />
grain proteins. Advances in Cereal Science Technology 5: 211-259.<br />
ZiIlman, R.R. and W. Bushuk. 1979. <strong>Wheat</strong> cultivar identification by gliadin electrophoresis. III. Catalogue of<br />
electrophoregram formulas of Canadian wheat cultivars. Can. J. Plant Sci. 59: 287-298.<br />
54
Identification 0/Ethiopian wheat cultivars by electrophoresis - Amsal et al.<br />
Table 1.<br />
Year of registration, production status and crosses of bread and durum<br />
wheat cultivars and Hnes studied.<br />
Y~ar of<br />
n:g!,~tr-<br />
Prod-<br />
' .<br />
_.<br />
ucti,on ,<br />
I.·""" .... _<br />
- ...<br />
"<br />
.",<br />
Cultiyar ation status "<br />
.'<br />
Bread wheat<br />
ET-13 1981<br />
HAR 1709 1993<br />
K 6290-Bulk 1977<br />
K 629S-4A 1980<br />
Enkoy 1974<br />
Kanga 1973<br />
Romany B.c. 1974<br />
Mamba 1971<br />
Pavon 76 1982<br />
Dashen 1984<br />
Batu 1984<br />
Gara 1984<br />
HAR 1685 1994<br />
HAR 710 1995<br />
HAR 604 1994<br />
Durum wheat<br />
Arendato 1967 S<br />
Bahirseded ----- S<br />
Boohai 1982 S<br />
Foka 1993 S<br />
Kilinto 1994 S<br />
Quamy 1996 S ---<br />
Gerardo 1976 S<br />
Cocorit 71 1976 S<br />
DZ-575 ~ 1995+<br />
DZ-1640 ~ 1998+<br />
* S = slgmficant area coverage; N = non-slgmficant area coverage<br />
+Candidate for release<br />
'. , "<br />
;;~ ~:: c.ross ·<br />
S* UQ 1OS sel. x Enkoy<br />
S BOW28IRBC<br />
S (AF.MA YO x GEM) x Romany<br />
S Romany x GB-Gamenya<br />
N JHEBRAND sel.L(WIS 245xSUP SI)lx[(FR-FNN).A)<br />
N MENCO x (WIS 24S x SUP 51)/(FR-FNNfA<br />
N ----<br />
N (AF.MY48/wIS 245 x SUP SI)x(FR-FNN)2.A<br />
S VCM//CNO"S"I7C/3IKALiBB<br />
N/S KVZIBUHO"S"//KAL/BB<br />
N GLLlCUC"S"/KVZ/SK<br />
N AU/IKALIBB/3/WOP"S"<br />
S NDVG9144/IKALIBB/3NACO"S"/4NEE"S"<br />
S MRL"S"/BUC"S"<br />
S 4777(2)/IFKN/GB/3IPVN"S"<br />
Landrace<br />
Landrace<br />
CR"S"121563/61-130 x LDS)Candeal II<br />
Cocorit 711Candeal II<br />
Illumilo/SNRA T 69/lBoohai/3IHoraiJorro/4/CIT<br />
Gerardo VZ 466/61-130 x LdS x GII"S"<br />
RAE/4 TC60// TW 63/3/3/AA<br />
-- Boohai/GDO DZ 466/61-130 KGU"S"<br />
-- HoraiCIT"S"//Joo"S"/GS"S"/3/Soo"S"/4IHoraiRespinegro//CM9908/3/RHUM<br />
55
Identification ofEthiopian wheat cultivars by electrophoresis - Amsal et al.<br />
Table 2.<br />
HMW composition of Ethiopian bread and durum wheat cultivars.<br />
lA -,<br />
Group,' "<br />
1 1<br />
2 1<br />
3 1<br />
4 2*<br />
5 2*<br />
6 2*<br />
7 Nu1ll2*<br />
8 Null/2*<br />
1 Null<br />
2 Null<br />
3 Null<br />
4 Null<br />
5 Null<br />
HMWsubunits . ,<br />
lB ,ID<br />
.<br />
Brea(Lwheat : '.<br />
6+8 2+12<br />
7+8 2+12<br />
7+9 5+10<br />
7+8 5+10<br />
7+9 5+10<br />
17+18 5+10<br />
7+8 2+12<br />
7+9 2+12<br />
Durum wheat<br />
6+8<br />
7+8<br />
17+18<br />
13+16<br />
23+22<br />
~~.~ ,<br />
"Cultivar<br />
Enkoy<br />
K 6295-4A<br />
Dashen,<br />
K 6290-Bulk, Kanga, Mamba<br />
Batu, Gara, HAR 1685<br />
Pavon 76, HAR 710, HAR 604<br />
ET-13, Romany B.c.<br />
HAR 1709<br />
Kilinto, Gerardo, Cocorit 71<br />
Arendato, Bahirseded<br />
Boohai, Foka, Quamy<br />
DZ-575<br />
DZ-1640<br />
56
Identification ofEthiopian wheat cultivars by electrophoresis - Amsal et al.<br />
Table 3.<br />
LMW composition of Ethiopian bread and durum wheat cultivars.<br />
Cultivar<br />
ET-13<br />
HAR 1709<br />
K 6290-Bulk<br />
K 6295-4A<br />
Enkoy<br />
Kanga<br />
Romany B.C<br />
I Mamba<br />
Pavon 76<br />
Dashen<br />
Batu<br />
Gara<br />
HAR 1685<br />
HAR 710<br />
HAR604<br />
Arendato<br />
Bahirseded<br />
Boohai<br />
Foka<br />
Kilinto<br />
Quamy<br />
Gerardo<br />
Coeorit 71<br />
Dz-575<br />
Dz-1640<br />
3A<br />
a<br />
a<br />
f<br />
f<br />
e<br />
b<br />
e<br />
elf<br />
b/e<br />
b/f<br />
f<br />
b<br />
b<br />
e<br />
f<br />
elf<br />
a/f<br />
elf<br />
b<br />
f<br />
f<br />
b<br />
f<br />
e<br />
b<br />
. LMW subunits ·.<br />
3B<br />
Bread wheat<br />
e<br />
e<br />
e<br />
a<br />
e<br />
g<br />
g<br />
e<br />
f<br />
a<br />
a<br />
g<br />
b<br />
e<br />
Durum wheat<br />
3D<br />
e<br />
b<br />
b<br />
e<br />
- e<br />
-<br />
g<br />
f<br />
-<br />
-<br />
-<br />
e<br />
e<br />
g<br />
g<br />
a<br />
a<br />
b<br />
a<br />
d<br />
b<br />
e<br />
-<br />
-<br />
-<br />
57
Identification ojEthiopian wheat cultivars by electrophoresis - Amsal et al.<br />
Table 4. Electrophoretic formulae of gliadin of Ethiopian bread wheats.<br />
Mobility of bands relative to Chinese Spring standard bands<br />
30 40 50 60 70 80 90 100 110 120 130 140 150 160 170 180 190 200<br />
Cultivar<br />
II I I I II I I I II I I I II I I I II I I I II I I I II I I I II I I I II I I I II I I I II I I I II I I I II I I I II I I I II I I I II I , , I, I , I I<br />
Et-13 5+ 5 5 3 3 2 3 3 2 2 2 3 2<br />
HAR 1709 5 4 5 2 2 2 2 2 2 2<br />
K6290-bulk 5 5 5 2 3 3 2 2 2 2 2 2<br />
K6295-4A 5 5 5 3 3 2 2 2 2 2<br />
Enkoy 5 4 4 5 4 5 2 2 2 2 2 2 2 2 2 2 , I<br />
Kanga 5 4 5 2 2 2 2 2 2 2 2 2 2 2<br />
Romany B.C 5 5 5 2 2 2 2 2 2 2<br />
Mamba 5 5 5 5 2 3 2 2 2 2<br />
Pavon 76 5 5 5 3 2 2 2 2 2 2 2<br />
Dashen 4 5 5 5 2 4 2 2 2 2 2 2<br />
Batu 5 5 5 2 3 2 2 2 2 2 2<br />
Gara 5 5 5 2 2 2<br />
HAR 1685 5 5 5 3 2 3 2 2 2 2 2 2 3 2 2<br />
HAR 710 5 5 5 2 3 2 2 2 2<br />
HAR604 5 5 5 3 2 2 2 I 1 2 1 1 2 2<br />
I, I I , I' , , , II , , , I' , , , I' , , , I' , , , I' , , , I' , , , I' , , , I' , , , I' , , , I' , , , I' , , , I' , , , I' , , , I' , , , I' , , , I<br />
30 40 50 60 70 80 90 100 110 120 130 140 150 160 170 180 190 200<br />
+Relative band intensity, 1 represents the lightest band and 5 represent the darkest band. Scales at the top and bottom of the table indicate position of band on gel.<br />
58
Identification ofEthiopian wheat cultivars by electrophoresis - Amsal et al.<br />
Table 5. Electrophoretic formulae of gliadin of Ethiopian durum wheats.<br />
Mobility of bands relative to Chinese Spring standard band<br />
Cultivar<br />
40 50 60 70 80 90 100 110 120 130 140 150 160 170 180 190 rOO<br />
I, , , , I, , , I II I I I I, , , , I, , I , I, I , , I, , , , I, , , , I, , , , I, , , , I, , , , I, , , , I, , , , II I I I I I I I II II I<br />
Arendato 5 5 2 2 2 2 2 2 3 3 2 2 2<br />
Bahirseded 5+<br />
5 2 3 2 2 2 2 2 2 2 2<br />
Boohai 5 4 3 2 3 3 2 2 2 2<br />
Foka 5 4 2 3 2 2 2 2 2 2<br />
Kilinto 5 5 5 3 3 3 2 2 4 2 2 2 3<br />
Quarny 5 3 4 1 1 2 3 2 2 2 2 4<br />
Gerardo 5 5 5 3 3 3 2 3 2 2 1 2<br />
Cocorit 5 5 4 5 2 3 3 4 2 2 2 2 2<br />
DZ-575 5 4 3 2 3 2 3 2 2 2 2 2 2 2<br />
DZ-1640 5 1 3 1 1 2 3 1 2 3 1 1 1 2 1 2 2<br />
II , I , II , , I II I , , I' , , I II I , , II I I , I' , , , I' I I I I' , I , I' I I I II , I , II I I I II I I I II I I I II I I , II I I I I<br />
40 50 60 70 80 90 100 110 120 130 140 150 160 170 180 190 200<br />
+Relative band intensity, 1 represents the lightest band and 5 represent the darkest band. Scales at the top and bottom of the table indicate position of band on gel.<br />
59
GENETIC IMPROVEMENT IN GRAIN YIELD AND ASSOCIATED CHANGES <br />
IN TRAITS OF BREAD WHEAT CULTIVARS IN THE SUDAN <br />
Izzat S.A. Tahir l , Abdalla B. Elahmedi l, Abu EI Hassan S. Ibrahim 2 and O.S. Abdalla 3<br />
lAgricultural Research Corporation (ARC), P.O. Box 126, Wad Medani, Sudan<br />
2University of Gezira, Faculty of Agricultural Sciences, P.O. Box 20, Wad Medani, Sudan<br />
3 <br />
CIMMYT/ICARDA, P.O. Box 5466, Aleppo, Syria<br />
ABSTRACT<br />
This study was conducted for two seasons (1997/98 and 1998/99) at Gezira<br />
Research Station Farm, Wad Medani, Sudan. <strong>The</strong> objectives of the study were<br />
to estimate progress in genetic improvement of bread wheat (Triticum<br />
aestivum L.) grain yield, under a heat-stress environments, and identify<br />
changes in traits associated with grain yield improvement. Seven bread wheat<br />
cultivars released in Sudan from 1960 to 1990 were tested. Yield potential had<br />
increased from 2523.5 kg ha· l in 1960 to 3294.8 kg ha- l in 1990. Linear<br />
regression of culti var means on years-of-release showed an increase of 25.7 kg<br />
ha- l yr-l(r= 0.55, P< 0.01) in grain yield. This increase in yield was associated<br />
with increases of 0.19g i<br />
l<br />
in 1000-grain weight, 0.24% yr-l in harvest index,<br />
0.19 day yr-l in grain-fill duration, and a reduction of 0.21 day year- l in<br />
duration to anthesis. Considerable progress has been achieved in wheat<br />
improvement under heat stress, and breeders have modified a number of traits<br />
while selecting for yield per se.<br />
INTRODUCTION<br />
<strong>The</strong> understanding of changes resulting from selection for grain yield and its deteITIlinants, by<br />
studying the behavior of cultivars released over time, cOl!ld be useful in detennining future<br />
selection criteria (Slafer and Andrade, 1991). Analysis of long-term records from cultivar<br />
trials and from simultaneous studies of historical genotypes has indicated tha~ genotypic<br />
change has made a substantial contribution to the increases in wheat yields (Abbate et ai.,<br />
1998; Austin et ai., 1980; Cox et ai., 1988; Hucl and Baker, 1987; Sayre et ai., 1997;<br />
Siddique et ai., 1989a, b; Slafer and Andrade, 1989; Waddington et ai., 1986).<br />
In the Sudan, wheat production traces back more than 2000 years, but until the 1940s, it has<br />
been restricted to Northern Sudan (16-22° N). Due to increased demand, wheat production<br />
has extended southwards to non-traditional areas. <strong>The</strong>se new areas are located in the central<br />
and eastern irrigated clay plains, which include Gezira, Rahad, New Haifa, White and Blue<br />
Nile schemes. <strong>Wheat</strong>-growing season in these non-traditional wheat areas is short (90-100<br />
days), and normally with high temperatures during the early and late stages of crop<br />
development.<br />
In 1956, a wheat breeding program was initiated in the Sudan to identify adapted cultivars<br />
(Elahmadi, 1996). In the past three decades, a local hybridization program, in collaboration<br />
with CIMMYT and ICARDA, and national and regional programs, has resulted in the release<br />
of adapted varieties that have allowed the expansion of wheat production southward.<br />
60
Genetic improvement in wheat grain yield in Sudan - Tahir et af.<br />
However, limited information is available on changes in traits associated with yield<br />
improvements under hot environments in the Sudan. Thus the objectives of this study were to<br />
(a) estimate progress in genetic improvement of grain yield in bread wheat under heat stress<br />
environments, and (b) identify changes in traits associated with grain yield improvement.<br />
MATERIALS AND METHODS<br />
This study was carried out during two years, 1997/98 - 1998/99, at the Gezira Research Farm<br />
(GRF), Agricultural Research Corporation (ARC), Wad Medani, located on the clay plain of<br />
the central Sudan (14°24/N, 33 0 29/ E, 407 m a.s.1.). <strong>The</strong> soils ofGRF are cracking heavy clay<br />
Vertisols, with very low water permeability, pH of ~ 8.5, poor in organic matter (0.5%),<br />
deficient in nitrogen (300-400 ppm), and low in available phosphorus (4-5 ppm Olsen<br />
extractable P).<br />
Seven bread wheat cultivars that were released in the Sudan, representing different origin and<br />
eras of wheat improvement, were used. Details on name, origin, cross, and year of release of<br />
these cultivars are given in Table 1. Three sowing dates; early, optimum, and late (1 st and 3 rd<br />
weeks of November, and the 2 nd week of December respectively) were used during both<br />
seasons of the study. A three-replicate, split-plot design, with sowing dates as main plots and<br />
genotypes as sub-plots, was used. Seeding was done manually in rows 20 cm apart and the<br />
plots consisted of six row?, 5 m in length. <strong>The</strong> seeding rate used was 120 kg ha- 1 •<br />
Recommended agronomic packages were applied. No serious lodging or disease incidence<br />
was reported. In the first season, due to termite incidence, plots were sprayed and dusted with<br />
insecticides: Confidor (imidacloprid 20% EC) and Sevin (carbaryl 85%WP). In the second<br />
season, seeds were dressed with a fungicide-insecticide mixture containing Raxil<br />
(pencycuron 7.5% WP) and Gaucho (imidacloprid 35% WP) for the control of termites and<br />
aphids.<br />
Data recorded included days to flowering, physiological maturity, plant height, grains spike-',<br />
thousand grain weight, and spikes m- 2 . Excluding the two border rows and 0.5 m from each<br />
end, a net area of 3.2 m 2 (four rows by 4 m) was hand-harvested from the ground level. <strong>The</strong><br />
harvested material was bundled and left to dry for at leas~ 10 days, then weighed, threshed<br />
and the grain was weighed again to give biomass and grain yield. Harvest index, grains m- 2 ,<br />
and grain-fill duration were calculated.<br />
Analysis of variance was conducted for each season separately, as well as combined analysis<br />
over the two seasons. Means were compared using Tukey's test. Rate of increase in grain<br />
yield, as well as rate of changes in other associated traits, were estimated by regression<br />
analysis.<br />
RESULTS AND DISCUSSION<br />
Combined analysis of variance over sowing dates and seasons showed significant differences<br />
between cultivars for grain yield, biomass, harvest index, grams m- 2 , spikes m- 2 , grains<br />
spike-I, 1000 grain weight and grain-fill duration (Table 2).<br />
Based on the linear regression of mean grain yield of cultivars (at each sowing date over<br />
seasons) on year of release, grain yield has increased from 2523.5 kg ha- I in 1960 to 3294.8<br />
kg ha-' in 1990. This relationship was described by the following linear regression equation:<br />
61
Genetic improvement in wheat grain yield in Sudan - Tahir et al.<br />
y = 2523.9 + 25.711x, (R 2 = 0.30, P
Genetic improvement in wheat grain yield in Sudan - Tahir et al.<br />
REFERENCES<br />
Abbate, P.E., Andrade, F.H., Lazaro, L., Bariffi, 1.H., Berardocco, H.G., Inza, V.H. and F. Marturano. 1998.<br />
Grain yield increase in recent Argentine wheat cultivars. Crop Sci. 38: 1203-1209.<br />
Austin, R.B., Bingham, 1., BJackwell, R.D., Evans, L.T., <strong>For</strong>d, M.A., Morgan, c.L. and M. Taylor. 1980.<br />
Genetic improvements in winter wheat since 1900 and associated physiological changes. J. Agric. Sci.<br />
94: 675-689.<br />
Cox, T.S., Shroyer, J.P., Ben-Hui, L., Sears, R.G. and T.1. Martin. 1988. Genetic improvement in agronomic<br />
traits of hard winter wheat cultivars from 1919 to 1987. Crop Sci. 28: 756-760.<br />
Elahmadi, A.B. 1996. Review of wheat breedjng in the Sudan. pp. 33-53. In: Ageeb, O.A., Elahmadi, A.B.,<br />
Solh, M.B. and M.C. Saxena (eds.). <strong>Wheat</strong> production and improvement in the Sudan. Proceedings of<br />
the National Research Review <strong>Workshop</strong>, 27-30 August 1995, Wad Medani, Sudan.<br />
ICARDAJAgricultural Research Corporation. ICARDA: Aleppo, Syria.<br />
Hucl, P., and RJ. Baker. 1987. A study of ancestral and modem Canadian spring wheats. Can. J. Plant Sci. 67:<br />
87-97.<br />
Loss, S.P., E.1. Kirby, M., Siddique, K.H.M. and M.W. Perry. 1989. Grain growth and development of old and<br />
modem Australian wheats. Field Crops Res. 21: l31-146.<br />
Sayre, K.D., Rajaram, S. and R.A. Fischer. 1997. Yield potential progress in short bread wheats in northwest<br />
Mexico. Crop Sci. 37: 36-42.<br />
Siddique, K.H.M., Belford, R.K. and M.W. Perry. 1989a. Ear-to-stem ratio in old and modem wheats;<br />
relationship with improvement in number of grains per ear and yield. Field Crops Res. 21: 59-78.<br />
Siddique, K.H.M., Belford, R.K., Perry, M.W. and D. Tennant. 1989b. Growth, development and light<br />
interception of old and modern wheat cultivars in a Mediterranean-type environment. Aust. J. Agric.<br />
Res. 40: 473-487.<br />
Slafer, G .A., and F.H. Andrade. 1989. Genetic improvement in bread wheat (Triticum aestivum) yield in<br />
Argentina. Field Crops Res. 21 :289-296.<br />
Slafer, G.A, and F.H. Andrade. 1991. Changes in physiological attributes of the dry matter economy of bread<br />
wheat (Triticum aestivum) through genetic improvement of grain yield potential at different regions of<br />
the world. Euphytica. 58: 37-49.<br />
Slafer, G.A., Satorre, E.H. and F.H. Andrade. 1994. Increases in grain yield in bread wheat from breeding and<br />
associated physiological changes. pp. 1-68. In: Slafer, G.A (ed.). Genetic Improvement ofField<br />
Crops. Marcel Dekker, Inc. New York.<br />
Waddington, S.R., Ransom, J.K., Osmanzai, M. and D.A Saunders. 1986. Improvement in the yield potential of<br />
bread wheat adapted to northwest Mexico. Crop Sci. 26: 698-703.<br />
63
Genetic improvement in wheat grain yield in Sudan - Tahir et al.<br />
Table 1.<br />
Name, origin, year of release and cross of the wheat genotypes used in the<br />
study.<br />
Genotype Origin ,Year of Cross<br />
. release<br />
Beladi Local 1960 3 Historic cultivar<br />
FaJchetto Italv 1968 Falcone/Lauro Bassi<br />
Giza 155 Egypt 1971 Meda CadetiHindi 62//Regentl3/*2 Giza 139<br />
Mexicani Mexico 1972 Lerma Rojo/Norin 10-Brevor//3* Andes Enano<br />
Condor Australia 1978 Penjamo 60/4* Gabo 56/rrenzanos Pintos Precoz/ Nainari<br />
60/4/2* Lerma Rojo/lNorin 10/Brevor (seln 14)/3/3*<br />
Andes<br />
Debeira India 1982 Hybrid Delhi 160/5/TobarilCiano/23854/3INainari 60//<br />
Titmouse/Sonora 64/4/Lerma Rojo/Sonora 64<br />
El Nielain Mexico 1990 S948.A 1/7* Santa Elena<br />
a Estimated date of cultlvar Baladl.<br />
Table 2.<br />
Means of grain yield and some agronomic traits of seven bread wheat<br />
genotypes evaluated for two seasons (1997/98 and 1998/99) at Gezira<br />
Research Farm, Wad Medani, Sudan.<br />
Grain Harvest Grains Grain-fiU<br />
2<br />
Genotype yield§ Biomass index Grain m~2 Spikes m- spike-I 1000- duration<br />
grain<br />
(kg ba"l) .. (kg ba- 1 ) (%) (No.) (No.) (No.) (g) (days)<br />
Beladi 2422f 7678ab 31.2e 8997bc 545bc 40c 27.5de 32.1ef<br />
FaJchetto 2809bcde 7644ab 36.6cd 9394bc 464g 44b 30.6bc 33.4cd<br />
Giza 155 2556ef 7869ab 32.4e 9394bc 539bcJ 38c 28 .9cd 33.7c<br />
Mexicani 3134a 7522b 41.8ab 10691a 567b 39c 30.1bc 33.3cd<br />
Condor 3106ab 7422b 42.2a 10024ab 612a 37c 31.9ab 35.5b<br />
Debeira 2984abc 8063ab 36.9cd 9780ab 515cde 43b 31.1bc 32.5de<br />
El Nielain 3247a 8319a 39.0bc 9833ab 509def 46b 34.0a 39.9a<br />
Mean 2894 7788 37.2 9730 536 41 30.6 34.3<br />
C.V.(%) 12.6 10.9 7.3 13.3 6.3 7.0 9.1 4.7<br />
§<br />
Numbers followed by the same letter(s) In the same column are not sIgmficantly dIfferent at<br />
the probability level of 0.05 according to Tukey's test.<br />
64
Genetic improvement in wheat grain yield in Sudan - Tahir et aI_<br />
3800 l<br />
3600 ~<br />
•<br />
- [<br />
•<br />
3400 -1<br />
•<br />
.... - 3200 j<br />
.~<br />
•<br />
•<br />
•<br />
J:<br />
en<br />
•<br />
3000 •<br />
y =2523.5 + 25.711x<br />
-~<br />
"C<br />
CI><br />
• R2 = 0.3024**<br />
':;' 2800 r =0.55**<br />
s:::::<br />
•<br />
•<br />
~<br />
~<br />
(!) 2600<br />
2400 • •<br />
t<br />
1 •<br />
2200 l'<br />
2000 - --- 1 - ,----- - , ---- .·-·-- -'-- 1 - ----,--<br />
o 5 10 15 20 25 30 35<br />
Number of years since 1960<br />
Figure 1. Relationship between grain yield and year of<br />
release of seven bread wheat cultivars grown in three<br />
sowing dates for two seasons 1997/98 and 1998/99<br />
65
(;p.np.tir. imnrovp.mp.nl in WhP.fll grain yield in Sudan - Tahir et al.<br />
,<br />
50 -I<br />
37<br />
I<br />
(b)<br />
1<br />
~a4 27.81 + 0.1934x Y = 33.714 + 0.2389x<br />
I<br />
RZ = 0.5737 RZ = 0.2827<br />
r = 0.76" r = 0.53"<br />
35<br />
S<br />
- • • 45 ~<br />
•<br />
..s:: .2> <br />
-- I<br />
33 <br />
~<br />
(I)<br />
>< 40<br />
Ql • •<br />
3<br />
I:<br />
"tI<br />
C ,<br />
'iij<br />
... 31 ....<br />
C)<br />
"0<br />
35 J<br />
I: III<br />
~<br />
til 29 J:<br />
:s<br />
0<br />
..s:: 30<br />
I •<br />
*<br />
27 T<br />
I<br />
UJ<br />
Ql<br />
~<br />
• •<br />
•<br />
-- ~- .<br />
25 L _____ ________ 25 -- ---<br />
70 1 <br />
50<br />
I (d)<br />
(c)<br />
y = 0.1933x + 31.64<br />
R2 = 0.245<br />
Ui" 45<br />
>- r= •<br />
y =59.568 ·0.2077x<br />
RZ = 0.2173<br />
65 - r =·0.47'<br />
C)<br />
~<br />
I:<br />
:E.<br />
'L:<br />
(I) 60 •<br />
I:<br />
0 40 3 <br />
:;: 0 • <br />
~ ;;::::<br />
... • I •<br />
:s<br />
"0 •<br />
35 ~ 55 •<br />
t;::<br />
•<br />
I<br />
...<br />
(!) • 50 -1 30 1 •<br />
I:<br />
C I<br />
'iij<br />
25 ----- . -- -~-.--____, 45<br />
~--..<br />
---.--------,<br />
0 20 41 0 10 20 30 40<br />
Number of years since 1960 Number of years since 1960<br />
Figure 2. Relationship between year of release of seven bread wheat cultivars and (a)<br />
thousand grain weight, (b) harvest index, (c) grain-fill duration and (d) days to<br />
flowering.<br />
66
INCREASING YIELD POTENTIAL FOR MARGINAL AREAS <br />
BY EXPLORING GENETIC RESOURCES COLLECTIONS <br />
Bent Skovmand and Matthew P. Reynolds<br />
CIMMYT, Apdo. Postal 6-641, Mexico, D.F. 06600 Mexico<br />
ABSTRACT<br />
.. <br />
Global demand for wheat is growing at approximately 2% per year - twice the<br />
current rate of gain in genetic yield potential. While increases in yield<br />
potential to date have resulted mostly from manipulation of a few major genes<br />
(e.g., Rht, Ppd, Vrn), the manipulation of these genes has mostly benefited<br />
favorable environments, with much lower gains recorded in marginal areas. In<br />
the future, exploitation of novel traits found in genetic resources stored in gene<br />
banks may be needed to improve yield potential in marginal areas. Lines from<br />
landrace collections have been identified as having very high chlorophyll<br />
concentrations which may increase photosynthetic capacity. High chlorophyll<br />
concentration and high stomatal conductance, which promotes leaf cooling,<br />
are associated with heat tolerance. Recent studies have identified high<br />
expression of these traits in bank accessions, and both traits were heritable<br />
under heat stress. Searches are underway for drought tolerance traits related to<br />
remobilization of stem fructans, awn photosynthesis, osmotic adjustment,'<br />
peduncle length, and pubescence. Potential exists for identifying quantitative<br />
traits using QTL analysis in delayed backcross generations. Once markers<br />
linked to traits of interest are identified, they could be used to rapidly screen<br />
germplasm collections for unique alleles at these markers.<br />
INTRODUCTION<br />
World demand for wheat is growing at approximately 2% per year (Rosengrant et at., 1995),<br />
while genetic gains in yield potential of irrigated wheat stand at less than 1 % (Sayre et at.,<br />
1997). Thus global demand for wheat is growing at about twice the current rate of gain in<br />
genetic yield potential, with progress in rainfed environments being even lower. Meeting<br />
expected demands by continued expansion of agricultural production into remaining natural<br />
ecosystems is environmentally unacceptable, and the economic costs of increasing yields by<br />
intensification of agronomic infrastructure are high. Hence a cost-effective and<br />
environmentally sound means of meeting global demand is through genetic improvement of<br />
the wheat crop. Increases in wheat yield potential to date have resulted mostly from<br />
manipulation of a few major genes, such as those affecting height reduction (Rht), adaptation<br />
to photoperiod (Ppd) and vernalizing cold (Vrn). Future gains in yield potential, especially<br />
under stressed conditions will almost certainly require exploitation of the largely untapped<br />
sources of genetic diversity housed in collections of wheat landraces and wild relatives. Little<br />
use has been made of them for physiological improvement, even though many traits have<br />
been reported to have potential to enhance yield.<br />
67
Increasing yield potential for marginal areas using genetic resources collections - Skovmand and Reynolds<br />
Genetic resources<br />
<strong>The</strong> genetic resources available for plant physiologists and breeders are found in the several<br />
Triticeae gene pools. <strong>The</strong> concept of the gene pool was first proposed in 1971 by Harlan and<br />
deWet (Harlan, 1992), who suggested the circular way of demonstrating the relationships<br />
among gene pools. <strong>The</strong> primary gene pool consists of the biological species, including<br />
cultivated, wild and weedy forms of a crop species; gene transfer in the primary gene pool is<br />
considered easy. <strong>The</strong> secondary gene pool consists of the coenospecies from which gene<br />
transfer is possible but difficult. <strong>The</strong> tertiary gene pool is composed of related genera of<br />
annual and perennial grasses from which gene transfer is very difficult and can only be<br />
exploited through use of special techniques.<br />
Genetic resources of a cultivated plant species have been categorized by Frankel (1977) and<br />
the FAO Commission on Plant Genetic Resources (FAO, 1983), though this categorization is<br />
not followed by all centers involved in genetic resource conservation and utilization. <strong>The</strong>se<br />
categories are:<br />
• Modem cultivars in current use;<br />
• Obsolete cultivars, often the elite cultivars of the past, many found in the pedigrees of<br />
modem cultivars;<br />
• Landraces;<br />
• Wild relatives of crop species in theTriticeae tribe;<br />
• Genetic and cytogenetic stocks; and<br />
• Breeding lines.<br />
In the CIMMYT <strong>Wheat</strong> Collection, the classification has basically followed the categories as<br />
outlined by Frankel and the FAO Commission on PGR (Skovmand et at., 1992). Recently,<br />
however, a list with 21 categories was defined in the GRIP project (Skovmand et at., 2000b)<br />
to describe the biological status of materials in the collection and other genetic resources.<br />
When such specific categories are applied to collections, the efficiency of utilization IS<br />
enhanced, which makes it easier for users to know exactly what they are working with.<br />
<strong>The</strong> circles proposed by Harlan and deWet (Harlan, 1992) to describe the gene pools have<br />
been very useful, and the concept has provided a rational basis for comparative taxonomies.<br />
However, it gives the appearance that separations among the pools are clear-cut, with distinct<br />
divisions between one pool and another, though Harlan (1992) states that the line of<br />
demarcation may be fuzzy. Further, the circles do not reflect the relative difficulty of utilizing<br />
the different gene pools, nor the relative cost of utilizing genetic resources within a gene pool<br />
or within a species. Figure 1 presents a schematic diagram of the effort to transfer traits from<br />
genetic resources to farmers' fields (Skovmand et at., 2000c). Within the primary gene pool,<br />
when moving to closely related species, the cost of utilization increases. And again within a<br />
species there are levels of genetic resources, from current high yielding cultivars to landraces,<br />
that determine the cost of using these different genetic resources. Moving away from the<br />
primary gene pool increases geometrically the effort required to utilize genetic resources such<br />
as those in the secondary and teliiary gene pools. This is the reason that it is difficult to<br />
release a commercially acceptable cuItivar if it does not have prior released cultivars in its<br />
pedigree (Rajaram, pers. comm.), i.e., crosses with the secondary and tertiary gene pools tend<br />
to disunite favorable gene complexes and thus affect performance. Technology extends the<br />
gene pools and decreases the cost, as, for example, embryo rescue has done in the recent past.<br />
Also, species found in the secondary gene pool, such as Aegi/ops tauschii, can be used as<br />
readily as species in the primary gene pool through the production of hexaploid synthetic<br />
68
Increasing y ield potential for marginal areas using genetic resources collections - Skovmand and Reynolds<br />
wheats using embryo rescue, followed by chromosome doubling using colchicine (Mujeeb<br />
Kazi, 1995).<br />
Access to genetic resources<br />
Key to the access to wheat genetic resources is the development of a database, or<br />
interconnected systems of databases, with the capacity to manage and integrate all wheat<br />
information, including passport, characterization and evaluation data. In the early 1990s,<br />
CIMMYT's <strong>Wheat</strong> Program established just such a strategy for integrating and managing all<br />
data pertaining to germplasm regardless of where they were generated (Skovrnand et ai.,<br />
1998). <strong>The</strong> goal was to facilitate the unambiguous identification of wheat genetic resources<br />
and remove barriers to handling and accessing information. As a result, the International<br />
<strong>Wheat</strong> Information System (lWIS), a system that seamlessly joins conservation, utilization,<br />
and exchange of genetic material, came into being. <strong>The</strong> system is fast, user-friendly, and is<br />
available on an annually updated CD-ROM (Skovmand et ai., 2000a). <strong>The</strong> development of<br />
IWIS by the CIMMYT <strong>Wheat</strong> Program has led to an international effort to develop the<br />
International Crop Infonnation System (ICIS) which using IWIS as the model, has made the<br />
system more generic to be applicable to different crops (Skovmand et ai., 1998).<br />
IWIS has two major components: the <strong>Wheat</strong> Pedigree Management System, which assigns<br />
and maintains unique wheat identifiers and genealogies, and the <strong>Wheat</strong> Data Management<br />
System, which manages perfonnance information and data on known genes. Another<br />
information tool, the Genetic Resource Information Package (GRIP), has been developed<br />
using IWIS as data warehousing; GRIP, as one of its functions, attempts to collate passport<br />
information across gene banks to identify duplications and unique genetic resources<br />
(Skovmand et ai., 2000b).<br />
Who owns it (genetic resources)?<br />
During the 1980s there was an increasing trend towards a greater application of intellectual<br />
property protection (IPP) which contrasted with the 1960s and 70s where IPP on an<br />
international level of plant improvement was seen as a d~triment to progress. <strong>The</strong> view that<br />
strong IPP could help in maintaining technological leadership has gained respectability,<br />
especially in the United States (Siebeck, 1994). Several international initiatives have resulted,<br />
among these the 1991 strengthening of the upav Convention, which narrowed the breeder's<br />
privilege to use protected cultivars as parents in breeding. However, according to Siebeck<br />
(1994), the most significant initiative were instigated as part of the Multilateral Trade<br />
Negotiating Round in the General Agreement on Tariffs and Trade which ended in 1993. At<br />
the insistence of the industrial nations, strengthening of IPP was included as a key negotiating<br />
point. <strong>The</strong> efforts in UPOV and GATT to widen IPP on inventions and breeding technology<br />
were paralleled by efforts to regulate international access to genetic resources.<br />
F AO established the "International Undertaking on Plant Genetic Resources" in 1983 (F AO,<br />
1983), and this Undertaking was an attempt to stop genetic erosion and protect genetic<br />
resources. At the outset, the Undertaking subscribed to the rule of free interchange of<br />
germplasm, and recognized plant genetic resources as "heritage of mankind". However, later<br />
disagreements arose over ownership of genetic resources and in 1989 the idea of<br />
compensation was introduced which was again modified in 1991 when FAO adopted a<br />
resolution of the common heritage principle but subordinated it to "the sovereignty of states".<br />
69
Increasing yield potentialfor marginal areas using genetic resources collections - Skovmand and Reynolds<br />
Unlike the F AO Undertaking, w~ich was voluntary, the Convention on Biological Diversity<br />
(CBD) of 1992 was an internationally ratified treaty among nations. <strong>The</strong> CBD officially<br />
recognizes sovereign control by individual nations over biological diversity and resources on<br />
their territories. <strong>The</strong> convention excludes material collected before December 29, 1993, when<br />
the CBD took effect, but any germplasm collected after that date in a country, which has<br />
signed the CBD, comes under the provisions of the Convention. One of the results of the<br />
discussions on ownership of genetic resources has been the signing of an agreement between<br />
the CGIAR and F AO where the germplasm collections held in trust by the CGIAR system<br />
were placed under the auspices ofFAO.<br />
<strong>The</strong> result is likely to be that genetic resources will not be freely available to everyone in the<br />
future, and are likely to be made available under some type of Intellectual Property Rights<br />
(IPR) agreement. <strong>For</strong> example the accessions in the CIMMYT collection held under the<br />
F AO/CIMMYT in trust agreement is shared under a Material Transfer Agreement which<br />
states that these accession can be utilized but not protected by any IPR. However, products<br />
derived from research and breeding with such material can be protected as they are seen to a<br />
different product belonging to the scientist or breeder who developed these l .<br />
<strong>The</strong> search for new variability<br />
A classical method of identifying useful new variability is the recognition of potentially<br />
useful traits by experienced scientists and research staff. This can occur either during routine<br />
maintenance of collections, during special studies or as an offshoot of prebreeding and<br />
breeding exercises carried out for other purposes. <strong>The</strong>se phenomena should not be<br />
underestimated, as much of the useful novel variation deployed in cultivated crops has been<br />
recognized in these ways.<br />
Augmented use of seed mUltiplication nurseries: Seed multiplication nurseries can be used for<br />
the characterization and evaluation of germplasm collections for non-disease and nondestructive<br />
traits. Since these routine seed re-generation activities have to be carried out, they<br />
can be an inexpensive way of collecting such data. Recent work has indicated (He de et ai.,<br />
1999; DeLacy et ai., 2000) that traditional agronomic traits, including those of low<br />
heritability, measured on small, seed-increase hillplots' can be used for such purposes.<br />
Curators of germplasm banks have traditionally avoided these traits, which are useful for<br />
plant improvement programs. A description of germplasm based on 'useful' attributes is<br />
immediately advantageous to practical plant improvement programs by indicating where<br />
useful variation may be found in the collection. It can also describe whether adequate<br />
collection has been done (covering the range of variation) and indicating where it is to be<br />
found for recollecting expeditions.<br />
How to use the identified traits<br />
It has to be recognized that genetic resources with desirable traits as a general rule need to be<br />
tested and improved to be of any use in wheat improvement (Figure 2). Most often these<br />
genetic resources have many un-desirable characters such as extreme disease susceptibility,<br />
I In 2000, CIMMYT adopted a policy on intellectual property right (IPR) which states that, while it adheres to<br />
aU relevant international laws and treaties concerning IPR and genetic resources, the in-trust agreement signed<br />
with the FAO, and the CGIAR's "Ethical Principles Relating to Genetic Resources, it may on occasion seek to<br />
protect the products of its research by obtaining IPR through patents, plant breeders' rights, and/or trade secrets<br />
to serve the resource poor of the world (CIMMYT, 2000).<br />
70
Increasing yield potentialfor marginal areas using genetic resources collections - Skovmand and Reynolds<br />
low yield and highly specific ~daptation to a certain environment, even though they have<br />
been identified as having one highly needed trait.<br />
<strong>The</strong>refore, the identified gennplasm need to enter a pre breeding program before it can be<br />
used in improvement work. Figure 2 demonstrates two schemes for prebreeding with<br />
different purposes; one is the open parent cyclical crossing program and the other is a<br />
backcrossing program to pro'duce isogenic lines. <strong>The</strong>se two programs have different purpose<br />
and different end result and the first is progressive while the second is unprogressive in tenn<br />
of yield potential.<br />
<strong>The</strong> open parent cyclical crossing program described by Rasmusson (2000) is utilized when<br />
introgressing a trait known to be of valuable. Rasmusson was striving to introgress characters<br />
from two-row barley into six-row barley and found that the initial cross yielded gennplasm<br />
with no putative candidates for cultivar release, best lines yielding about 20 percent less than<br />
the improved parent. <strong>The</strong> second cycle of the program, where the improved parent was the<br />
current cultivar, resulted in progenies which yielded about 98 percent of best parent, while<br />
the third cycle, again using the best current cultivar as a parent, yielded 112 to 119 percent of<br />
the checks. Through this scheme, the gennplasm with the desired trait is produced which<br />
could be competitive in a cultivar release program.<br />
<strong>The</strong> backcrossing program to produce isogenic lines is utilized when the identified trait has<br />
not been proven to have value. A recurrent parent is utilized and crossed repeatedly to the<br />
genetic resource with the desired trait. In each backcross generation the two extreme tails of<br />
the populations are selected; i.e., lines with highest expression of the trait and lines with<br />
lowest expression. At the end of this program it is expected that the two sets of lines differ<br />
only for the trait in question. <strong>The</strong>n trials can be conducted to assess the value of the trait.<br />
Future utilization of genetic resources<br />
As evidenced by the above, genetic resources have played a significant role in wheat<br />
improvement and will continue to do so by providing breeders with the variability they<br />
require for future improvements. Variability will be nee.ded 1) to further increase wheat's<br />
yield potential; 2) to provide new sources of disease and pest resistance and maintain the<br />
yield levels achieved so far; 3) to develop gennplasm adapted to more marginal<br />
environments; and 4) to improve quality. To date genetic resources have contributed mostly<br />
to provide new sources of disease and pest resistance to maintain yield levels achieved.<br />
Only a few examples of genetic resources contributing to the three other objectives. One of<br />
these primary examples is the use of dwarfing genes, especially genes Rht1 and Rht2, that<br />
became available through the Japanese wheat Norin 10, which in tum inherited them from<br />
Shiro Daruma, a Japanese landrace (Kihara, 1983). <strong>The</strong> incorporation of these dwarfing<br />
genes illustrates the difficulty of using genes from unadapted materials, since persistent<br />
efforts were required to transfer them into a genotype of value (Borlaug, 1988; Krull and<br />
Borlaug, 1970). It also shows that desirable characteristics other than the apparent ones may<br />
result from such germplasm. While incorporating $trong straw to avoid lodging, better<br />
fertility and tillering capacity were obtained by Krull and Borlaug (1970). It is now obvious<br />
that dwarfing genes Rht1 and Rht2 have a direct effect on yield over and above the benefits<br />
derived from diminished lodging (Gale and Youssefian, 1986).<br />
71
Increasing yield potentialfor marginal areas using genetic resources collections - Skovmand and Reynolds<br />
Table 1 summarizes a survey done by Cox (1991) and from this it is obvious that most<br />
introductions to the US were used to improve disease and pest resistance. <strong>The</strong> only yield<br />
related traits listed were reduced height, improved straw, large seed and yield per se. No<br />
cases for improving yield in marginal environments were listed and only two for improving<br />
quality: higher protein and gluten strength.<br />
In another report (Fischer' 1996) traits involved in improving yield by introducing<br />
characteristics from genetic resources are described. Erect leaf habit was introduced into<br />
CIMMYT germplasm from several sources including T sphaerococcum based on the idea<br />
that a more erectophile leaf canopy would have higher radiation use efficiency, and a number<br />
of lines were developed through a prebreeding program. <strong>The</strong> germplasm were used in both<br />
bread and durum wheat programs and the trait can be found in current materials including the<br />
highly successful cultivars 'Bacanora 88', 'Altar 84' and'Aconchi 89'.<br />
However, in many other cases physiological characteristics that are implied as causal in<br />
improving yield potential have only been identified retrospectively. We need to act more<br />
proactively by identify traits with the potential to improve yield and evaluating them within<br />
the context of ongoing breeding objectives. Reviews of traits that might contribute to future<br />
increases in yield potential can be found elsewhere (Reynolds et ai., 1999; 2000).<br />
Traits to raise yield under stressed conditions<br />
<strong>Wheat</strong> yields are reduced by 50-90% of their irrigated potential by drought on at least 60<br />
million ha in the developing world. At CIMMYT, attempts are underway to further improve<br />
drought tolerance by introgressing stress adaptive traits into empirically selected drought<br />
tolerant germplasm. Our current conceptual model for drought encompasses high expression<br />
of the following traits: seed size, coleoptile length, early ground cover, pre-anthesis biomass,<br />
stem reserves/remobilization, spike photosynthesis, osmotic adjustment, heat tolerance, leaf<br />
anatomical traits (such as glaucousness, pubescence, rolling, thickness), high tiller survival,<br />
stay-green, and stomatal conductance, although not all traits would be expected to be useful<br />
in all drought environments (Reynolds et ai., 1999). CIMMYT's gennplasm collection is<br />
being screened, as resources allow it, for high expression ofmany of these traits.<br />
High stomatal conductance pennits leaf cooling through evapotranspiration and this, along<br />
with higher leaf chlorophyll content and stay-green, is associated with heat tolerance<br />
(Reynolds et ai., 1994). Recent studies identified high expression of these traits in bank<br />
accessions, and both traits showed high levels of heritability under heat stress (Villhelmsen et<br />
ai., 2000). <strong>The</strong>y are being crossed into good heat tolerant backgrounds.<br />
Pubescence and glaucousness are traits which protect plant organs from excess radiation<br />
under stressful conditions (see Loss and Siddique, 1994). Searches are under way for these<br />
traits and a number of other leaf traits such as leaf rolling, leaf thickness, and upright posture,<br />
which may well play similar roles under stress.<br />
Osmotic adjustment (Blum, 1999) and stored stem fructans (Blum et ai., 1998) are traits that<br />
have been implicated in stress tolerance. Searches are underway for high expression of these<br />
traits among germplasm bank accessions, although laboratory protocols are required for their<br />
identification. High spike photosynthesis is another trait that could contribute to yield under<br />
stress but which is very time consuming to measure. <strong>For</strong> traits that are difficult to measure<br />
(and/or that show marked genotype by environment interaction), it is logical to develop<br />
72
Increasing yield potential for marginal areas using genetic resources collections - Skovmand and Reynolds<br />
genetic markers that can be use.d to confirm the presence of useful traits more unequivocally<br />
than by measuring phenotypic expression.<br />
CONCLUSIONS<br />
Lines have been identified from landrace collections with very high chlorophyll<br />
concentration that may incre'ase photosynthetic capacity. High chlorophyll concentration and<br />
high stomatal conductance (which permits leaf cooling) are associated with heat tolerance.<br />
Recent studies identified high expression of these traits in bank accessions, and both traits<br />
were heritable under heat stress. Searches are underway for drought tolerance traits related to<br />
remobilization of stem fructans, awn photosynthesis, osmotic adjustment, and pubescence.<br />
Seed multiplication nurseries can be used for the characterization and evaluation of<br />
germplasm collections for physiological traits. <strong>The</strong> characterization data can be analyzed<br />
using pattern analysis, which can provide a good description of the accessions. <strong>The</strong> advantage<br />
of using these augmented seed nurseries is that cohorts of high( er) yielding lines are<br />
identified which can be used directly or examined for 'new' traits. Genetic diversity from<br />
wheat's wild relatives has already been exploited through wide-crossing to improve disease<br />
resistance. Further potential exists for identifying quantitative traits using QTL analysis in<br />
delayed backcross generations. Once markers linked to traits of interest are identified, the<br />
possibility exists to rapidly screen the germplasm collections for unique alleles at these<br />
markers.<br />
<strong>The</strong> last 30 years have witnessed an unprecedented level of international wheat gennplasm<br />
exchange and the development of a greater degree of genetic relatedness amongst successful<br />
cultivars globally; the concept of broad adaptation has thus been well vindicated. However,<br />
this is seen by some as increasing genetic vulnerability to pathogens, although such<br />
vulnerability depends more on similarities in resistance genes, which may actually be more<br />
diverse now than before. A recent study (Skovmand and DeLacy, 1999) indicates that over<br />
the last 4 decades in the CIMMYT <strong>Wheat</strong> Program, there has been a steady increase in<br />
genetic diversity as measured by pedigree analysis. Various new factors (including the<br />
growing strength of national breeding programs in the developing world and the advent of<br />
breeders' rights) should result in increased diversity amongst cultivars and perhaps lead to the<br />
exploitation of hitherto-overlooked specific adaptation in wheat. This would be especially<br />
important if climate change accelerates. Just as increasing nitrogen supply and improving<br />
weed control have been almost universal driving factors of wheat cultivation in the last 50<br />
years, higher atmospheric concentrations of CO 2 and global warming with resulting wanner<br />
temperatures could significantly influence breeding objectives in the next.<br />
Genetic resources are fundamental to the world's food security and central to efforts to<br />
alleviate poverty, contribute to the development of sustainable production systems and<br />
supplement the natural resource base. <strong>The</strong> germplasm conserved is especially rich in wild<br />
crop relatives, traditional farmer cultivars and old cultivars, which represent an immense<br />
reserve of genetic diversity. <strong>The</strong> material conserved either ex-situ or in-situ is a safeguard<br />
against genetic erosion and a source of resistance to biotic and abiotic stresses, improved<br />
quality, and yield traits for future crop improvement. As Don Rasmusson (pers. comm.)<br />
recently stated "a little genetic diversity goes a long way".<br />
73
Increasing yield potential for marginal areas using genetic resources collections - Skovmand and Reynolds<br />
REFERENCES <br />
Blum, A. 1998. Improving wheat grain filling under stress by stem reserve mobilization. Euphytica 100: 77-83.<br />
Blum, A., Zhang, J. and H.T. Nguyen. 1999. Consistent differences among wheat cultivars in osmotic<br />
adjustment and their relationship to plant production. Field Crops Research 64: 287-291.<br />
Borlaug, N.E. 1988. Challenges for global food and fiber production. Journal ofthe Royal Swedish Academy of<br />
Agriculture and <strong>For</strong>estry (Supplement), 21: 15-55.<br />
Cox, T.S. 1991. <strong>The</strong> contribution of introduced germplasm to the development of U.S. wheat cultivars. In:<br />
Shands, H.L. and L.E. Wiesner (eds.). Use of Plant Introductions in Cultivar Development. Part 1, p.<br />
25-47. CSSA Special Publication no. 17.<br />
DeLacy, I. H., Skovmand, B. and J. Huerta. 2000. Characterization of Mexican landraces using agronomically<br />
useful attributes. Accepted for publication in Genetic Resources and Crop Evolution.<br />
FAO. 1983. Commission on plant genetic resources. Resolution 8/83 of the 22nd Session of the FAO<br />
Conference, Rome.<br />
Fischer, R.A. 1996. <strong>Wheat</strong> physiology at CIMMYT and raising the yield plateau. In: Reynolds, M.P., Rajaram,<br />
S. and A.Q. McNab (eds.). 1996. Increasing Yield Potential in <strong>Wheat</strong>: Breaking the barrier. Mexico,<br />
D.F.: CIMMYT.<br />
Frankel, O.H. 1977. Natural variation and its conservation. In: Muhammed, A. and R.e. von Botstel, (eds.).<br />
Genetic Diversity ofPlants, p. 21-24. Plenum Press.<br />
Gale, M.D. and S. Youssefian. 1986. Dwarfing genes in wheat. In: Russell, G.E. (ed.). Progress in Plant<br />
Breeding. London, UK: Butterworths.<br />
Gower, J.e. 1966. Some distance properties of latent root and vector methods used in multivariate analysis.<br />
Biometrika 53: 325-338.<br />
Harlan, JR. 1992. Crops and Man. pp. 106-113. American Society ofAgronomy, Madison, WI, USA.<br />
Hede, A., Skovmand, B., Reynolds, M.P., Crossa, J, Vilhelmsen, A., and O. Stoelen. 1999. Evaluating genetic<br />
diversity for heat tolerance traits in Mexican wheat landraces. Genetic Resources and Crop Evolution,<br />
46:37-45.<br />
Kihara, H. 1983. Origin and history of 'Daruma', a parental variety of Norin 10. In: Sakamoto, S. (ed.).<br />
Proceedings of the 6 th International <strong>Wheat</strong> Genetics Symposium. Plant Germplasm Institute, University<br />
of Kyoto. Kyoto, Japan.<br />
Krull, e.F. and N.E. Borlaug. 1970. <strong>The</strong> utilization of collections in plant breeding and production. In: Frankel,<br />
O.H. and E. Bennett, (eds.). Genetic Resources in Plants: <strong>The</strong>ir Exploration and Conservation. Blackwell<br />
Scientific Publications. Oxford, UK.<br />
Loss,S.P. and K.H.M. Siddique. 1994. Morphological and physiological traits associated with wheat yield<br />
increases in Mediterranean environment. Adv. Agron. 52: 229-276.<br />
Mujeeb-Kazi, A. 1995.Interspecific crosses: hybrid production and utilization. In: Mujeeb-Kazi, A. and G.P.<br />
Hettel, (eds.). 1995. Utilizing wild grass biodiversity in wheat improvement: 15 years of wide cross<br />
research at CIMMYT. CIMMYT Research Report No.2. Mexico, D.F.: CIMMYT.<br />
Reynolds, M.P., Balota, M., Delgado, M.I.B., Amani, I. and R.A. Fiscner. 1994. Physiological and<br />
morphological traits associated with spring wheat yield under hot,·irrigated conditions. Aust. J. Plant<br />
Physiol. 21: 717-30.<br />
Reynolds, M.P., Ribaut, J.M., and M. van Ginkel. 2000. Avenues for genetic modification of radiation use<br />
efficiency in wheat. J. Experimental Botany 51: 459-473.<br />
Reynolds, M.P., Sayre, K.D. and S. Rajaram. 1999. Physiological and genetic changes in irrigated wheat in the<br />
post green revolution period and approaches for meeting global demand. Crop Science, 39: 1611-1621.<br />
Reynolds, M.P., Skovmand, B., Trethowan, R. and W. Pfeiffer. 1999. Evaluating a conceptual model for<br />
drought tolerance. In: Ribaut, J.M. (ed.). Using molecular markers to improve drought tolerance.<br />
CIMMYT, Mexico: D.F.<br />
Rosengrant, M.W., Agcaoili-Sombilla, M. and N.D. Perez. 1995. Global Food Projections to 2020: Implications<br />
for Investment. IFPRI, Washington, D.e.<br />
Sayre, K.D., Rajaram, S. and R.A. Fischer. 1997. Yield potential progress in short bread wheats in northwest<br />
Mexico. Crop Sci. 37: 36-42.<br />
Shands, H.L. 1991. Complementarity of in-situ and ex-situ germplasm conservation from the standpoint of the<br />
future user. Israel Journal ofBotany, 40: 521-528.<br />
Siebeck, W.E. 1994. Intellectual Property Rights and CGIAR Research -- Predicament or Challenge. CGIAR<br />
Annual Report 1993-1994. p. 17-20.<br />
Skovmand, B., Fox, P.N. and J.W. White. 1998a. Integrating research on genetic resources with the international<br />
wheat information system. In: Braun, H.J., Altay, F., Kronstad, W.E., Beniwal, S.P.S. and A. McNab,<br />
(eds.). <strong>Wheat</strong> Prospects for global improvement, p. 387-391. June 1996. Kluwer Academic Publishers,<br />
<strong>The</strong> Netherlands.<br />
74
Increasing yield potential for marginal areas using genetic resources collections - Skovmand and Reynolds<br />
Skovmand, B. and I.H. DeLacy. 1999. Parentage of a Historical set of CIMMYT <strong>Wheat</strong>s. 1999 Annual Meeting<br />
Abstracts. American Society ofAgronomy, p.165.<br />
Skovmand, B., Lopez, e., Sanchez, H., Herrera, R., Vicarte, V., Fox. P. N., Trethowan, R., Gomez, M.L.,<br />
Magana, R.I., Gonzalez, S., van Ginkel, M., Pfeiffer, W: and M.e. Mackay. 2000a. <strong>The</strong> International<br />
<strong>Wheat</strong> Information System (IWIS); Version 3. Skovmand, B., Mackay, M.e., Lopez, e. and A. McNab<br />
(eds.). 2000. Tools for the new millenium. On compact disk. Mexico, D.F.: CIMMYT.<br />
Skovmand, B., Mackay, M.e., Sanchez, H., van Niekerk, H., Zonghu He, Flores, M., Herrera, R. , Clavel, A.,<br />
Lopez, e.G., Alarcon, J.C., Grimes, G., and P.N. Fox. 2000b. GRIP II: Genetic resources package for<br />
Triticum and related species. Skovmand, B., Mackay, M.e. Lopez, e. and A. McNab (eds.). 2000.<br />
Tools for the new rnillenium. On compact disk. Mexico, D.F. : CIMMYT.<br />
Skovmand, B., Reynolds, M. and I.H. DeLacy. 2000c. Mining wheat gern1plasm collections for yield enhancing<br />
traits. <strong>Wheat</strong> in a Global Environment, <strong>The</strong> 6 th International <strong>Wheat</strong> Conference, Budapest, Hungary.<br />
Abstracts p.107.<br />
Skovmand, B., Varughese, G. and G.P. Hettel. 1992. <strong>Wheat</strong> Genetic Resources at CIMMYT: <strong>The</strong>ir<br />
Preservation, Documentation, Enrichment, and Distribution. Mexico D.F.: CIMMYT. 20 pp.<br />
Vilhelmsen, A.L., Reynolds, M.P., Skovrnand, B., Mohan, D., Ruwali, K.N., Nagarajan, S. and O. Stoelen.<br />
1999. Genetic diversity and heritability ofheat tolerance traits in wheat. <strong>Wheat</strong> Special Report (in<br />
press).<br />
Table 1.<br />
Contributions to germplasm improvement of introduced genetic<br />
resources; adapted from Cox, 1991.<br />
.. ;~<br />
" "<br />
Yield'<br />
, ., .... ,:.:- ~i}rginal<br />
.':,,'<br />
,potential ,Cases
Increasing yield potential for marginal areas using genetic resources collections - Skovmand and Reynolds<br />
Genetic<br />
distance<br />
L-.<br />
Gene pool GP GP-1-2 GP-2 GP-2-3 Gp-3<br />
species* Triticum spp x- Triticosecale Secalespp Aegr/ops spp Related genera of<br />
annual and perennial<br />
Triticeae<br />
Figure 1. <strong>The</strong> Triticeae gene pools and the relative difficulty of their utilization.<br />
* not in strict phylogenetic order<br />
76<br />
Q)<br />
~<br />
:::J<br />
o<br />
(/)<br />
Q)<br />
'<br />
u<br />
:z:;<br />
Q)<br />
c<br />
Q)<br />
en<br />
ro<br />
en<br />
c<br />
:~<br />
:z:;<br />
:::J<br />
'0<br />
-Q)<br />
ro<br />
u<br />
(/)<br />
ro<br />
-E c<br />
o<br />
c<br />
---<br />
~<br />
:::J<br />
U<br />
:t=<br />
'6<br />
'0<br />
Q)<br />
~<br />
en<br />
Q)<br />
o
Increasing yield potential for marginal areas using genetic resources collections - Skovmand and Reynolds<br />
Evaluation: Identification of accession with trait<br />
Genetic Resources (GR):.Prebreeding<br />
Open Parent'<br />
Cyclical Crossing Program<br />
~<br />
GR x Parent 1 (Best cultivar at the time)<br />
Backcrossing <br />
to recurrent parent <br />
~<br />
GR x Rec Parent<br />
Selection cycle 1<br />
~<br />
Selection cycle n<br />
F1 x Rec Parent<br />
~<br />
Select plant of BC1 F1 x Rec Parent<br />
Yield test selection of <br />
Advanced Line 1 (AL 1) <br />
j <br />
AL 1 x Parent 2(Best cultivar at the time)<br />
~<br />
Selection cycle 1<br />
Select plant of BC2F1 x Rec parent<br />
~<br />
Select plant of BC3F1 x Rec parent<br />
Selection cycle n<br />
Yield test selection of<br />
Advanced Line 2 (AL)<br />
~<br />
AL 2 x Parent 3(Best cultivar at the time)<br />
~<br />
Selection cycle 1<br />
Select plant of BC4F1 x Rec Parent<br />
j <br />
Select plant of BC5F1 x Rec Parent<br />
~<br />
Selection cycle 1<br />
Selection cycle n<br />
Selection cycle n<br />
Advanced line <br />
with trait (or gene) in <br />
improved background <br />
Isogenic lines<br />
differing only<br />
in the desired trait<br />
Figure 2. Utilization of genetic resources: Prebreeding schemes.<br />
* Source: Rasmusson, 2000.<br />
77
BREAD WHEAT YIELD STABILITY ANI) ENVIRONMENTAL CLUSTERING <br />
OF MAJOR WHEAT GROWING ZONES IN ETHIOPIA <br />
Debebe Masresha, Desalegn Debelo, Bedada Qinna, Solomon Gelalcha and Balcha Yaie<br />
Kulumsa Agricultural Research Center, P.O. Box 489, Asella, Ethiopia<br />
ABSTRACT<br />
A replicated yield trial comprising eighteen bread wheat genotypes and two<br />
checks was conducted at 14 locations for two consecutive years (1997-1998).<br />
<strong>The</strong> testing locations were evenly distributed across the major wheat growing<br />
zones in Ethiopia, and were characterized by various biotic and abiotic<br />
stresses. <strong>The</strong> combined data were subjected to statistical analysis to determine<br />
the pattern of adaptation of the test genotypes and to cluster the wheat growing<br />
zones on the basis of yield potential and limitations. <strong>The</strong> results showed that<br />
genotypes could be grouped into "widely", "specifically" and "generally"<br />
adapted types. Among these, HAR2536 was found to have wide adaptation<br />
while HAR 2192 was specifically adapted to high rainfall areas owing to its<br />
long duration growth habit. <strong>The</strong> testing sites were broadly clustered into high<br />
yielding and low yielding types within different interactions. <strong>The</strong><br />
environmental clusters followed altitude classes and rainfall amount and<br />
duration. This investigation elucidated that wheat productivity is more affected<br />
by moisture amount. Thus, variety selection for different moisture regimes<br />
plays an important role to maXImIze the productivity of rainfed wheat<br />
production in Ethiopia.<br />
INTRODUCTION<br />
<strong>Wheat</strong> (Triticum aestivum and T turgidium) is a major cereal grown in Ethiopia (6 - 14° N<br />
and 35 - 42° E; 1500 - 3200 m a.s.l.) (Hailu, 1991). It grows in the highlands of southeastern,<br />
central and northwestern agro-ecological zones. Varieties have different responses across<br />
environments and years resulting in significant genotype environment interaction. Phoelman<br />
and Slepper (1966) indicated that yield is a complex factor that is affected by genotype,<br />
environment and genotype X environment interaction. Denis and Vincourt (1982) showed that<br />
genotypes and environments can be clustered by giving the corresponding value of the<br />
removed sum of squares for interactions. <strong>The</strong> purpose of this study was to measure yield<br />
perfonnance stability and cluster wheat growing environments.<br />
MATERIALS AND METHODS<br />
<strong>The</strong> experiment was carried out at 14 locations representing major wheat growing areas of<br />
Ethiopia for two consecutive years, 1997-1998. Eighteen bread wheat genotypes with two<br />
checks were tested in an RCBD design with four replications. Each entry was grown in plots<br />
of six rows with inter-row spacing of 0.2 m and 2.5m length (3 m 2 ). Seeds were drilled<br />
manually into rows at a rate of 150 kg ha- 1 • Recommended fertilizer rates were applied at<br />
each site. Recommended agronomic practices were applied to the crop. Data on agronomic<br />
78
Bread wheat yield stability and environmental clustering - Debebe et al.<br />
\<br />
parameters and disease were taken at the appropriate stage of the crop. <strong>The</strong> four central rows<br />
were harvested and the yield was converted to t ha- I .<br />
RESULTS AND DISCUSSION<br />
Grain yield varied significantly among the tested lines and across locations (Table 1).<br />
Stability and cluster analyses' of the twenty bread wheat genotypes were evaluated for twentyeight<br />
locations. Variety by location interaction was significant showing change in relative<br />
yield performance and the genotypes environments. <strong>The</strong> results showed that the genotypes<br />
could be grouped into widely, sp'ecifically and generally adapted types (Tables 1 and 3).<br />
Among the twenty varieties K6290-BulkiCHIL was found to have wide adaptation while<br />
DashenJHAR722, HAR2552, HAR2527, HAR2522, HAR256 I and HAR2524 were found to<br />
have a general adaptation. Additionally, HAR2354 and HAR2536 were shown to be suitable<br />
for favorable environments while HAR2140, HAR2145 and HAR2534 for that of less<br />
favorable areas (Table 3). <strong>The</strong> testing sites were broadly clustered into high yielding and low<br />
yield zones. <strong>The</strong> environmental clusters generally followed altitude classes and yield<br />
potentials of the growing locations (Tables 4 to 8).<br />
CONCLUSIONS AND RECOMMENDATIONS<br />
<strong>The</strong> following recommendations could be made:<br />
• K6290-Bulk across the locations;<br />
• DashenJHAR722, HAR2561 and HAR2524 for generally adapted environments;<br />
• HAR2354 and HAR2536 for favorable environments; and<br />
• HAR2534, HAR2140 and HAR2145 for less favorable environments.<br />
REFERENCES<br />
Denis, J.B. and P. Viscount. 1982. Panorama and methods of statistical analysis and genotypes and environment<br />
interactions. Agronomy J. 2:219-230.<br />
Hailu Gebre Mariam. 1991. <strong>Wheat</strong> Production Research in Ethiopia. In: Hailu Gebre-Mariam, Tanner, D.G. and<br />
Mengistu Hulluka (eds.). <strong>Wheat</strong> Research in Ethiopia: A Historical perspective. Addis Ababa<br />
IARJCIMMYT.<br />
Phoelman, J.M. and D.A. Slepper. 1966. Breeding Field Crops (4 th edition). Iowa State University Press. Ames,<br />
Iowa.<br />
79
Bread wheat yield stability and environmental clustering - Debebe et al.<br />
Table 1.<br />
Combined analysis of variance for grain yield of 20 bread wheat<br />
genotypes grown at 28 locations (1997-1998) .<br />
Source: . , :df MS<br />
Genotype 19 4344459.8**<br />
Locations 27 164540741.3**<br />
Reps within Env. 84 6036557.4<br />
Genotype x Loc. 513 871059.9**<br />
Error 1596 815216850.000<br />
C.V.(%} 21.19%<br />
Table 2. Pedigrees of the 20 bread wheat genotypes grown at 28 locations (1997<br />
1998).<br />
'<br />
Variety ' Pe,
Bread wheat yield stability and environmental clustering - Debebe et at.<br />
Table 3.<br />
Mean grain yield and estimates of stability parameters for bread wheat<br />
national variety trial conducted at 28 environments (1997-1998)<br />
Entry Variety<br />
1 HAR1685<br />
2 HAR2140<br />
3 DasheniHAR 722<br />
4 HAR2195<br />
5 K6290-BulklCHIL<br />
• 6 HAR2527<br />
7 HAR2145<br />
8 HAR2169<br />
9 HAR2538<br />
10 HAR2522<br />
11 HAR2192<br />
12 HAR2552<br />
13 HAR2354<br />
14 HAR2562<br />
15 HAR2561<br />
16 HAR2519<br />
17 HAR2524<br />
18 HAR2534<br />
19 HAR2536<br />
20 PAVON-76<br />
b = coefficient of regression.<br />
Sd 2 = deviation from regression.<br />
? = coefficient of determination.<br />
..<br />
Graiil '<br />
,St~bjJ.i:tfparame~ers<br />
-,,-<br />
yield - ' "Q siif<br />
:a. z<br />
(kg/ha) .<br />
3751 1.051 86804.905* 0.893**<br />
3175 0.985 0.0 0.922**<br />
3633 1.023 0.0 0.925**<br />
3363 l.071* 0.0 0.951 **<br />
3708 0.992 0.0 0.916**<br />
3243 1.060 0.0 0.940**<br />
3095 0.916 0.0 0.904**<br />
3159 1.006 74740.260* 0.888**<br />
3370 0.905** 0.0 0.930**<br />
3320 1.018 0.0 0.970**<br />
3200 0.877 98296.219* 0.848**<br />
3364 1.005 0.0 0.950**<br />
3631 1.146** 4331.729* 0.933**<br />
3341 1.043 92041.487* 0.889**<br />
3411 1.076 0.0 0.946**<br />
3059 0.850 99864.567* 0.839**<br />
3437 1.036 0.0 0.922**<br />
3267 0.992 0.0 0.962**<br />
3484 1.039 81723.738* 0.892**<br />
3457 0.909 209116.72* 0.813**<br />
81
Bread wheat yield stability and environmental clustering - Debebe et al.<br />
Table 4. Environment dendrogram using average linkage (between groups) and rescaled distance cluster combined.<br />
o 5 10 15 20 25 <br />
~---------------~---------------~---------------~---------------~--------------~<br />
YLDI 1 <br />
YLD15 15 <br />
YLD23 23 <br />
YLD26 26 <br />
YLD28 28 <br />
YLDll 12 <br />
YLD14 14 <br />
YLD16 16 <br />
YLD6 6 <br />
YLD17 17 <br />
YLD9 9 <br />
YLD22 22 <br />
YLD18 18 <br />
YLD24 24 <br />
YLD7 7 <br />
YLDI0 10 <br />
YLDll 11 <br />
YLD20 20 <br />
YLD25 25 <br />
YLD13 13 <br />
YLD2 2 <br />
VAR5 5 I <br />
r<br />
YLD3 3 <br />
YLD8 8 <br />
YLD19 19 <br />
YLD21 21 ~ <br />
YLD27 27 -'If-------------'<br />
YLD4 4 <br />
82
Bread wheat yield stability and environmental clustering - Debebe et al.<br />
Table 5.<br />
Description of environment dendrogram.<br />
'No. C;o~e<br />
1 YLDI<br />
2 YLD2<br />
3 YLD3<br />
4 YLD4<br />
5 YLD5<br />
6 YLD6<br />
7 YLD7<br />
8 YLD8<br />
9 YLD9<br />
10 YLDI0<br />
11 YLDII<br />
12 YLD12<br />
13 YLD13<br />
14 YLD14<br />
15 YLD15<br />
16 YLD16<br />
17 YLD17<br />
18 YLD18<br />
19 YLD19<br />
20 YLD20<br />
21 YLD21<br />
22 YLD22<br />
23 YLD23<br />
24 YLD24<br />
25 YLD25<br />
26 YLD26<br />
27 YLD27<br />
28 YLD28<br />
I'<br />
~:S.l1:yjronm:fIlt;,. ~ ,Ii . Year·<br />
Dhera<br />
1997 <br />
Kulumsa<br />
1997 <br />
Bekoji<br />
1997 <br />
A.Robe<br />
1997 <br />
A.Negele<br />
1997 <br />
Asasa<br />
1997 <br />
Adet<br />
1997 <br />
Holetta<br />
1997 <br />
Ginchi<br />
1997 <br />
D/Zeit<br />
1997 <br />
Alemaya<br />
1997 <br />
Kokate<br />
1997 <br />
Sinana<br />
1997 <br />
Hosaina<br />
1997 <br />
Dhera<br />
1998 <br />
Kulumsa<br />
1998 <br />
Bekoji<br />
1998 <br />
A. Robe 1998 <br />
A.Negele<br />
1998 <br />
Asasa<br />
1998 <br />
Adet<br />
1998 <br />
Holetta<br />
1998 <br />
Ginchi·<br />
1998 <br />
D/Zeit<br />
1998 <br />
Alemaya<br />
1998 <br />
Kokate<br />
1998 <br />
Sinana<br />
1998 <br />
Hosaina<br />
1998 <br />
83
Bread wheat yield stability and environmental clustering - Debebe et al.<br />
Table 6. Dendrogram of varieties using average linkage (between groups).<br />
VARI0 10<br />
VAR12 12<br />
o 5 10 15 20 25<br />
-r-----------------r------------------r-----------------r-----------------r-----------------r<br />
VAR18 18<br />
VAR6 6<br />
VAR17 17<br />
VAR4 4<br />
I<br />
VAR2 2<br />
VAR9 9<br />
VAR7 7<br />
VAR8 8<br />
VARl3 13<br />
VAR15 15<br />
VAR3 3<br />
VAR19 19<br />
~<br />
5<br />
VAR14 14<br />
VAR16 16<br />
VARll 11<br />
I<br />
l<br />
VAR20 20<br />
1 I<br />
84
Bread wheat yield stability and environmental clustering - Debebe et al.<br />
Table 7 .<br />
Description of variety dendrogram.<br />
.:N(). ~ iCQde ' .. .~~Y:" i<br />
1 VARI<br />
2 VAR2<br />
3 VAR3<br />
4 VAR4<br />
5 VAR5<br />
6 VAR6<br />
7 VAR7<br />
8 VAR8<br />
9 VAR9<br />
10 VARlO<br />
11 V ARll<br />
12 VAR12<br />
l3 VAR13<br />
14 VAR14<br />
15 VAR15<br />
16 VAR16<br />
17 VAR17<br />
18 VAR18<br />
19 VAR19<br />
20 VAR20<br />
HAR1685<br />
HAR2140<br />
DashenIHAR 722<br />
HAR2195<br />
K6290-BulkiChil<br />
HAR2527<br />
HAR2145<br />
HAR2169<br />
HAR2538<br />
HAR2522<br />
HAR2192<br />
HAR2552<br />
HAR2354<br />
HAR2562<br />
HAR2561<br />
HAR2519<br />
. HAR2524<br />
HAR2534<br />
HAR2536<br />
PAVON-76<br />
, .<br />
85
Bread wheat yield stability and environmental clustering - Debebe et al.<br />
Table 8. Grain yield of20 bread wheat varieties (q/ha) grown in 28 environments.<br />
Locations .<br />
En~ I Variety Db" Kul Bek . I .A.;Robel A.N~g: Asa Adet I· llol ·Gin . D/Z , .. 'AVA ~~k , I .· Sip :'HOs ·<br />
I HAR1685 1383 4140 3680 I 4932 I 5029 3420 5165 I 4635 2582 3615 4404 2256 I 5265 2004<br />
2 I HAR2140 1030 3172 3284 I 4006 I 5142 2677 4019 I 3828 2394 2758 3431 1942 I 4640 2132<br />
3 I Dasben/HAR722 1316 3890 3804 I 4858 I 5567 3403 4912 I 4390 2373 2640 4000 2323 I 4990 2403<br />
4 I HAR2195 1352 3846 3037 I 4128 I 5631 3039 4502 I 3612 2355 2845 3403 1934 I 5260 2142<br />
5 I K6290-BuJkJChil 1164 3964 3664 I 4975 I 5313 3282 4716 I 3634 3134 3539 4285 2350 I 5479 2419<br />
6 I HAR2527 1191 3428 2661 I 3995 I 5417 2752 4879 I 3723 2172 2682 3899 1778 I 4672 2158<br />
7 I HAR2145 1189 3071 3241 I 3738 I 4962 2553 4535 I 3936 2329 2181 3698 1917 I 3770 2211<br />
8 I HAR2169 1132 3195 3350 I 4123 I 4976 2788 5077 I 3679 2175 2795 2496 1943 I 4233 2273<br />
9 I HAR2538 1159 3493 4004 I 3945 I 4733 2983 4640 I 4113 2359 2762 4028 2179 I 4496 2295<br />
10 I HAR2522 971 3296 3419 I 4125 I 5159 3300 4380 I 3787 2411 2802 3923 1971 I 4610 2332<br />
11 I HAR2192 1146 2998 3383 I 3616 I 4438 3091 4290 I 4370 2311 2617 3200 1985 I 5236 2127<br />
12 I HAR2552 1208 3404 3564 I 4047 I 5298 3217 4237 I 4405 2305 2960 3697 2179 I 4538 2046<br />
13 I HAR2354 1272 3932 3700 I 4652 I 5996 3489 5067 I 3793 2005 3299 3649 2056 I 5579 2350<br />
14 I HAR2562 1068 3466 2426 I 4341 I 5569 3419 4606 I 3816 2220 3242 3713 1787 I 5178 1932<br />
15 I HAR2561 1222 3687 3567 I 4586 I 5432 3103 4438 I 3685 2187 2910 3693 1975 I 5345 1932<br />
16 I HAR2519 1279 2925 2667 I 3252 I 5069 3523 3929 I 3436 2011 3079 3384 1796 I 4365 2113<br />
17 I HAR2524 1319 3578 3012 I 4109 I 5395 3512 4902 I 3566 2132 3108 4340 2231 I 4582 2335<br />
18 I HAR2534 1325 3260 3348 I 4046 I 5420 2778 4359 I 3888 2209 2518 4045 1901 I 4689 1954<br />
19 I HAR2536 1375 3920 3537 I 4653 I 5878 3917 4206 I 3336 2533 2515 3523 1882 I 5415 2085<br />
20 I PAVON-76 1254 3889 3476 I 2908 I 5584 3033 4854 I 3786 2346 3867 3864 2202 I 5085 2260<br />
Location mean 1217 3527 3341 I 4152 I 5300 3164 4585 I 3871 2327 2937 3734 2029 I 4871 2175<br />
Grand mean<br />
86
MILLING AND BAKING QUALITY <br />
OF ETHIOPIAN BREAD WHEAT CULTIVARS <br />
Solomon Gelalcha I, Desalegn Debelo I , Bedada GinnaI, Thomas Payne 2 ,<br />
Zewdie Alemayehu I and Balcha Yaie 1<br />
IKulumsa Agricultural Research Center, P.O. Box 489, Asella, Ethiopia<br />
2CIMMYT, P.O. Box 5689, Addis Ababa, Ethiopia .<br />
ABSTRACT<br />
Infonnation on physical and chemical quality parameters are necessary to<br />
assess the suitability of wheat varieties for different industrial uses. During<br />
1998, ten recommended bread wheat varieties were tested with and without<br />
fertilizer at three locations in Arsi Zone of Ethiopia, representing well-drained<br />
highland and medium altitude sites and a waterlogged Vertisol. <strong>The</strong> varieties<br />
were subjected to laboratory analysis for milling and baking quality<br />
parameters, viz., FLY, FPC, MDT, LFV, HLM and TKM. Statistically<br />
significant differences were observed among the varieties for all characters<br />
studied. <strong>The</strong>re were also significant differences due to applied fertilizer for<br />
flour yield, test weight, kernel weight and grain yield. Fertilizer by variety<br />
interaction significantly affected only flour protein content. Flour protein<br />
content was highly and positively correlated with test weight, grain size, flour<br />
yield and dough development time. Flour yield was positively correlated with<br />
test weight and grain size. Varieties such as Dashen, Galama,. Megal and<br />
Abola exhibited good baking quality due to high quality gluten and high water<br />
absorption capacity. <strong>The</strong> other test varieties tended to be more suitable for<br />
biscuit making.<br />
INTRODUCTION<br />
<strong>Wheat</strong> quality is usually defined in tenns of suitability. <strong>The</strong> quality of hard red winter and<br />
spring wheat is defined in tenns of specific properties that detennines suitability for hard<br />
wheat milling and bread production (Finney et al., 1987). Thus, quality of any kind of wheat<br />
can not be expressed in tenns of a single property, but depends on several milling, chemical,<br />
baking, processing and physical dough characteristics, each important in the production of<br />
bread, pastry and pasta products.<br />
Milling and baking qualities of bread wheat depend upon variety, environment, fertilizer<br />
treatment and post-harvest conditions (Finney et al., 1987; Nair et al., 1990; Stewart, 1984).<br />
<strong>The</strong> same authors suggested that good milling quality should consider endospenn texture,<br />
high flour yield and good flour color. Suitable protein quality, adequate protein quantity, high<br />
water absorption and low cereal a-amylase activity are all considered as important criteria for<br />
good bread flour. <strong>Wheat</strong> whose endospenn, when crushed, breaks down along the outlines of<br />
endospenn cells in to easily sifted particles is considered as 'hard' wheat. On the other hand,<br />
wheat whose endospenn splits in an apparently haphazard manner to produce a mass of fine<br />
cell debris with poor flow properties is classified as 'soft' wheat. <strong>The</strong> difference appears to be<br />
of genetic origin. It can only be modified, to a small extent, by environment and fertilizer<br />
87
Milling and baking quality ofEthiopian bread wheat cultivars - Solomon et al.<br />
treatment (Stewart, 1984).<br />
Other things being equal, milling industries prefer 'hard' wheat type. However, the final<br />
preference depends upon the end-use product. That'is, bread bakers prefer flour from 'hard'<br />
wheat while biscuit manufacturers demand flour from 'soft' wheat. One of the reasons for the<br />
difference lies on water absorption capacity of the two categories, which in tum is a<br />
manifestation of protein quality and quantity. <strong>The</strong> other reason is that more flour is extracted<br />
from hard wheat than from soft wheat. This additional flour is derived from the layer of<br />
endosperm adjacent to the bran and is higher in protein content than the remainder of the<br />
endosperm, and the protein loss during milling is less with 'hard' than with 'soft' wheat<br />
(Stewart, 1984).<br />
<strong>The</strong> quality and quantity of protein can affect the baking quality of wheat flour. Dough made<br />
from wheat flour possesses elastic properties due to the formation of gluten, the hydrated<br />
form of the water insoluble protein. <strong>Wheat</strong> is the only cereal whose proteins exhibit this<br />
property, and thus, is unique in its baking behavior (Stewart, 1984). <strong>Wheat</strong> varieties that<br />
produce dough with high elastic properties produce good bread, provided that the protein is<br />
present in sufficient quantity and the initial wheat was in a good condition. Such types of<br />
wheat are known as 'strong' wheat. On the contrary, varieties which give rise to dough which<br />
is non-elastic but very extensible (not desirable for bread making but considered good for<br />
biscuit production) are categorized under 'weak' wheat (Stewart, 1984; Williams et al.,<br />
1986).<br />
In Ethiopia, wheat has been one of the major cereals of choice, dominating the food habit and<br />
dietary practices and known to be a major squrce of energy and protein for the highland<br />
population (Abera, 1991). <strong>The</strong> wheat improvement research since its inception prior to 1930's<br />
(Hailu, 1991), has focussed on improving grain yield and disease resistance. With the<br />
emerging agro-industries using wheat as a raw material, industrial quality of wheat has<br />
become important. Because of low wheat supply and low quality row materials, some of<br />
these agro-industries are importing wheat (particularly durum wheat) from overseas.<br />
Quality reports are available on few of the wheat varieties released so far. However, the<br />
industrial quality status of all commercial wheat varieties' needs to be documented. <strong>The</strong> aim<br />
of this study, therefore, was to determine the quality attributes of some commercial bread<br />
wheat varieties, classify them based on their intended uses and make the information<br />
available to the end users.<br />
MATERIALS AND METHODS<br />
This study was conducted in 1998 at three different locations representing different<br />
environments. Bekoji (2750 m a.s.l.) represented high altitude and high rainfall area.<br />
Kulumsa (2150 m a.s.l.) represented medium altitude and moderate rainfall environment.<br />
Arsi-Robe (2400 m a.s.l.) represented high rainfall and waterlogged highland Vertisol areas.<br />
Ten commercial bread wheat varieties were planted on June 18, July 15 and July 16 at<br />
Bekoji, Arsi-Robe and Kulumsa, respectively. <strong>The</strong> experimental design was a split-plot<br />
design with fertilizer levels as main plot and varieties as sub-plot treatments. Three<br />
replications were used. Each variety was established on six rows each 2.5 m and separated by<br />
20 cm. <strong>The</strong> seeds were drilled by hand at a rate of 150 kg/ha.<br />
Fertilizer levels included Fa = No fertilizer application and F I = 60-69 kg ha- I N-P205-for<br />
88
Milling and baking quality ofEthiopian bread wheat cultivars - Solomon et al.<br />
Bekoji and Arsi-Robe and 60-60 kg ha- 1 N-P 2 0 S for Kulumsa. F 1 fertilizer levels were based<br />
on recommendations for the respective locations. Urea and DAP were the sources for Nand<br />
P, respectively. N was split applied (50% at planting and 50% at tillering). <strong>The</strong> ten test<br />
varieties and their descriptions are shown in Table 1:<br />
Laboratory analysis of seven quality parameters; as described in Table 2, was carried out at<br />
the Small Grains Institute in the Republic of South Africa. Preliminary quality observation<br />
(non-replicated) was conducted on the same varieties in the preceding year and the result is<br />
presented in Table 6 for comparison. Analysis of data was performed by AGROBASE<br />
software. Means were compared based on least significant difference (LSD). Quality<br />
parameters were correlated against each other using simple linear correlation method.<br />
RESULTS AND DISCUSSION<br />
<strong>The</strong> combined analysis of variance indicated that location effect caused significant<br />
differences among the varieties in all characters measured (Table 3). <strong>The</strong> perfonnance of the<br />
varieties with respect to FLY, HLM, TKM, MDT and GY is significantly different across the<br />
locations. FPC, FLY, HLM, TKM and GY of the varieties differed significantly due to<br />
fertility conditions. <strong>The</strong> applied fertilizer did not cause significant differences in flour protein<br />
content of a given variety in this trial. But the interaction of fertilizer by variety caused<br />
significant differences in FPC of the varieties. This finding seems to go in line with the fact<br />
that grain protein quality and quantity may increase, decrease, or not respond appreciably to<br />
N-fertilizer applied depending on genotype, existing available soil N supplies, environmental<br />
stresses, type of fertilizer (ammonia, urea, nitrate, or other form), and time and method of<br />
application. (Bates et al., 1980; Stewart, 1984).,<br />
At Kulumsa, the varieties showed significant difference (p 0.1 %) in all parameters while<br />
fertilizer application caused significant difference only in GY, TKM and MDT (Table 3). At<br />
Bekoji, fertilizer application did not show significant effect in all parameters with the<br />
exception of GY. At Arsi Robe, the effect of fertilizer was highly significant in all parameters<br />
except in MDT. <strong>The</strong> interaction of fertilizer by variety caused no significant difference in<br />
parameters considered at Kulumsa location. <strong>The</strong> sam~ trend was observed among the<br />
varieties at Bekoji excepffor MDT. At Arsi Robe, the interaction of fertilizer by variety was<br />
highly significant for TKW, FLY, FPC, MDT and LFV but non-significant for GY and HLM.<br />
Physical Qualities<br />
<strong>The</strong> results of the physical characteristics of the varieties are shown in Table 4. With fertilizer<br />
application, the top grain yielder at Kulumsa was Mitike with 7839 kglha and is significantly<br />
different from the rest of the entries. <strong>The</strong> next best yielders were Galama, K6295-4A, Pavon<br />
76, Abola and Kubsa with 6549, 6522, 6307 and 5508 kg/ha, respectively, and the differences<br />
were not significant. Yields at Bekoji and Arsi Robe were highly irregular due to severe<br />
disease incidence at both locations and waterlogging at Arsi Robe.<br />
HLM results were higher at Kulumsa and Arsi Robe and relatively lower at B~koji. Abola,<br />
ET-13A 2 , K6295-4A, Megal and Mitike had mean HLM of 80 kg/hl or higher as shown in<br />
Table 4. Varieties showed higher HLM with fertilizer application. <strong>The</strong> mean TKM was 30.0,<br />
28.9 and 26.1 grams for Arsi Robe Kulumsa and Bekoji, respectively. <strong>The</strong> varieties Dashen,<br />
ET-13A 2 , K6295-4A, Megal and Mitike had relatively higher TKM compared to the rest of<br />
the varieties. Fertilizer application slightly improved TKM performance of the varieties<br />
89
Milling and baking quality ofEthiopian bread wheat cultivars - Solomon et al.<br />
(28.87 vs. 27.72).<br />
Chemical Qualities<br />
As shown in Table 3, at all the three testing locations, the varieties differ significantly in their<br />
FLY. Fertilizer application caused significant difference in FLY of the varieties only at Arsi<br />
Robe but not at Kulumsa and Bekoji, while the interaction of the two was found significant at<br />
Bekoji and Arsi Robe. <strong>The</strong> overall FLY of the varieties was lower (48.0% to 58.4%) due to<br />
severe disease incidence. Relatively highest FLY was found at Kulumsa while lowest FLY<br />
was recorded at Arsi Robe. Dashen, Mitike, Megal, ET13-A 2 and K6295-4A (all without<br />
fertilizer) had relatively higher FLY (Table 5).<br />
<strong>The</strong> application of fertilizer did not cause significant effect on the FPC of the varieties, but at<br />
Kulumsa and Arsi Robe, the varieties showed significant dif(erence in their FPC. Fertilizer<br />
by variety interaction was significant at Bekoji and Arsi Robe (Table 3). Highest FPC<br />
(13.2%) was recorded at Bekoji while the lowest (7.7%) was recorded at Arsi Robe. Dashen,<br />
Wabe, K6295-4A, Megal, Galama and Abola, all irrespective of fertilizer application,<br />
outsmarted in their FPC.<br />
MDT of the varieties significantly differed at all locations and was affected by fertilizer only<br />
at Kulumsa while the interaction of the two was significant at Bekoji and Arsi Robe (Table<br />
3). Longer MDT was recorded at Bekoji (also highest FPC) showing that the protein quality<br />
at Bekoji is better. Abola, Dashen, Galama and Megal had longer MDT at both with and<br />
without fertilizer.<br />
<strong>The</strong> effect of fertilizer on LFV was found significant only at Arsi Robe and the varieties<br />
significantly differed in their LFV at all locations while the interaction of the two was found<br />
significant at Bekoji and Arsi Robe (same trend as in the case of FLY). Dashen, Megal,<br />
K6295-4a, Galama and Mitike had larger LFV.<br />
Correlation coefficient (Table 7) indicated that negative correlation existed between FPC and<br />
GY. This result is in line with the fact that grain yield is inversely proportional to protein<br />
content (Nair et ai., 1990; Bates et aI., 1980). Correlation between GY and the rest quality<br />
parameters (except LFV) was also negative. LFV also negatively correlated with FPC. <strong>The</strong><br />
loaf volume increases with increasing protein content within a cultivar and there is linear<br />
regression between FPC and LFV above 12% FPC while it becomes curvilinear below 12%<br />
FPC (FiIU1ey et ai., 1987). Thus, the unusual negative correlation between FPC and LFV may<br />
be due to the very low FPC (7.7% on average) at waterlogged Vertisols of Arsi Robe location<br />
while at Bekoji high FPC (10.1-18.3%) was recorded. <strong>The</strong> correlation of FPC with HLM,<br />
TKM, and FLY was strongly positive (p 0.01). <strong>The</strong> same association existed between FLY<br />
and HLM; FLY and TKM. A high correlation existed between hectoliter weight and flour<br />
yield (Williams et ai., 1986).<br />
CONCLUSIONS AND IMPLICATIONS<br />
Test weight (HLM) of the varieties is within an acceptable range (72.8-84.0 kg/hI).<br />
According to ICARDA guidelines (Williams et ai., 1986), the varieties are small seeded (25<br />
32 gllOOO kernels). Mean FPC of the varieties is in the range of 'low' to 'medium' (9.0<br />
12.1 %). Intermediate FPC (11.0-12.5%), according to ICARDA guidelines, is the most<br />
suitable for bread baking (Williams et ai., 1986). <strong>The</strong> low FLY recorded (68-70%} is<br />
90
Milling and baking quality ofEthiopian bread wheat cultivars - Solomon et al.<br />
definitely because of the severe disease infestation (especially rust) during the growing year.<br />
It can be evidenced from the fact that FLY of the same varieties in the previous year (1997),<br />
when there was no severe disease, was above international standard [(73.0-80.5%) (Table 6)].<br />
Four varieties: Dashen, Galama, Megal and Abola were found to possess superior quality<br />
characteristics. <strong>The</strong> FPC of Dashen (12.1%), Megal (10.8%), Galama (10.7) and Abola<br />
(10.6%) are acceptable. Abola (MDT value 3.4 min.) is categorized as 'strong' wheat while<br />
Dashen (2.9 min.), Galama (2.7 min) and Megal (2.3 min) have medium dough strength.<br />
Hence, the four varieties are the most desirable ones for good bread making because the<br />
relatively medium to long MDT value indicates their high quality gluten and hence, higher<br />
water absorption capacity (Stewart, 1984; Williams et ai., 1986; Finney et ai., 1987). <strong>The</strong><br />
LFV of these five varieties is acceptable (827-964 ml per a loaf of 100g flour). <strong>The</strong> other<br />
varieties are categorized under 'weak' wheat and may be utilized for making biscuits.<br />
This work is only a preliminary work on quality research of bread wheat varieties in Ethiopia.<br />
Further investigation need to be undertaken by considering additional factors such as more<br />
fertilizer levels, edaphic and meteorological data so that more detailed and reliable<br />
classification could be made on the varieties. Disease should, as much as possible, be<br />
minimized because it is obvious that disease occurrence has deleterious effect on gram<br />
quality of cereals. Economic analysis should be made on the production costs.<br />
Furthermore, research institutes should co-work with different agro-industries and local users<br />
so that the feedback will be utilized in breeding programs to incorporate important quality<br />
controlling genes into a high yielding and disease resistant commercial varieties.<br />
ACKNOWLEDGMENTS<br />
This trial was financially supported by EARO and the CIMMYT/EU project "Strengthening<br />
<strong>Wheat</strong> BreedinglPathology Research by NARS in East Africa':.<br />
REFERENCES<br />
Abera Bekele. 1991. Biochemical aspects of wheat in human nutrition. pp.341-352. In: Hailu Gebre-Mariam,<br />
Tanner, D.G. and Mengistu Hulluka, (eds.). <strong>Wheat</strong> Research in Ethiopia: A historical perspective.<br />
Addis Ababa: IARICIMMYT.<br />
Bates, L.S. and E.G. Heyne. 1980. Genetic and Environmental Effects on Quality. pp. 95-1 09. In: Hoveland,<br />
C.S. (ed.). Crop Quality, Storage, and Utilization. American Society ofAgronomy, Inc. and Crop<br />
Science Society ofAmerica. Madison, Wisconsin, U.S.A.<br />
Finney, K.F., Yamazaki, W.T., Youngs, V.L. and G.L. Rubenthaler. 1987. Quality of hard, soft and durum<br />
wheats. pp. 677-748. In: Heyne, E.G. (ed.). <strong>Wheat</strong> and <strong>Wheat</strong> Improvement. American Society of<br />
Agronomy, Inc. Crop Science Society ofAmerica, Inc. Soil Science Society ofAmerica, Inc.<br />
(Publishers). Madison, Wisconsin, U.S.A.<br />
Nair, T.V.R. and S.R. Chattejee. 1990. Nitrogen metabolism in cereals - Case Studies in <strong>Wheat</strong>, Rice, Maize and<br />
Barley. pp. 367-426. In: Abrol, y.P. (ed.). Nitrogen in Higher Plants. Indian Agricultural Research<br />
Institute. New Delhi, India Research Studies Press Ltd. Taunton, Somerset, England.<br />
Stewart, B.A. 1984. Quality requirements: Milling <strong>Wheat</strong>. pp. 113-117. In: Gallangher, E.J (ed.). Cereal<br />
Production. Proceedings of the Second International Summer School in Agriculture held by the Royal<br />
Dublin Society in cooperation with W K Kellog Foundation. Butterworth & Co. (Publishers) Ltd.<br />
Williams, P., EI-Haramein, FJ., Nakkoul, H. and S. Rihawi. 1986. Crop quality evaluation methods and<br />
guidelines. Technical Manual No. 14. International Center for Agricultural Research in the Dry Areas<br />
(ICARDA), Aleppo, Syria.<br />
91
Milling and baking quality ofEthiopian bread wheat cultivars - Solomon et al.<br />
Table 1. List of ten commercial bread wheat varieties used in quality analysis test and their description.<br />
'<br />
Y~~r ' . ,Maturity Altitude Yiel~po~~ntiai .<br />
" No. Variety:-' , r:eJeased '.' 'Stature<br />
,(days) Seed color, :'(m) ' (q/h~)<br />
" <br />
1 K6295-4A 1980 Tall ML Red 1900-2400 30-60 <br />
--<br />
2 ET13-A2 1981 Tall L White 2200-2700 30-60 <br />
3 Pavon-76 1982 Semi-dwarf ME Amber 750-2200 30-60 <br />
4 Dashen 1984 Semi-dwarf ME Amber 2000-2600 30-60 <br />
5 Mitike 1993 Tall ME Amber 2000-2600 30-60 <br />
6 Kubsa 1994 Semi-dwarf L White 2000-2600 50-70 <br />
7 Wabe 1994 Semi-dwarf L Amber < 2200 40-60 <br />
8 Galama 1995 Semi-dwarf L White 2200-2800 45-65 <br />
9 Abola 1997 ? Semi-dwarf L White 2200-2700 40-65 <br />
10 LM~gal 1997 ? Semi-dwarf ME Red
..<br />
Milling and baking quality ofEthiopian bread wheat cultivars - Solomon et al.<br />
Table 3.<br />
Analysis of variance for grain yield and other quality parameters of bread<br />
wheat grown at three locations in 1998.<br />
., , - '. 1;.,<br />
Pl.lrameters .. Sour¢e d:f. ." ~qlumsa ' :'He"ko.ii<br />
, ~<br />
· ·- :F~yaNe<br />
,'1. ' _.-. : A.~~ R()be . ,., .. Meii'n<br />
GY Location 2 - - - 148.77***<br />
F-level (F) 1 27.93*** 32.53*** 58.78** 31.51***<br />
Variety (V) 9 18.72*** 66.78*** 2.85* 15 .90***<br />
FxV 9 1.52NS 3.08** 0.56 NS 0.56 NS<br />
HLM Location 2 - - - 26.70***<br />
F-level (Fl 1 1.64NS 3.47 NS 11 .84** 10.49**<br />
Variety (V) 9 10.71*** 28.48*** 3.96** 8.63****<br />
TKM<br />
FxV 9 LOONS 5.83*** 1.02 NS 1.12 NS<br />
Location 2 -- - - 11.18***<br />
F-Ievel (F) 1 6.90* 1.01 N ~ 55.08*** 2.32 •<br />
Vari~ty (V) 9 18.60*** 22.60*** 120.98*** 4.39***<br />
FxV 9 0.82 NS 3.45** 32.69*** 0.70 NS<br />
FLY Location 2 - - - 4.63*<br />
F-level (F) 1 2.60 NS 2.69 NS 70.63*** 4.68*<br />
Varie!y(V) 9 14.50***<br />
FxV<br />
9 0.54 NS 5.67*** 61.43*** 2.97**<br />
3.63** 3.24** 1.59 NS<br />
FPC Location 2 -<br />
F-level (F) 1 0.50 NS -<br />
9.80 NS<br />
-<br />
Variety (V) 9 8.87***<br />
FxV<br />
9 0.89 NS 1.50 NS 45 .63 NS 204.19***<br />
10.51 NS<br />
33.03*** O.92 NS<br />
3.05** 14.07*** 2.12*<br />
MDT Location 2 - - - 6.47**<br />
F-level (F) 1 5.00* 1.02 NS 1.37 NS 1.54 N:S<br />
Variety (V) 9 166.05***<br />
FxV<br />
9 1.16 NS 14.24*** 34.36*** 27.86***<br />
1.71 NS 11.80*** 0.47 NS<br />
LFV Location 2 -<br />
-<br />
-<br />
F-Ievel (F) 1 LOONS 4.02 NS 64.90***<br />
86996.78*** 3.75 NS<br />
Variety (V) 9 7.57*** 2.60* 209890.42*** 0.38 NS<br />
FxV 9 0.64 NS 3.44** 66503.75*** 1.66 NS<br />
*, **, *** indicate significance at the 5,1 and 0.1 % levels of probability, respectively.<br />
NS indicates non-significance.<br />
93
Milling and baking quality ofEthiopian bread wheat cultivars - Solomon et al.<br />
Table 4. Mean grain yield and physical quality parameters of ten commercial bread wheat varieties grown at three locations in 1998.<br />
,.<br />
F~ . GY (kg/ha) •. iILMfk!/iil) .,' .<br />
'.<br />
,. TKM(g) ,'"<br />
, '.'f-, ~ '. ' ~. . ' ' . ,<br />
Variety , Jevei ' · KU ··· . , . ··BI
Milling and baking quality ofEthiopian bread wheat cultivars - Solomon et aI.<br />
Table 5. Mean chemical quality parameters of ten commercial bread wheat varieties grown at three locations 1998.<br />
FLY (0(0) FPC(12%m.b.) MI;>T (nihi). ,LFV (ml)<br />
Variety' F-le~el , KU, ' BK AR ' , Mean KU BK Ai{ Mean KU BK. AR M'ean .. " KU ' , " BK AR Mean . ,. ," '. ('<br />
Abola Fo 52.3 49.7 54.4 52.1 10.2 13.7 7.8 10.6 4.4 2.7 3.1 3.4 798.0 1019 692.0 836.0<br />
FI 52.9 51.0 52.1 52.0 9.8 12.8 6.7 9.8 4.3 3.4 2.2 3.3 800.0 989 748.0 846.0<br />
Dashen Fo 53.5 75.5 46.2 58.4 10.0 18.3 7.9 12.1 2.5 3.5 2.5 2.9 801.0 1330 759.0 964.0<br />
FI 50.8 52.7 45.1 49.5 9.8 10.1 7.3 9.0 2.5 2.8 2.5 2.6 787.0 826 680.0 764.0<br />
ET13-A2 Fo 54.5 54.3 55.9 54.9 10.8 12.2 8.2 10.4 1.5 1.2 1.5 1.4 880.0 825 716.0 807.0<br />
FI 54.4 53.7 52.4 53 .5 11.0 12.1 8.5 10.5 1.4 1.5 1.5 1.5 883.0 841 744.0 823 .0<br />
Galama Fo 52.8 47.4 53.1 51.1 10.9 14.4 7.0 10.7 3.1 2.7 2.5 2.7 875.0 983 700.0 853.0<br />
FI 53.0 50.6 51.7 51.8 10.3 13.0 6.9 10.1 3.1 2.5 2.2 2.6 837.0 993 688.0 839.0<br />
K6295-4A Fo 56.0 50.2 56.3 54.1 11.1 12.2 9.5 10.9 1.8 1.5 1.8 1.7 862.0 2:.79 836.0 859.0<br />
FI 54.0 51.0 51.8 52.3 11.2 12.4 7.8 10.4 1.6 U 2.1 1.6 848.0 867 680.0 798.0<br />
Kubsa Fo 56.0 48.6 55.0 53.2 10.1 13.2 7.0 10.1 2.1 2.1 2.4 2.2 867.0 947 736.0 850.0<br />
FI 54.6 53.0 51.2 53.0 10.0 12.0 6.6 9.5 2.2 2.0 2.2 2.1 878.0 932 692.0 834.0<br />
Megal Fo 57.8 55.1 54.6 55.8 10.5 12.9 8.9 10.8 2.9 2.0 2.0 2.3 818.0 957 728.0 835.0<br />
FI 58.3 55.1 53 .0 55.5 10.8 12.6 7.4 10.3 2.5 2.0 2.5 2.3 830.0 971 784.0 862.0<br />
Mitike Fo 59.5 59.7 53.1 57.4 10.3 12.2 7.4 10.0 2.1 1.8 2.5 2.1 818.0 937 796.0 851.0<br />
FI 58.6 57.2 51.0 55 .6 10.4 11.7 8.0 10.0 2.1 1.9 2.8 2.3 790.0 936 . 748.0 825.0<br />
Pavon-76 Fo 56.7 47.9 53.0 52.5 9.90 14.1 7.6 10.5 2.6 2.1 2.5 2.4 878.0 912 525.0 772.0<br />
FI 56.6 46.3 50.3 51.1 10.2 13.5 8.0 10.6 2.5 2.0 2.2 2.2 857.0 927 684.0 822.0<br />
-<br />
Wabe Fo 53.3 48.0 46.7 49.3 10.1 15.3 8.2 11.2 2.0 1.9 2.1 2.0 832.0 893 756.0 827.0<br />
FI 51.3 46.4 46.2 48.0 9.7 13.6 7.9 10.4 1.9 1.8 2.2 I 2.0 810.0 860 732.0 801.0<br />
Mean Fo 55.2 53.6 52.8 53.9 10.4 13.9 8.0 10.7 2.5 2.2 2.3 2.3 842.9 968.2 724.4 845.4<br />
FI 54.5 51.7 50.5 52.2 10.3 12.4 7.5 10.1 2.4 2.1 2.2 2.3 832.0 914.2 718.0 821.4<br />
G. Mean 54.8 53 .1 51.5 53.2 10.3 13.2 7.7 10.4 2.5 2.2 2.3 2.3 836.2 948.0 948.2 833.4<br />
CV 3.3 16.0 0.7 6.7 3.6 16.3 3.3 7.7 6.4 23.4 6.3 12.0 4.5 16.0 15.8 12.0<br />
LSD 3.1 14.1 0.5 8.3 0.5 I 3.5 0.3 2.1 0.3 0.9 0.2 0.5 252.4 252.4 252.4 177.2<br />
Fo = 0 fertilizer; FI =60-69 N-P20S' <br />
KU = Kulumsa; BK = Bekoji; AR Arsi Robe. <br />
95
Milling and baking quality ofEthiopian bread wheat cultivars - Solomon et al.<br />
Table 6.<br />
Mean physical and chemical quality parameters of ten commercial-bread wheat<br />
varieties grown at Kulumsa in 1997.<br />
HLM TKM FLY" ,', FP(,:: MDT LFV<br />
Variety (kg/hI.) (g) (%) (12 0 /0 m.b.) (min) (ml)<br />
Abola 82.3 33.3 77.3 lO.8 3.4 885<br />
Dashen 77.7 37.8 74.9 lO.6 2.5 940<br />
ET13-A2 81.3 36.0 73.0 9.5 1.5 885<br />
Galama 83.8 45.9 76.1 8.7 3.0 830<br />
K6295-4A 77.1' 32.3 75.7 lO.8 2.6 1100<br />
Kubsa 81.2 37.6 80.5 lO.7 1.6 90.5<br />
Megal 83.3 37.1 78.7 10.6 2.5 950<br />
Mitike 79.2 32.0 • 76.6 lO.5 3.0 945<br />
Pavon-76 78.6 32.1 76.4 9.9 2.5 965<br />
Wabe 81.1 39.7 78.4 10.3 2.2 920<br />
Mean 80.6 36.4 76.8 lO.2 2.5 851.1<br />
Table 7.<br />
Correlation coefficients of grain yield and other quality parameters of bread<br />
wheat grown at three locations in 1998.<br />
Parameters GY HLM TKM FLY FPC MDT<br />
HLM -0.2279<br />
TKM -O.OlOl 0.9107**<br />
FLY -0.1395 0.9815** 0.9488**<br />
FPC -0.1699 0.6205** 0.8104** 0.6821 **<br />
MDT -0.0926 0.0739 0.3617 0.1527 0.8168**<br />
LFV 0.9904** -0.1646 0.0560 -0.0852 -0.1324 -0.0925<br />
** denotes significant r-value at 0.01 probability level.<br />
96
RESPONSE OF BREAD WHEAT GENOTYPES TO DROUGHT SIMULATION <br />
UNDER A MOBILE RAIN SHELTER IN KENYA<br />
P.K. Kimurto l , M.G. Kinyua 2 and 1.M. Njoroge 1<br />
IEgerton University, P.O. Box 536, Njoro, Kenya <br />
2National Plant Breeding Research Centre, Private Bag, Njoro, Kenya <br />
ABSTRACT<br />
Development of drought tolerant wheat genotypes for marginal areas of Kenya<br />
would enhance utilization of the marginal areas , of the country, which<br />
comprise 83% of the total national land area. Simulated drought under a rain<br />
shelter provides a good alternative to screening in the semi-arid areas which<br />
are vast and widespread. This method excludes rainfall and allows other<br />
variables to fluctuate naturaHy. Moisture regimes simulated included terminal,<br />
early, mid and late droughts, and were created under a mobile rain shelter at<br />
Njoro, Kenya in 1998 and 1999. <strong>The</strong> drought responses of five wheat<br />
varieties, Duma, R 748, R830, R831 and R833 were determined. Five differing<br />
moisture regimes were created under the mobile rain shelter by applying drip<br />
water (i) up to seedling stage (70 mm), (ii) through tillering (82 mm), (iii) up<br />
to anthesis (94 mm), (iv) up to grain filling (106 mm), and (v) at all stages<br />
(118 mm). Data was collected on yield and yield components during the<br />
growing season from seedling to maturity. Analysis of variance was carried<br />
out in each season and data from the two seasons were combined. Terminal<br />
and early drought caused significant reduction in tiller number and number of<br />
reproductive tillers while mid to late droughts caused significant reduction in<br />
ear length (16.9%), spikelets/head (14.3%), and lOOO-kernel weights (22.4%),<br />
and an increase in the number of sterile florets/head (28.3%) as compared to<br />
the control. Seedling and reproductive stages were the most critical stages for<br />
moisture requirement. Genotype R748 performed well in all moisture regimes,<br />
and it should be recommended for commercial production in the dryland areas.<br />
It is possible to select drought tolerant cultivars using mobile rain shelters for<br />
drought simulation in Kenya.<br />
INTRODUCTION<br />
<strong>Wheat</strong> is an important cereal crop in Kenya and contributes significantly to food security in<br />
the country. Worldwide wheat is among the nine crops of major importance propagated by<br />
seed (Neergard, 1979). It can effectively be grown in drought prone areas if suitable varieties<br />
are developed. In Kenya, wheat is currently grown by both large-scale and small-scale<br />
farmers. Kenyans have continued to develop feeding habits which include wheat products in<br />
their diet. <strong>The</strong> National wheat requirement has not been met by domestic production although<br />
wheat production has continued in the high potential areas. This is partly due to diminishing<br />
arable land as a result of increasing population. <strong>The</strong> marginal rainfall areas (lower<br />
elevations), which consist of 83% of total land area, has economically under-utilized arable<br />
potential of about 200,000 hectares which can be put under production with appropriate<br />
technology (World Bank, 1989). Low (200-400 mm), erratic, unreliable (45% C.V.) and short<br />
97
Response ofbread wheat genotypes to drought simulation - Kimurto et al.<br />
rainfall in these areas nonnally cause frequent crop failures. Irrigation and development of<br />
drought resistant varieties would be the most appropriate technologies for utilizing these<br />
areas for crop production.<br />
Carrying out dryland research is usually expensive and time consuming due to the travel<br />
required to reach these vast areas. Research results are dependent on annual weather changes<br />
which are often unreliable. <strong>The</strong> experiments are usually exposed to unreliable rainfall<br />
amounts and timing. Other research methodologies such as glasshouse potted plants have<br />
been developed to induce stress under· controlled environments (Pennypacker et al., 1990;<br />
Rossouw and Wagmhmarae, 1995) and incorporation of osmoticum like ethylene gylcol into<br />
the growth medium (Schapendok et al., 1989). However, use of glasshouse has problems of<br />
creating an artificial environment for crop growth and it's also limited by initial cost while in<br />
potted plants stress develops more rapidly due to limited container size. Use of osmoticum<br />
interferes with phosphate uptake resulting in additional nutrient stress. A rain shelter offers a<br />
good alternative for drought simulations because it excludes rainfall while allowing<br />
environmental variables to fluctuate naturally (Coles et .al., 1997). This allows the crop to<br />
acclimatize to the stress which develops gradually as it usually occurs in the field. It also<br />
allows the experimenter to have control over the amount and time of moisture application. It<br />
then becomes possible to study different stages of wheat development'and their response to<br />
drought. Irrigation is costly, slow to take root and can only benefit few farming communities<br />
apart from high initial capital outlay. Development of drought tolerant wheat cultivars may be<br />
the most effective long-tenn solution to this problem. It could make a large impact in wheat<br />
production thus providing food security and income to the farming communities in these<br />
areas.<br />
Previous investigations of wheat yield response to water supply during various stages of<br />
development indicated that reproductive development is more sensitive to water deficits than<br />
vegetative growth stage (Entz and Fowler, 1988; Simane et al., 1993; Ravichandran and<br />
Mungse, 1995). Drought stress from heading to maturity gave greater reduction in grain yield<br />
than from emergence to tillering (Imityaz et al., 1990). Post-anthesis grain yield loss was<br />
reported to be associated with kernel abortion or reduction in kernel growth leading to low<br />
grains 'per head and low kernel weights (Hossain et al., 1990). Severe water stress from<br />
seedling stage to maturity reduced all grain yield components, particularly the number of<br />
fertile ears per unit area, grain number per head, dry matter and harvest index (Giunta et al.,<br />
1993). Higher number of tillers per plant may not result in higher yields because some tillers<br />
may not significantly contribute to yield because of tiller abortion (Dewey and Albrechtsen,<br />
1985).<br />
In an attempt to reduce the costs involved and time taken in identifying suitable wheat<br />
genotypes for marginal areas, this study was undertaken to determine drought responses of<br />
five wheat genotypes under simulated drought conditions and the most critical stage(s) that<br />
require moisture in wheat under tropical dry conditions in Kenya.<br />
MATERIALS AND METHOD<br />
<strong>The</strong> experiment was conducted under a mobile rain shelter for two seasons, 1998 and 1999, at<br />
the National Plant Breeding Research Centre, Njoro (0° 20 0 S, 35° 56'E; 2160 m a.s.l.).<br />
During the period of the experiment, maximum temperature recorded was 27.9°C. A mobile<br />
rain shelter was used to exclude rain and induce drought stress (Legg et al., 1978; Upchurch<br />
et al., 1983; Jefferies, 1993). It consisted of an open-ended 15m long by 7m wide (l05 m 2 )<br />
98
Response ofbread wheat genotypes to drought simulation - Kimurto et at.<br />
shelter roof mounted on wheels, which roll on'two parallel, elevated concrete barriers and is<br />
covered by translucent sheets which allowed up to 90% photosynthetic photon flux density to<br />
pass through. <strong>The</strong> length of the rail is 30 meters, hence the shelter rests on half the runway.<br />
<strong>The</strong> barrier also helps to prevent rainwater from flooding the shade. <strong>The</strong> wheels that rest on<br />
the rails make it possible to move the shelter either away from the plots to expose the crop<br />
during non-rainy times or over the plots when. it rains. In this experiment, the crop was<br />
covered only when raining. Drip irrigation (Chapin Watermatics, 1999) was used and each<br />
plot was irrigated separately by controlling gates and nozzles of the irrigation system. <strong>The</strong><br />
main pipe was laid along 15 m length and spaced at 40 cm, while the laterals (delivery pipes)<br />
were laid between the rows and spaced 30 cm apart (40 x 30 cm). One delivery pipe was<br />
shared by two rows, hence each main plot had two delivery pipes. <strong>The</strong> pressure of the water<br />
into the irrigation set was set automatically by use of pressure regulators which ensured that<br />
the total amount of water which was supplied by each nozzle remained constant in the whole<br />
experimental plot.<br />
<strong>The</strong> experimental design was a split-plot where each experimental unit had 4 rows, 1 m long<br />
and 20 cm between the rows, with 3 replicates. Main plots included five moisture regimes<br />
where four stress environments and one non-stress environment, were created by having<br />
different dates of irrigation termination (from seedling establishment to grain filling) to<br />
simulate different types of drought stress that commonly occur in marginal areas of Kenya<br />
during the cropping season. Drought was created by terminating irrigation at different growth<br />
stages, which included: 1) Terminal drought (at seedling establishment): 46 mm of water was<br />
applied during the first week and additional 12 mm each was applied at 2 nd and 4th week after<br />
planting and irrigation terminated until maturity (70 mm). 2) Early drought (at tillering):<br />
Irrigation was applied as I above and 12 mm applied at 6 th week after which irrigation was<br />
terminated until maturity (82 mm). 3) Mid drought (at anthesis): Irrigation was applied as 2<br />
above and 12 mm was applied at the Sth week then irrigation was terminated until maturity<br />
(94 mm). 4) Late drought (at grain filling): Irrigation was applied as 3 above and additional<br />
12mm were applied at 10 th week then irrigation was terminated until maturity (106 mm). 5)<br />
Control (up to maturity): Water was applied as 4 above and additional 12 mm was applied at<br />
l2th week (11S mm). All treatments had equal amount of water applied to field capacity at<br />
planting by irrigation which enabled the seeds to germinate uniformly. Water treatments were<br />
not randomized in order to keep the incremental change in water application between<br />
adjacent treatments as small as possible, as suggested by Fernandez (1991) and Steyn et at.<br />
(1995). This reduced the chances of water movement, especially if very wet (control) and dry<br />
(terminal drought) regimes were bordering each other, when the greater gradient in soil water<br />
content would promote water movement between plots. Sub-plot had four wheat genotypes,<br />
R748, RS30, R831, RS33 and the variety Duma as a check.<br />
Data were taken on the following parameters from the inner two rows: plant height at<br />
maturity, number of tillers per plant on ten randomly selected plants before booting, percent<br />
reproductive tillers at maturity, ear length on primary tillers, days to 50% heading and<br />
maturity, number of spikelets per head, number of seeds per head and sterile florets per head,<br />
1000-kernel weight and grain yield per hectare.<br />
Data was analyzed using SAS (SAS, 1996) and means separated using LSD, where ANOV A<br />
showed significant differences.<br />
99
Response ofbread wheat genotypes to drought simulation - Kimurto et al.<br />
,<br />
RESULTS<br />
<strong>The</strong> mean ANOVA (Table I) showed that there was significant difference (p==O.Ol) between<br />
watering regimes and among genotypes tested for grain yield. <strong>The</strong> control treatment had the<br />
highest yield for all genotypes in both seasons while the terminally stressed treatment (70<br />
mm) had the lowest yield (Table 2). In both seasons, the treatments where the lowest quantity<br />
of water were applied had the lowest number of seeds per head, number of tillers per plant,<br />
percent reproductive tillers, spike lets per head and kernel weight, while treatments where<br />
more moisture was applied recorded higher values (Table 2). <strong>The</strong> most stressed conditions<br />
also recorded the highest number of sterile florets per head and the plants with shortest ears.<br />
Generally, yield and yield components decreased with increasing moisture stress. Genotype<br />
R748 had the highest mean grain yield followed by Duma, while R830 and R831 were the<br />
lowest yielders (Table 3). Genotype R833 had the highest number of seeds per head in both<br />
seasons followed by R748 and Duma while R830 attained the lowest overall number of seeds<br />
per head (Table 3). Genotype R831 had the longest ears and second highest number of<br />
spikelets per head after R833 and highest number of sterile florets per head. R748 had the<br />
lowest number of sterile florets per head and highest seed weight followed by Duma. R833<br />
had the lowest seed weight and shortest ears followed by R830 in both seasons (Table 3).<br />
R830 and R748 headed and matured last while Duma and R833 were' the earliest maturing<br />
genotypes. R748 were the longest plants while R833 and Duma were the shortest (Table 3).<br />
Genotype R831 and R830 produced the highest number of tillers per plant but recorded the<br />
lowest number of reproductive tillers while R833 and R748 produced the lowest tiller number<br />
but number of highest reproductive tillers.<br />
DISCUSSION<br />
Severe water stress from seedling stage to maturity reduced expression of all yield<br />
components. Terminal and early drought reduced grain yield by 62.2% and 52.7% as<br />
compared to 44.3% and 21.4% loss by mid and late drought when compared to control. <strong>The</strong>se<br />
show that reproductive stage was the most critical stage that required moisture followed by<br />
seedling stage. Duma and R748 suffered highest yield loss under mid to late season drought<br />
while R830, R833 and R831 were affected more by early drought, showing that there was<br />
genotypic differences in response to drought stress.<br />
Highest yield loss during reproductive stages was associated with reduced number of seeds<br />
per head (20.3%), increased number of sterile florets per head (28.3%), reduced number of<br />
reproductive tillers (13%), reduced length of ears and number of spikelets per head (16.9%<br />
and 14.3%, respectively) and reduced kernel weights (22.4%) for all genotypes (derived from<br />
Table 2). Kernel weight was affected more by moisture stress from grain filling to maturity.<br />
Soil moisture deficits could have hastened the ear emergence period, flowering and<br />
pollination which consequently resulted in poor or incomplete pollination and poor seed set.<br />
Moisture stress from grain filling to maturity was strongly associated with reduced number of<br />
seeds per head (11.8%) and kernel weights (14.7%) which could have been caused by<br />
shortened grain filling periods and reduced carbohydrate supply. <strong>The</strong>re was increased kernel<br />
abortions under these conditions. Highest reduction in ear length and spike lets per head<br />
occurred under mid-late season drought because soil moisture deficits could have affected<br />
spike vegetative development. Genotype R831 and R830 had the highest number of tillers per<br />
plant but lowest number of reproductive tillers because of tiller abortions. Abortive tillers<br />
contributed to low yield in these genotypes because they compete with main culm for<br />
100
Response o/bread wheat genotypes to drought simulation - Kimurto et at.<br />
resources without significantly contributing to yield. Hence selection for few tillers/plant is<br />
ideal for improving drought stress in wheat.<br />
Drought stress hastened all phenological stages and the nonnal period of growth and<br />
development was affected resulting in reduced dry matter production and final yield. Duma<br />
and R833 were early maturing cultivars and therefore, they exhibited drought escape as<br />
drought tolerance mechanism. R 748 maintained superior performance under all moisture<br />
conditions irrespective of being late maturing. Hence late maturing cultivars can be grown in<br />
marginal areas although they may suffer yield reduction during grain filling, but not all-late<br />
maturing wheat cultivars will succumb to drought stress.<br />
CONCLUSION<br />
Early and terminal drought are critical in bread wheat, causing the high yield reduction while<br />
affecting all yield components. Mid and late drought causes more effect on reproductive<br />
stages. Seedling and reproductive stages are more sensitive to moisture requirement in wheat,<br />
hence there is need to develop varieties that are tolerant to drought at these stages. Late<br />
maturing genotypes (e.g., R830 and, R831) were sensitive to early drought as compared to<br />
early maturing cultivars such as Duma. However, R748 was the best cultivar across all<br />
watering regimes, although it is a late maturing genotype and hence it could be recommended<br />
to be grown in marginal rainfall areas. Duma remains a good variety for marginal areas. Use<br />
of mobile rain shelter for drought simulations enabled selection of apparently drought tolerant<br />
cultivars. Morphological, physiological and biochemical studies need to be undertaken to<br />
assess how these tolerant varieties were able to grow, adapt and produce yield in drought<br />
environment.<br />
ACKNOWLEDGEMENT<br />
<strong>The</strong> contributions of Egerton University, International Atomic Energy Agency (IAEA) under<br />
AFRA program and National Plant Breeding Research Center (KARl), Njoro are<br />
acknowledged for funding the research. Dr. M.G. Kinyua is highly acknowledged for<br />
facilitating and co-ordinating the research.<br />
REFERENCES<br />
Chapin Watermatics. 1999. Drip irrigation kit: Dew-horse II. Chapin Watermatics Inc. Watertown, N.Y. USA.<br />
Coles, G.D., Hartunian-Sowa, S.M., Jamieson, P.D., Hay, A.J., Atwell, W.A. and R.G. Fulcher. 1997.<br />
Environmentally-induced variation in starch and non-starch polysaccharide content in wheat Journal<br />
o/Cereal Science, 26: 47-54.<br />
Dewey, W.G. and R.S. Albrechtsen. 1985. Tillering relationships bet,veen spaced and densely sown populations<br />
of spring and winter wheat. Crop Science 25: 245-248.<br />
Fernandez, G.C.J. Repeated measure analysis of line-source sprinkler experiments. Horticultural Science, 26(4):<br />
339-324.<br />
Giuanta, F., Motzo, R. and M Deielda. 1993. Effect of drought on yield and yield components of durum wheat<br />
and triticale in Mediterranean envirorunent. Field Crops Research. 33: 399-409.<br />
Hossain, A.B.S., Tears, R.G. and T.S. Cox. 1990. Desiccation tolerance and its relationship to associated<br />
partitioning in winter wheat. Crop Science 30: 622-627.<br />
Imtiyaz, A., Dwyer, D. and A. Kumar. 1990. Etfect of moisture stress on wheat II: Yield, yield components and<br />
grain growth. In: Salokhe, V.M. and S.G. Ilangatileke (eds.). Proceedings ofInternational Agriculrural<br />
Engineering Conference and Exhibition, Bangkok, Thailand, 3_6 1h Dec. 1990 Soil and Water<br />
Engineering 3: 991-927.<br />
Jeatzold, R. and H. Schmidt. 1983. Farm management Handbook of Kenya. Narural conditions and farm<br />
management information Vol. IIIB Central and Western Kenya. Government Printers.<br />
101
Response ofbread wheat genotypes to drought simulation - Kimurto et al.<br />
Jefferies, R.A. 1993. Response ofpotato genotypes to df0ught I. Expansion of individual leaves and osmotic<br />
adjustments. Annals of Applied Biology 122: 93-104.<br />
Keirn, D.L. and W.E. Kronstad. 1979. Drought resistant and dryland adaptation in winter wheat. Crop Science<br />
Journal 19: 574-576.<br />
Kirby, E.J.M. and H.G. Jones. 1970. <strong>The</strong> relationship between the shoot and tillers in barley. Journal of<br />
Agricultural Science 88: 38 J-389.<br />
Legg, B.J., Day, W., Brown, N.J. and GJ. Smith. 1978. Small plots and automatic rain shelter. A Field<br />
Appraisal. Journal ofAgricultural Science 91: 321'-326.<br />
Oosterhius, D.M. and P.M. Cartwright. 1970. Spike differentiation and floret survival in spring wheat as<br />
affected by water stress and photoperiod. Crop Science 23: 711-717.<br />
Pennypacker, B.W., Leath, K.T., Stout, W.L. and R.R. Hill. 1990. Technique for simulating field drought stress<br />
in the greenhouse. Agronomy Journal 82: 951-957.<br />
Ravichandran, V. and H.B. Mungse. 1995. Effect ofmoisture stress on leaf development, dry matter production<br />
and grain yield in wheat. Plant physiology 9: 2, 117-120.<br />
Rossouw, F.T. and J. Waglunarae. 1995. <strong>The</strong> effect of drought on growth and yield of two South African potato<br />
cultivars. South African Journal ofScience 91: 149-150.<br />
SAS. 1996. SAS Institute Inc.; SAS/ST AT users guide, Release 6.13. Cary N.C. USA.<br />
Schapendok, A.H.e.M., Spitters, CJ.T. and PJ. Groot. 1989. Effects of water stress on photosynthesis and<br />
chlorophyll fluorescence offive potato cultivars. Potato Research 32: 17-32.<br />
Simane, B., Peacock, J.M. and P.e. Struik. 1993. Differences in developmental plasticity and growth rate among<br />
drought-resistant and susceptible cultivars of durum wheat (Triticum turgidum L var. durum). Plant<br />
and soil 157: 155-166. •<br />
Steyn. J.M., Du Plesssis, H.F. and P.S. Hammes. 1995. A field screening technique for drought tolerance studies<br />
in potatoes. South African Journal ofScience 91: 543-554.<br />
Upchurch, D.R., Ritchie, J.T. and M.A. Foale. 1983. Design of a large dual-structure rainout shelter. Agronomy<br />
Journal 75: 845-848.<br />
World Bank. 1989. Kenya Agricultural growth and strategy options. Unpublished Sector Report. Nairobi,<br />
Kenya.<br />
Table 1.<br />
Combined mean squares for analysis of variance (ANOVA) for yield and<br />
yield components measured during two seasons (1998/99) under rain<br />
shelter at Njoro, Kenya.<br />
Source df Grain yield<br />
Rep 2 1628.84<br />
Water 4 3414.31**<br />
Season 1 70.836 ns<br />
Rep*water 8 820.23<br />
Water*season 4 405.70*<br />
Main plot error 10 854.52<br />
Genotype 4 696.47**<br />
Genotyp_e*season 4 49.02*<br />
Genotype *water 16 44.12*<br />
Genotype*water*season 16 31.94*<br />
Subplot error 80 34.14<br />
Total 149<br />
Mean 843.2<br />
MSE 5.84<br />
C.V.(%) 21.64<br />
*, ** Significant at p = 0.05 and 0.01, respectively; ns = not sIgmficant; df= degrees of<br />
freedom; C.V. = coefficient of variation; MSE = mean sums ofsquares for error.<br />
102
Response ofbread wheat genotypes to drought simulation - Kimurto et al.<br />
Table 2.<br />
Mean separation for yield and yield components measured at different<br />
watering levels during each of the two seasons (1998 and 1999) and<br />
combined over the two seasons under rain shelter at Njoro, Kenya.<br />
Wat PHT DH DPM TLR · ·RTR EA . SPK Seeds/ SF 1000- Grain<br />
(mm) (cm) bead KWT yield<br />
1998<br />
(kg/ha)<br />
118 49.8a 60.9a 100.5a 2.5a 96.3a 7.5a Il.3a 30.la 4.3c 38.9a 1525.9a<br />
106 42.0a 58.2b 96.5b 2Aa 92.9b 6.7b 10.5b 25.0b 5.7b 32Ab 1029.7ab<br />
94 31.2a 56.9c 94.3c 2.lb 81.6c 6.2c 9.3c 22.8c 6.lb 30.2b 694.7b<br />
82 27.9bc 54Ad 92. ld 6c 69.1d 15.6c 9cd 20.2d 86.7a 27.5bc 587.2b<br />
70 21.0c 52.8e 91.1d 1.2d 63.le 4.8d 8.3d 18.7d 7.9a 27.3c 431 .9b<br />
Mean 34A 56.7 91.1 1.9 . 80.2 6.2 9.7 23A 6.2 31.3 850.9<br />
1999<br />
118 45.1a 6 1.7 a 94.9a 2.7a 96.3a 6.8a ll.la 25.8a 6.1d 31.8a 1117.9a<br />
106 42.8b 60.lb 92.5b 2.5ab 92Aa 6.3b 10.6b 24.6b 6.7c 27.8b 970.5b<br />
94 41.3c 57.7c 90.9c 2.3b 85.1b 5.9c 9.9c 21.8c 7Ac 24.7c 784.2c<br />
82 38.3d 55.9d 89.5d 1.5c 73.7c 5.ld 9Ad 20.8d 8.6b 23Ad 676.3d<br />
70 36.6e 54.5e 87.3e 0.8d 67.2d 5.0e 8.6e 19Ae 9.la 21Ad 561 .3e<br />
Mean 40.8 58.0 91.0 1.9 82.9 5.8 9.9 22.5 7.6 25.8 822.2<br />
Both seasons combined<br />
118 47.3a 61.3a 97.7a 2.6a 96.3a 7.la 1 1.2 a 28.0a 5.3d 35.3a 1321.9a<br />
106 42Aa 59.2b 94.5b 2Aa 91.7a 6.7b 10.6b 24.7b 6.2d 30.1b 1037.5b<br />
94 36.3b 57.3c 92.6c 1.8b 83.3b 5.9c 9.6c 22.3c 6.8c 27Ab 733.1c<br />
82 33.1 bc 55.2d 90.8d 1.5c 71Ac 5.3d 9.2d 20.5d 7.8b 25Ac 625.0c<br />
70 28.8c 53.7e 89.2e 1.0d 65.2d 4.ge 8.5e 18.9d 8Aa 24.5c 500.0d<br />
Grand 37.6 57.3 93.0 1.9 81.6 6.0 9.8 22.9 7.0 28.6 834A<br />
mean<br />
Values followed by the same letter are not sIgnificantly dIfferent at 5% level oflsd.<br />
Wat = watering regimes; PHT = plant height; RTR = percent reproductive tillers; DH = days<br />
to 50% heading; DPM = days to 50% maturity; KWT = kernel weight; EA = ear length;<br />
SPK = spike lets per head; SF = sterile florets per head; TLR = tillers per plant.<br />
103
Response o/bread wheat genotypes to drought simulation - Kimurto et al.<br />
Table 3.<br />
Mean separation table for yield imd yield components of five wheat<br />
genotypes tested during each of the two seasons (1998 and 1999) and<br />
combined over the two seasons under rain shelter at Njoro, Kenya.<br />
I<br />
Geoo- PI:IT DH DPM TLR RTR EA SPK . Seeds/ SF 1000- Grain<br />
type (cm) head KWT yield<br />
1998<br />
(kglba)<br />
R748 45.0a 58.6b 100.3a 1.ge 87.9a 6.7b 9.5d 24.5b 4.8d 35.6a 1134Aa<br />
Duma 30.5e 52.ge 89.0d 2.0e 86.6a 6Ae 9.6e 23 .5b 5Ae 32.5b 9l3.3b<br />
R833 26.5e 55.0d 90.5d 1.6d 89.5a 5.le 11 .0a 27.5a 5.5e 28.5e 832.5b<br />
R831 36.0b 56.ge 95.le 2.2a 64.6e 7.la 10.2b 22.le 8Aa 32.8b 723.0ed<br />
R830 33.9b 60.0a 98.2b 2.lb 72.ld 5Ad 8.3e 19.3d 6.7b 23.6e 674.7d<br />
.<br />
1999<br />
R748 43 .6a 61.1b 95.8a l.7e 88.3a 6.lb 9Ae 22.9b 6.0d 30.6a 990.0a<br />
Duma 39.8e 51.6d 86.3d 1.9d 86.9a 6.0b 10.Ob 22.6b 6.ge 28Aa 883.8b<br />
R833 37.5d 54.2e 86.9d 1.5e 90.3a 4.9d 10.9a 25.9a 6.ld 22.ge 814Ae<br />
R831 41.2b 60.7b 91.7e 2.5a 72.7b 6.5a 1O.5a 20.8e 10.la 23 .7b 691.6d<br />
R830 42.0b 62Aa 94.3b 2.2b 75.8b 5Ae 9.0e 19.9d 8.9b 23.6e 729.7d<br />
Both seasons combined<br />
R748 44.3a 59.9b 98.0a 1.8d 88.5ab 6.5b 9.2d 23.7b 5Ae 33.3a 1072.2a<br />
Duma 35.le 52.2e 88Ad 1.ge 86.8b 6.2e 9.8e 23.2b 6.2e 30.3b 868Ab<br />
R833 32.0d 54.6d 88.7d 1.6e 89.9a 5.le 10.9a 26.5a 5.8d 25.7d 821.7b<br />
R831 38.6b 58.8e 93Ae 2.3a 68.7d 6.9a 10Ab 21Ae 9.2a 28.3e 721.ge<br />
R830 38.0b 6 1.2a 96.0b 2.lb 74.0e 5.3d 8.7e 19.6d 7.8b 25Ad 702.2e<br />
Grand 37.6 57.3 93.0 1.9 81.6 6.0 9.8 22.9 6.9 28.6 843.8<br />
mean<br />
Values followed by the same letter are not significantly different at 5% level of LSD test. <br />
PHT = plant height; RTR = percent reproductive tillers; DH = days to 50% heading; <br />
DPM = days to 50% physiological maturity; KWT = kernel weight; EAR = ear length; <br />
SPK = spikelets per head; SF = sterile florets per head; TL= tillers per plant. <br />
104
DEVELOPING WHJ;AT VARIETIES <br />
FOR THE DROUGHT-PRONE AREAS OF KENYA: 1996-1999 <br />
M.G. Kinyua l , B. Otukho l and O.S. Abdalla 2<br />
IKARI-NPBRC, P.O Njoro, Kenya<br />
2CIMMYT/ICARDA, P.O. Box 5466, Aleppo, Syria<br />
ABSTRACT<br />
Drought prone areas in Kenya have recently attracted more attention from<br />
both researchers and policy makers. In order to enhance the economic<br />
potential of these areas, the development of bread wheat varieties that tolerate<br />
drought is being emphasized. Yield trials were carried out from 1996 to 1999<br />
to identify bread wheat genotypes which would perform well in Katumani,<br />
Elmentaita, Mogotio and Lanet - representative dry sites in Kenya. In each<br />
year, there were about 14 lines tested in comparison with check varieties<br />
Duma and Ngamia. Genotype, genotype x environment and environmental<br />
differences were observed. At the end of the trials, a new wheat variety,<br />
"Chozi", was released for commercial production. Its yield ranged from 0.5 to<br />
2.5 tlha over years and locations.<br />
INTRODUCTION<br />
Shortage of water is a chief cause of variation in wheat yields (Jamieson et al., 1995). A<br />
global effort has ensued to explain how water stress causes yield to vary, and to develop<br />
wheat varieties which can withstand this stress. Development of drought tolerant wheat<br />
varieties involves the selection of genotypes with inherent characters that lead to efficient use<br />
of scarce moisture. Varieties respond differently to varying water stress conditions, with soil<br />
water being more important than total rainfall per se. Relatively small rain events, however<br />
numerous, may have little impact on soil water due to evapotranspiration and may not lead to<br />
sustained growth. Biomass production in water stress conditions has been related to<br />
evapotranspiration (Jamieson et al., 1995). Evapotranspiration itself has been associated with<br />
the drying soil conditions while plant growth has also been shown to be strongly associated<br />
with transpiration. Delayed sowing decreases yield potential, but early sowing may lead to<br />
total crop loss due to reduced soil water. All these complex crop-water relationships<br />
confound selection of germplasm for the dry areas.<br />
It is necessary that crops are identified which are drought tolerant, to make use of the large<br />
land area that experiences drought conditions, and on which the inhabitants do not carry out<br />
any economically successful crop production. This may be due to the unsuitability of the<br />
crops that they grow. <strong>Wheat</strong> is expected to be one of the suitable crops that are both a food,<br />
as well as, a cash crop.<br />
<strong>Wheat</strong> has globally been recognized as one of the most widely adapted crops (Smale, 1996),<br />
and therefore it is possible to identify varieties of this cereal that will tolerate drought.<br />
Adaptability of the varieties will be the factor, otherwise it has been demonstrated that wheat<br />
can be grown in very dry conditions (CIMMYT, 1992).<br />
105
Developing wheat varieties for drought prone areas ofKenya - Kinyua et al.<br />
<strong>Wheat</strong> imports into Kenya have been ranging at about 60% of demand for the last few years.<br />
This is quite costly both to government foreign exchange, and to the country as a whole due<br />
to discouragement of Kenyan farmers, and misuse of liberation process and the problems<br />
which come with grain imports. Development of wheat varieties for the marginal, drought<br />
prone areas in Kenya is therefore of great impOI:tance (Kinyua, 1994). A possible total of<br />
300,000 ha is targeted, once the right variety is identified and is adopted by the fanners.<br />
<strong>The</strong> following study was carried out to identify wheat germplasm that is suited to the dry<br />
areas of Kenya. <strong>The</strong> specific objectives of the study were to screen introduced wheat<br />
germplasm at 4 locations in dry areas of Kenya; to test the yield potential of elite wheat<br />
germplasm in these areas; and, the adaptability of these lines in diverse environments in<br />
Kenya.<br />
MATERIALS AND METHOD<br />
Yield trials were conducted from 1996 to 1998 in four dryland sites in Kenya. Planting was<br />
done during the rainy season at each site. Recommended agronomic practices were applied.<br />
Marginal Areas <strong>Wheat</strong> Performance Trial (MA WPT-96), with 16 entries was planted at four<br />
sites in 1996. <strong>The</strong> trial was planted in a randomized complete block design with plot size of 8<br />
rows of six meters each in 3 replicates. <strong>The</strong> check varieties included were Duma, currently<br />
the highest yielding variety in dry, and K. Chiriku, a high yielding wheat variety in the<br />
traditional higher rainfall wheat growing areas.<br />
Six selected accessions and 4 check varieties were evaluated at Katumani. and 4 other sites in<br />
1997. <strong>The</strong>se entries were planted in randomized complete block design with three replicates.<br />
<strong>The</strong> plot size was 8 rows of 6 meters. An estimated 100 kilograms of DAP per hectare was<br />
applied to each plot. <strong>The</strong> 6 selected accessions were R744, R745, R748, R751, R754 and<br />
WL 170/84. <strong>The</strong> check varieties were Duma, Pasa, K. Chiriku and K. Mbweha.<br />
<strong>The</strong> 1998 National Dry Land <strong>Wheat</strong> Performance Trial (NDLWPT-98) was planted at<br />
Mogotio, Elmentaita, Lanet and Katumani. <strong>The</strong>re were ,9 entries and Duma as the check<br />
variety. <strong>The</strong> design was RCBD with 3 replicates. <strong>The</strong> plot sizes were 8 rows of 6 meters<br />
while the spacing between the rows was 20 cm and there was a 0.5 m path between blocks.<br />
<strong>The</strong> data collected on this trial was drought tolerance on 1 to 5 scale, grain yield and test<br />
weight.<br />
RESULTS AND DISCUSSION<br />
<strong>The</strong> effective rainfall was very low in 1996, considering high evapotranspiration in the dry<br />
areas due to high temperatures and high wind velocity, and few wind breaks. This could be<br />
expected to affect plant growth, and therefore yield. <strong>The</strong> recovering of the crops, however,<br />
was fair although the end result (yields) were not statistically analyzable. However, it gives<br />
an indication of what the farmer expects in such difficult conditions. In all the cases, the rains<br />
ceased after the trials had germinated and began again too late for benefit.<br />
Table 1 shows the average yields for the MA WPT -96 from Katumani against the overall<br />
average for the four test sites. R744, R751, R754, Duma and WL170/84 ranked high in<br />
Katumani. R751 ranked high in the three sites. <strong>The</strong> variability in these marginal areas and the<br />
unreliability of the rainfall complicated the performance of the tested lines. On visual<br />
106
Developing wheat varieties for drought prone areas ofKenya - Kinyua et al.<br />
selection R748, R751, R754, R744, Duma and WL170/84 were selected in Katumani in 1996.<br />
<strong>The</strong>re were significant site (F=1107.23**) and vliliety (F=2.28**) differences (Table 2). <strong>The</strong><br />
site by variety interaction was also significant (F=1.74*). This indicates that the changing<br />
environments interact differently with individual genotypes leading to change in relative<br />
ranking for the test genotypes over locations.<br />
Table 1 also shows the average 1000-kernel weight. <strong>The</strong> lowest seed weights were recorded<br />
in Katumani (data for other sites not shown). This implies that grain filling was influenced<br />
positively by availability of moisture. R748 recorded the highest seed weight at Katumani.<br />
Other lines with high seed weight at this site were R742, R744 and Duma (Table 1).<br />
Table 3 shows the analysis of variance for 1000 kernel weight at three sites. <strong>The</strong> varieties as<br />
well as the sites differ significantly (F=38.07** and 95.86**, respectively). <strong>The</strong> variety by<br />
site interaction was also significant (F=4.78**). <strong>The</strong> varieties reacted differently to these<br />
conditions, thus showing significant varietal as well as variety by environment interaction<br />
differences (Table 3). <strong>The</strong>se reactions can be exploited during selection. A variety that is<br />
responsive to environmental change and would positively utilize the conditions of a better<br />
environment is more desirable. Such would be capable of tolerating drought stress in bad<br />
weather conditions.<br />
Table 4 shows the ANOV A for yields and test weight, at Katumani, and 3 other sites in<br />
Kenya in 1997. <strong>The</strong> entries differed significantly on yield in Katumani. Indeed these entries<br />
showed differences at p=O.Ol at Katumani. <strong>The</strong> CV for Katumani was high. <strong>The</strong> ANOVA<br />
(Table 4) shows that there were site differences. <strong>The</strong> entries as well as the interaction effects<br />
were also significant, apart from the interaction effect of test weight. This indicates that the<br />
entries showed different response over the environments and that there was genotype by<br />
environment interaction. This was similar to what was observed in the previous year.<br />
Table 5 shows the means for yield and test weight in Katumani and overall mean for 4<br />
environments. In Katumani R744 performed best while R748 was also relatively well ranked<br />
and slightly differing with R744 only. It was just as good as the 2 nd in ranking. Entry R748<br />
yielded above average in Katumani as well as over all environments. <strong>The</strong>se same lines<br />
performed well in 1996. Since the environmental conditions differed in the two years<br />
(weather data not shown), these lines show stability characters and also positive response to<br />
good environments, thus maintaining relatively high ranking in both adverse and good<br />
environments. <strong>The</strong>se are desirable characteristics for wheat varieti~s for dry areas. <strong>The</strong>y will<br />
be able to respond to the good years in these environments, as well as tolerate adverse years.<br />
<strong>The</strong> yields differed significantly in Katumani this year, while there were no significant<br />
differences in kernel weight (Table 5). Since there were line differences when the sites were<br />
combined in the analysis (Table 4), it might be that the conditions in Katumani during grain<br />
filling were so adverse that the different lines were not able to express their inherent potential<br />
in grain weight. Moisture conditions at grain filling period is very critical in determining the<br />
seed quality characteristics of wheat (Kimurto, 2000). <strong>The</strong>re were site differences in<br />
influencing both yields and kernel weight (Table 4). Due to this, the lines that would perform<br />
relatively well in all environments would possess desirable characteristics of a suitable<br />
variety for the dry areas in Kenya. <strong>The</strong>se areas will once in a while receive rainfall that is<br />
high enough to be comparable to good environments (Jaetzold and Schimdt, 1983). <strong>The</strong><br />
rainfall in these areas is however, very erratic both in amount and reliability. It is important,<br />
107
Developing wheat varieties for drought prone areas ofKenya - Kinyua et al.<br />
then, for a variety meant for these areas to be able to cushion the weather changes that are<br />
most certain to occur over time. Genotype R748 is one such.<br />
Table 6 shows the ANOVA for grain yield and test weight for the NDLWPT-98. <strong>The</strong> yields<br />
did not vary significantly at Narok or Lanet. <strong>The</strong>re was significant difference between the<br />
yield of the entries in Elmentaita (Gmss=0.28*) an1 Mogotio (Gmss=0.27*). <strong>The</strong> mean yields<br />
were low in Narok and Elmentaita, ranging between 0.5 tlha to' 1.02 tlha and 0.4 to 1.2 t/ha<br />
respectively (Table 7). <strong>The</strong> yields were higher in Mogotio (range 1.7-2.8 t/ha) and Lanet<br />
(ranging 1.5-2.3 tlha). Only R748 yielded less than Duma in Elmentaita, while in Mogotio all<br />
the entries yielded higher than Duma. Mogotio was relatively the best site on yields while<br />
Narok was the worst. Test weight was highly variable over all the sites (Table 6), with a<br />
range between 64 and 78 kg/hi (Table 7). R831 had the highest test weight in Lanet and<br />
Narok. <strong>The</strong> lowest test weights were observed in Mogotio (ranging 65-70 kglhl). This site<br />
had relatively the highest yields, which gives the indication that yields are negatively<br />
correlated to test weight. From the data it was evident that Duma is still performing relatively<br />
very well in the dry areas of Kenya.<br />
R748, which was released in December, was also performing very well both in yield and test<br />
weight. R748 was released under the variety name "Chozi", in December 1998. About 1.5<br />
tons of Breeder's Seed of the variety was harvested in Timau in late February, 1999 for<br />
distribution to seed merchants.<br />
CONCLUSION<br />
Development of wheat varIeties for the drylands in Kenya for the period 1996 -1999<br />
culminated in the release of variety "Chozi" which will contribute greatly in wheat production<br />
in the country.<br />
ACKNOWLEDGMENT<br />
<strong>The</strong> CIMMYT-EU project Strengthening BreedinglPathology in NARS in <strong>Eastern</strong> and<br />
Central Africa provided the funds for carrying out this .research. <strong>The</strong> Centre Director of<br />
KARI-NPBRC, Dr. 1.K Wanjama, provided logistic support and the technical support staff in<br />
the Cereal Breeding section helped with the technical work.<br />
REFERENCES<br />
CIMMYT. 1992. CIMMYT 1991. Annual Report (International Maize and <strong>Wheat</strong> Improvement Center).<br />
Improving the Productivity of Maize and <strong>Wheat</strong> in Developing Countries: An Assessment ofImpact.<br />
Mexico, D.F.: CIMMYT.<br />
Jaetzold, R. and Schimdt. 1993. Farm management handbook of Kenya. Natural Conditions and Fann<br />
Management information. Kenya Government Printers.<br />
Jamieson, P.D., Martin, R.J. and G.S. Francis. 1995. Drought influences on grain yield of barley wheat and<br />
maize. New Zealand, 1. ofCrop and Horticulture Sciences, 23:55-56.<br />
Kimurto, P.K. 2000. Selection of drought tolerant wheat germplasm by simulating drought under rain shelter in<br />
Kenya. M.Sc. <strong>The</strong>sis. Egerton University.<br />
Kinyua, M.G. 1994. <strong>The</strong> status of wheat and barley breeding in Kenya. Proceedings of the Durable Resistance<br />
<strong>Workshop</strong> for <strong>Eastern</strong>, Southern and Central Africa. Njoro, Kenya.<br />
Smale M. 1996. Understanding global trends in the use of wheat diversity and international flows of wheat<br />
genetic resources. Economics working paper 96-02. Mexico D.F.: CIMMYT.<br />
108
Developing wheat varieties for drought prone areas ofKenya - Kinyua et at.<br />
Questions and Answers:<br />
J.A. Adjetey: (a) <strong>The</strong>re is a need for quantitative measure of plant water status; (b) there is a<br />
need to postulate a physiological/morphological basis for drought tolerance.<br />
Answer: Some quantitative measures have been undertaken, e.g., morphology of roots for<br />
drought tolerance. Other studies are planned. .<br />
Table 1.<br />
Mean yields (t/ha) and 1000 kernel weight (KWT) in grams, for lVIAWPT<br />
96 for Katumani and overall means for 4 sites in 1996.<br />
KWT ~erams)<br />
Yield tlha)<br />
Entry Katumani Grand mean Katumani Grand mean<br />
R659 29.27 36.49 0.233 1.422<br />
R742 40.20 , 40.58 0.167 1.422<br />
R744 38.37 39.50 0.267 1.311<br />
R745 35.40 38.19 0.167 1.688<br />
R748 46.63 46.92 0.167 1.533<br />
R751 35.77 38.83 0.267 1.767<br />
R754 34.83 36.96 0.233 1.656<br />
DUMA 44.13 41.40 0.233 1.367<br />
R641 32.10 35 .94 0.133 1.322<br />
WL170/84 32.00 34.29 0.200 1.433<br />
GAMTOOS 37.80 38.82 0.133 1.467<br />
PALMIET 29.30 32.20 0.167 1.200<br />
NGAMIA 33.43 36.86 0.133 1.156<br />
K.NYANGUMI 29.00 31.80 0.133 1.167<br />
PASA 32.50 37.02 0.200 1.378<br />
KWALE 34.33 37.46 0.166 1.163<br />
Mean 35.32 37.70 0.187 1.403<br />
Table 2.<br />
Analysis of variance for yields in MAWPT-96 at 3 locations in Kenya.<br />
Source DF SS F<br />
Site 2 344.835 1107.23**<br />
Rep 6<br />
~<br />
0.496 0.53<br />
Variety 15 5.319 2.28**<br />
Var x Site 30 8.136 1.74*<br />
Error 90 4.676<br />
,2 _<br />
C.V - 28.09 R - 0.962 Mean -- 1.405<br />
109
Developing wheat varieties for drought prone areas ofKenya - Kinyua et al.<br />
Table 3.<br />
Analysis of variance for Kernel weight in MA WPT -96 for 3 sites in<br />
Kenya in 1996.<br />
Source<br />
Replicate<br />
Site<br />
Variety<br />
Site/variety<br />
Error<br />
Total<br />
DF<br />
2<br />
2<br />
15<br />
30<br />
94<br />
143<br />
SS<br />
10.702<br />
593.015<br />
1766.337<br />
443.092<br />
290.750<br />
31903.895<br />
MSS<br />
5.351<br />
296.507<br />
117.756<br />
14.770<br />
3.093<br />
F<br />
1.73<br />
95.86**<br />
38.07**<br />
4.78**<br />
Table 4.<br />
Combined analysis of variance for yield, test weight and plant height for<br />
NDWPT-97 from 4 sites in Kenya in 1997.<br />
Mean sums ofsquares<br />
DF Yield Test weight Plant height<br />
Location 3 138.00** 130.98** 15345.72<br />
Error 8 0.549 2.011 60.34<br />
Lines 9 0.753** 12.96** 16.88**<br />
Loc x Line 27 0.360** 1.71ns 68.28**<br />
Error 72 0.126 1.39 26.40<br />
CV 14.40 1.50 6.47<br />
Table 5.<br />
Means for Yield and 1000 Kernel Weight for Katumani for NDWPT-97<br />
grown in 4 sites in Kenya in 1997.<br />
Entry Yield 1000KWT<br />
R744 0.54A 25.47A<br />
R745 0.32B 25.00A<br />
R748 0.29BC 26.44A<br />
R751 0.27BC 22.79A<br />
R754 O.llCD 25.73A<br />
WL170/84 0.04D 27.82A<br />
Duma 0.53A 26.15A<br />
Pasa 0.17BCD 25.62A<br />
K. Chiriku 0.27BC 24.55A<br />
K. Mbweha 0.03D 26.42A<br />
110
Developing wheat varieties for drought prone areas ofKenya - Kinyua et ai.<br />
Table 6.<br />
ANOVA for yield and test weight (TWT) for NDLWPT-98 grown in <br />
Narok, Lanet, Elmentaita and Mogotio in 1998. <br />
Mean Sum of Sguare<br />
. Narok Lanet . MOl otio' Elm,entaita<br />
Source df " Yield TWT Yjeld TWX ,Yield TWT Yield TWT<br />
Genotype 9 0.16 5.91 ** 0.24 20.16* 0.27* 19.04 0.28* 21.34**<br />
Replicate 2 0.10 0.23 0.63 6.70 0.20 0.63 0.01 0.10<br />
Error 18 0.10 0.68 0.27 8.77 0.12 4.34 0.10 0.47<br />
Table 7.<br />
Mean yield (t/ha) and TWT (kg/hI) for NDLWPT-98 grown in Narok, <br />
Lanet, Elmentaita and Mogotio in 1998. <br />
Narok Lanet Mogotio Elmentaita<br />
Genotype Yield TWT Yield TWT Yield TWT Yield TWT<br />
R830 0.69 74.33 1.84 70.33 2.32 68.33 1.21 72.00<br />
R831 0.71 77.00 1.76 78 .00 1.91 70.33 0.49 74.67<br />
R833 0.90 75.00 2.19 69.67 2.08 66.00 0.73 70.00<br />
R836 0.47 74.67 2.25 74.67 2.. 34 68.33 0.76 76.00<br />
R837 0.94 74.67 1.53 76.67 2.12 68.67 0.74 72.67<br />
.-.<br />
R839 0.56 74.00 2.17 73.33 2.09 64.67 1.02 72.00<br />
R840 0.49 75.67 1.88 72.33 1.79 65.33 0.81 71.33<br />
R841 0.77 76.33 1.47 75.00 2.19 69.67 1.17 74.00<br />
R748 1.02 76.67 1.69 74.67 2.71 71.33 0.30 66.33<br />
Duma 0.53 72.33 2.13 73 .33 1.67 64.00 0.42 72.00<br />
Mean 0.69 75 .07 1.89 73.80 2.12 67.67 0.76 72.10<br />
111
MILLING AND BAKING QUALITY <br />
OF SOUTH AFRICAN IRRIGATED WHEAT CULTIVARS <br />
Ibrahim Mamuya l , Hugo A. van Niekerk 2 , Marie Smith 3 and Francois Koekemoer 2<br />
IDepartment of Plant Breeding, University of the Orange Free State,<br />
. Bloemfontein 9300, South Africa<br />
2Small Grain Institute, Pri;q.te Bag X29, Bethlehem, 9700, South Africa<br />
3Agricultural Research Council, POBox 8783, Pretoria 0001, South Africa<br />
ABSTRACT<br />
<strong>The</strong> objective of this study was to examine the effect of environment,<br />
genotype and their interaction on bread-making quality characteristics of<br />
spring wheat cultivars grown under irrigated conditions. <strong>Wheat</strong> grain samples<br />
were obtained from experime:ntal trials conducted by the Small Grain Institute,<br />
at six locations in 1997 and at seven locations in 1998. Nine cultivars were<br />
common in both years, with two unique in 1997. Statistical analyses showed<br />
that genotype, environment and their interaction had significant influence on<br />
quality characteristics. Canonical variate analysis (CY A) allowed grouping of<br />
characteristics to discriminate among genotypes, locations and interaction<br />
effects. <strong>The</strong> results show that cultivars T4, SST876 and Palmiet were poorer in<br />
bread-making quality than Kariega, SST57, SST822, SST825, and Inia which<br />
showed good potential as quality bread wheat cultivars.<br />
INTRODUCTION<br />
<strong>The</strong> recent deregulation of the single-channel wheat marketing system and the introduction of<br />
a more liberal grain marketing environment in South Africa has had a drastic effect on the<br />
purchasing practices of food processors. In the single-channel marketing system, wheat<br />
cultivars were released for conunercial production . after meeting minimum quality<br />
requirements (11 primary and 11 secondary parameters) set by the <strong>Wheat</strong> Technical<br />
Committee, functioning under the auspices of the former <strong>Wheat</strong> Board, and comprising of<br />
representatives from a broad spectrum of the industry. <strong>The</strong>se cultivars were released for<br />
production purposes only and hence, were deemed to be of equal quality worth and the grain<br />
was mixed at the point of receipt (e.g., <strong>Wheat</strong> Board collection silos). Grain buyers were<br />
obliged to receive and accept grain of these mixtures of cultivars for milling and baking<br />
purposes, irrespective of the absolute quality (minimum BL2 grade) of the grain. As a<br />
consequence, cultivars with inherently superior quality characteristics were never objectively<br />
identified nor could demand for high quality grain by the processing industry be catered for.<br />
<strong>The</strong> newly liberalized wheat-marketing environment in South Africa allows purchase on an<br />
individual cultivar basis, a common practice in many countries, that have deregulated wheatmarketing<br />
systems. However, limited or unscientific information regarding relative milling<br />
and baking quality of South African wheat cultivars is available to breeders, producers,<br />
buyers and processors of grain. Howard and Wessels (1997) have put forward an exemplary<br />
selection-index to quantify the relative milling and baking value of South African wheat<br />
112
Milling and baking quality ofSouth African irrigated wheat cuitivars - Mamuya et ai.<br />
cultivars. While a significant contribution to the industry, there are deficiencies In this<br />
scheme which are rightly acknowledged.<br />
Thus, the environment was suitable for a scientific study be undertaken to determine the<br />
relative milling and baking value of South African bread wheat cultivars. Outside South<br />
Africa similar investigations of the mechanism and magnitude of genotypic and<br />
environmentally related influences on wheat quality (Lukow and McVetty, 1991; Peterson et<br />
ai., 1992; Graybosch et ai., 1995) have been performed. In addition, complications in the<br />
interpretation of the interrelated nature of quality characteristics have been well documented<br />
(Preston et ai., 1992; Rasper, 1993), and a better understanding of the factors associated with<br />
quality variation is required.<br />
A study was undertaken to determine the relative milling and baking quality of South African<br />
bread wheat cultivars for three major production regions: summer-rainfall dryland winter<br />
wheat, winter-rainfall dryland spring wheat and irrigated spring wheat. In this paper, the<br />
results of the latter are repOlied for the 1997 and 1998 crop seasons.<br />
MATERIALS AND METHODS<br />
Field Trials<br />
Eleven spring wheat cultivars were grown under irrigation in the summer rainfall region.<br />
Cultivar identity and location details are presented in Table 1. All trials were executed<br />
according to standardized field procedures. Quality analyses (Table 2) were performed on<br />
grain obtained from each replication.<br />
Statistical Analyses<br />
<strong>The</strong> additive main multiplicative interaction (AMMI) method (Gauch, 1988) and the<br />
canonical variate analysis (CVA) (Digby et ai., 1989) were used to statistically' analyze the<br />
data. <strong>The</strong> results from the AMMI are provided in the form of simple ANOV A, means for<br />
environments and genotypes, and biplots showing the e~tent of genotype and environment<br />
interaction. This method integrates analysis of variance (ANOV A) for the genotype and<br />
environment main effects with principal components analysis of the genotype by<br />
environment interaction, and is especially useful in analyzing multilocation trials (Gauch and<br />
Zobel, 1988). According to Purchase (1997), the AMMI model can summarize patterns and<br />
relationships of genotypes and environments, as well as provide valuable prediction<br />
assessment. While other multivariate analysis procedures (e.g., cluster analysis) may be<br />
difficult to interpret in relation to genotype by environment interaction, the AMMI model<br />
offers relevant biological information whereby principal component factors can be described<br />
according to environmental and/or biological factors, and is statistically fairly simple.<br />
Canonical variate analysis is used to show differences between groups than between<br />
individuals. Differences between a large number of variables are firstly reduced to a smaller<br />
set ofvariables that account for most of the range. This new set, called the canonical variates,<br />
is linear combinations of the original measurements, and is thus given as vectors of loading<br />
for the original measurements. With this approach, a set of directions is obtained in such a<br />
way that the ratio of between-group variability to within-group variability in each direction is<br />
maximized (Digby et at., 1989; Van Lill and Purchase, 1995). This test was therefore used to<br />
see which parameter had more influence on quality for both main (genotype and<br />
113
Milling and baking quality ofSouth African irrigated wheat cultivars - Mamuya et al.<br />
environment) and interaction effects. Taking into account that phenotypic variation is an<br />
indication of genetic potential, quality analysis of the cultivars will be used to reveal their<br />
quality status and to predict blending complementarity to improve quality potential.<br />
Separate analyses were performed for 1997 and 1998 to determine phenotypic correlations,<br />
canonical variate to find groupings between genotypes, environments as well as a canonical<br />
variate analyses to find groupings between environment and genotype. A combined analysis<br />
for 1997 and 1998, where only the nine cultivars (entries) included in both years, was also<br />
performed and for the purpose of this discussion we will concentrate only on the combined<br />
analysis.<br />
RESUL TS AND DISCUSSION<br />
Discriminate scores (Table 3) indicated that only 7 quality parameters were responsible for<br />
observed genotype variations, including vitreous kernels (VK), mixograph development time<br />
(MDT), alveograph configuration ratio (P/L), alveograph strength (Str), SDS-sedimentation<br />
(SDSS), loaf volume at 12% protein (LFV 12%) and SKCS hardness index (HI). <strong>The</strong>se<br />
variations were likely associated with endosperm starch and protein content, and the rate of<br />
starch to protein caused differences between the two years.<br />
<strong>The</strong> combined CV A performed to find groupings between genotypes for both crop cycles<br />
explained 72.8% and 18.7% for axis I and axis 2 respectively, the total being 91.5% (Table<br />
4).<br />
It is evident from Table 4 that there was a big contrast between the two seasons (1997 and<br />
1998) but the pattern of genotypes within seasons was similar. This is due to intermediate<br />
negative CV1 scores versus intermediate to low positive scores. <strong>The</strong> horizontal separation<br />
(CV1) accounted for 72.8% of the total variation and thus made a large contribution. Also the<br />
interaction effects shown by T4, Palmiet and to a lesser extent SST 57 and SST 876 deviated<br />
more from the others.<br />
<strong>The</strong> correlations between variates (Table 5) show vitreou~ kernels had a positive correlation<br />
(r = 0.63) with SKCS-hardness index. <strong>The</strong> correlations with alveograph P/L ratio (r = 0.40)<br />
and alveograph strength were also positive (r = 0.38) but slightly lower. Optimum endosperm<br />
starch and protein contents are very important for alveograph P/L ratio and in particular<br />
vitreous kernels and SKCS-hardness index. Increase or decrease in either starch or protein<br />
may cause dilution (lack of sufficient bonds for interaction) in the other and these results in<br />
lower values for these parameters. This was the case for 1998 where grain filling was higher<br />
at all sites. Mixograph development time showed high positive correlation with alveograph<br />
strength (r = 0.71) and lower positive correlation with SDS-sedimentation (r = 0.38) and loaf<br />
volume at 12% protein (r = 0.45). All of these four parameters show a positive relationship<br />
with each other and are indicative of better protein quality.<br />
<strong>The</strong> alveograph PIL ratio showed a fairly high positive correlation with SKCS hardness index<br />
(r = 0.65) and a negative correlation with SDSS (-0.548). <strong>The</strong> positive relationship between<br />
the two former parameters could relate to harder wheats having slightly more starch damage<br />
with subsequent distortion of extensibility versus stability of the alveograph. This is also<br />
reflected in the negative correlation of r = 0.67 between SDSS and SKCS hardness index<br />
values. Sodium dodecylsulfate sedimentation volume (SDSS) measures the flour protein<br />
aggregate ability, which was probably damaged.<br />
114
Milling and baking quality ofSouth African irrigated wheat cultivars - Mamuya el at.<br />
<strong>The</strong> main variates which discriminated between interaction effects CVl (x-axis) (Figure 1)<br />
were SDS-sedimentation (r = 0.958), SKCS-HI (r = 0.781), alveograph P/L ratio (r = -0.571)<br />
and vitreous kernels (-0.563), which had the most significant correlation with CV1 scores<br />
(Table 5).<br />
<strong>The</strong> main variates which discriminated between interaction effects for CV2 (y=axis) (Figure<br />
1 and Table 5) were mixograph development time (r = -0.91), alveograph strength (r = -0.85)<br />
and loaf volume (12% protein) (r = -0.57). <strong>The</strong> CV2 accounted for 18.7% of the total<br />
variation.<br />
<strong>The</strong>refore in conclusion, Figure 1 shows that the pattern for most genotypes within seasons<br />
was very similar. This is shown by codes 2 and 12 (T4), 8 and 16 (SST876), 9 and 17<br />
(SST57),4 and 11 (Kariega), 6 and 14 (SST825), 5 and 15 (SST822), 7 and 18 (Inia), 3 and<br />
10 (Marico). Palmiet (codes 1 and 13) showed unstable quality characteristics. This shows<br />
that despite the environmental conditions having influence on quality parameters, genotype<br />
potential should be the prime objective together with positive environmental interactions. In<br />
ascending order, genotypes like T4;- Palmiet and SST876 had less potential for most of the<br />
parameters, particularly T4 and Palmiet. Nevertheless, Palmiet showed positive<br />
environmental interactions in some locations and it may perform well, also the performance<br />
was intermediate at most of the sites when the environments were not as ideal as it was<br />
during 1997. SST57 showed intermediate potential, whereas Marico, Kariega, SST822,<br />
SST825 and Inia showed intermediate to higher potential. <strong>The</strong>refore these genotypes may<br />
give desirable results at most of the sites for various parameters despite seasonal<br />
environmental variations.<br />
REFERENCES<br />
Digby, P., Galwey, N. and LOWE, P. , 1989. Genstat 5: A second course. Oxford University Press, Oxford.<br />
Gauch, H.G., 1988. Model selection and validation for yield trials with interaction. Biometrics 4: 705- 715.<br />
Gauch, H.G. and Zobel, R. W., 1988 Predictive and postdictive success of statistical analyses of yield trials.<br />
<strong>The</strong>or. Appl. Genet 76: 1-10.<br />
Graybosch, R.A., Peterson, C.J., Baenziger, P.S. and Shelton, D.R., 1995. Environmental modification of hard<br />
red winter wheat protein composition. 1. Cereal Sci. 22, 45-51.<br />
Howard, N. and Wessels, A., 1997. <strong>Wheat</strong> cultivar: Milling and Baking Performance Analysis. Personal<br />
Communication.<br />
Lukow, O.M. and McVetty, P.B.E., 1991. Effect of cultivar and environment on quality characteristics of spring<br />
wheat. Cereal Chern. 68, 597-601.<br />
Peterson, C.J., Graybosch, R.A., Baenziger, P.S. and Grombacher, A.W., 1992. Genotype and environment<br />
effects on quality characteristics of hard red winter wheat. Crop Sci. 32: 98-103.<br />
Preston, K.R., Lukow, O.M. and Morgan, B., 1992. Analysis of relationship between flour quality properties<br />
and protein fractions in a world wheat collection. Cereal Chern. 69: 560-567. ,<br />
Purchase, 1.L., 1997. Parametric analysis to describe genotype x environment interaction and yield stability in<br />
winter wheat. Ph .D. <strong>The</strong>sis. University of the Orange Free State, 1997.<br />
Rasper, V., 1993. Dough rheology and physical testing of dough. In: B.S. Kamel and C.E. Stauffer (eds).<br />
Advances in Baking Technology, pp. 107-133. London : Blackie Academic and Professional<br />
Publishers.<br />
van Lill, D. and Purchase, 1.L., 1995 . Directions in breeding for winter wheat yield and quality from 1930 to<br />
1990. Euphytica, 82: 79-87 .<br />
115
Milling and baking quality ofSouth African irrigated wheat cultivars - Mamuya et al.<br />
Table 1. Cultivars and locations, 1997 and 1998.<br />
Marico<br />
Kariega<br />
T4<br />
Palmiet<br />
SST 825<br />
SST 822<br />
SST 876<br />
SST 57<br />
SST 55<br />
SST 65<br />
Inia<br />
Small Grain Institute<br />
Small Grain Institute<br />
Small Grain Institute<br />
Sensako<br />
Sensako<br />
Sensako<br />
Sensako<br />
Sensako<br />
Sensako<br />
.Small Grain Institute<br />
Barkley-West <br />
Prieska <br />
Hopetown <br />
Douglas <br />
Loskop <br />
Koedoeskop <br />
116
Milling and baking quality ofSouth African irrigated wheat cultivars - Mamuya et al.<br />
Table 2. Milling and baking quality tests conducted on grain obtained from 11 spring wheat cultivars grown under irrigated<br />
conditions.<br />
~~~ •.'. '.~''!;Millilif!''liRi'~I6r1,ieIt1tSi::: . , ,...' .' I .• I<br />
. ' :;~ " .~~ ···' :~Y. : nou~b ;q mi liw.lite$tS'. ~;: -~BaJdggliu»lit&1tes~~ '. ' c~"'G "tln(i)tilJitV' '~~ : . " •<br />
'. " .~. /", ' . /('..: " . ' ' r . :~ ., "' _~ ".' , I L • • 1;:. ~ ''-'' .Jm. . ., . {fL$.~$.. _, ., ,<br />
Grain protein content (Leco and NIR) - Flour protein content - AACC 39-11 Baking test - AACC 10-09 Wet Gluten test<br />
AACC 39-11<br />
• Break flour yield Mixograph (MDT) - AACC 54-40A SDS-sedimentation (SDSS) <br />
AACC 56-57<br />
• Buhler mill flour extraction - AACC 26 - 21 A Farinograph - AACC 54-21 A <br />
• Vitreous kernels (VK) Alveograph (PIL) - AACC 54-30A<br />
• Thousand kernel mass<br />
• Falling number - AACC 56-81B<br />
• Flour color<br />
• Hectoliter mass<br />
• Single Kernel Characterization System, <br />
diameter, hardness and moisture content <br />
117 <br />
_
Milling and baking quality ofSou th African irrigated wheat cultivars - Mamuya et al.<br />
Table 3.<br />
Discriminate scores of latent vectors for genotypes, 1997 and 1998 seasons<br />
combined.<br />
VK<br />
MDT<br />
P/L<br />
Str<br />
SDSS<br />
LFVI2%<br />
HI<br />
Table 4. Discriminant scores for group means for genotypes, 1997 and 1998<br />
combined.<br />
1<br />
2<br />
3<br />
4<br />
5<br />
6<br />
7 97 In<br />
8 9786<br />
9 9757 98 In<br />
Pa - Palmiet T4 - T4 Ma - Marico<br />
Ka - Kariega 82 - SST 82 85 - SST 857<br />
In - Inia 86 - SST 876 57 - SST 57<br />
Table 5.<br />
Correlation coefficients of those variates retained in the final CVA with<br />
each other and the first two canonical variates.<br />
VK 1.000<br />
MDT 0.158 1.000<br />
P/L 0.395 -0.195 1.000<br />
Str 0.377 0.712 0.035 1.000<br />
LFVI2% 0.051 0.449 -0.120 0.471 1.000<br />
SDSS -0.400 0.383 -0.548 0.229 0.386 1.000<br />
HI 0.627 -0.011 0.650 0.604 -0.010 -0.667 1.000<br />
eVAl -0.563 0.172 -0.571 -0.027 0.240 0.958 -0.781<br />
eVA2 -0.478 -0.909 0.104 -0.848 -0.565 -0.261 -0.157<br />
VK MDT P/L Str LFV12% SDSS HI<br />
118
~ ~ . ...<br />
Milling and baking quality ofSouth African irrigated wheat cultivars - Mamuya et al.<br />
Table 6.<br />
Mean values of the 18 G x E interactions (two years) for all variates<br />
considered in the canonical variate analysis<br />
'-m"<br />
_<br />
:; ;';sF~~~x;"Ce~r' . " ', ~:f~ ,: ' , ,~l~ :;~$K/L ".' ·':lr ~:i " "J );~\l fif($lf~~' '.; ~'. ~ . ~; :"It".' -'<br />
.<br />
> ' ,<br />
. . ", " _,,;'. ' . .. (!l ~': " 'r . ,' ;SS,-' ,' . I ."~ ,, ~ . "I1f4Vi
,_._.__.__.- -- ----- --------------- - --_.<br />
I<br />
!<br />
Plot of mean scores of Genotypes<br />
..J 6.40<br />
4.80<br />
• T4-98 <br />
1- 3.20 • T4-97<br />
?f!. ...... <br />
co<br />
• Pa-98<br />
--~<br />
1.60<br />
N .86-98<br />
1 N<br />
~<br />
-<br />
> Q)<br />
.~<br />
~ co • 86-97<br />
0.00 - .... -.,<br />
u. co .82-98<br />
..J > • Ka-98<br />
• Pa-97 • Ka-9<br />
~i\i .85-98<br />
In-98<br />
en<br />
I<br />
CJ .82-97<br />
« .s: •<br />
-1 .60 - 85-97<br />
57-98•<br />
•<br />
1-- 0 .In-97 Ma-98 I<br />
C c:<br />
I<br />
:E co • Ma-97<br />
U<br />
-3.20 I<br />
LOW ... SDSS HIGH I<br />
I<br />
I]<br />
I<br />
-4.80 HIGH ...<br />
HI<br />
LOW I<br />
PI L<br />
VK<br />
-6.40<br />
I<br />
::I:<br />
-4.80 -3.20 -1.60 0.00 1.60 3.20 4.80 6.401<br />
Canonical variate 1 (72.8%~ .____ __._ _________ _ J<br />
i<br />
Figure 1. Canonical biplot of mean scores for genotypes for the 1997 (97) and 1998 (98)<br />
seasons for nine cultivars<br />
T4 T4 Ma Marico Ka Kariega<br />
57 SST 57 Pa Palmiet 82 SST 822<br />
86 SST 876 In Inia 85 SST 825<br />
120
RESPONSE OF ELITE WHEAT GENOTYPES TO SOWING DATE <br />
IN THE NORTHERN REGION OF THE SUDAN <br />
Orner H. Ibrahim l and O.S. Abdalla 2<br />
I Hudeiba Research Station (ARC), P.O. Box 31, Ed Darner, Sudan<br />
2CIMMYT/ICARDA, P.O. Box 5466, Aleppo, Syria<br />
ABSTRACT<br />
High temperature is a major environmenta1 constraint that limits wheat<br />
cultivation in tropical and subtropical environments. Nonetheless,<br />
considerable variability in bread wheat performance under heat stress<br />
conditions has been reported. In Sudan, the wheat growing season is short<br />
(i.e., 90-100 days). Farmers, particularly in the northern region, often 'delay<br />
wheat planting until December to January, exposing the crop to heat stress.<br />
Delayed plantings are often associated with substantial grain yield losses,<br />
estimated at up to 86% at farm level. A field study was carried out at Hudeiba<br />
for three years, 1995/96-1997/98, with the objective of advising farmers on the<br />
selection of cultivars that suit best to their intended planting time. Fifteen elite<br />
bread wheat genotypes were planted at optimum (mid-November) and late<br />
(mid-December) sowing dates. Delaying sowing date by one month reduced<br />
grain yield by 27%, and genotypes. exhibited significant differential response<br />
to sowing date. Genotype HD2380 was superior under both ear1y and late<br />
plantings. However, medium maturity cultivars, such as "Seri 82", "Debe ira"<br />
and "Wadi el Neil", should be planted at the optimum date, while the early<br />
maturity cultivars such as "Condor", "Nacozari" and "Fang 60", perfo~ best<br />
when late sowing is unavoidable.<br />
INTRODUCTION ·<br />
High temperature is the major environmental constraint that limits wheat production in the<br />
tropical and subtropical hot environments. <strong>The</strong> prevalence of hot spells at the beginning or at<br />
the end of the wheat crop growth cycle can be detrimental to economic (grain) productivity.<br />
High temperatures usually hasten the crop developmental rates (Fischer, 1985), reduce<br />
duration of developmental phases and eventually decrease wheat productivity per unit area.<br />
Nonetheless, considerable variability in bread wheat performance under heat stress<br />
conditions has been reported (Morgunov, 1994), and some morpho-physiological traits were<br />
reported to be associated with heat tolerance in wheat (Reynolds et al., 1994).<br />
In Sudan, wheat is produced as an irrigated, winter season crop. <strong>The</strong> duration of the winter<br />
season fluctuates and is generally short, 90 to 100 days (Ageeb, 1994). Farmers, particularly<br />
in the northern region, often delay planting their wheat crop to December or January, and<br />
priority for early planting is usually given to grain legumes (Ibrahim, 1993) which are more<br />
highly rewarded cash crops. Delays beyond the optimum planting date of wheat are often<br />
associated with substantial grain yield losses, estimated at up to 86% at farm level (Ibrahim,<br />
1996). However, Ibrahim (1996) reviewed sowing date studies in the Sudan and reported<br />
121
Response o/wheat genotypes to sowing date - Ibrahim et al.<br />
differential response of wheat cultivars to sowing date.<br />
<strong>The</strong> cun'ent study attempts to evaluate the yield performance of elite wheat genotypes under<br />
optimum and late sowing dates, with the ultimate goal of providing recommendations to<br />
farmers on cultivar selection suitable to date of sowing. It is hoped that such<br />
recommendations would maximize farmers' yields from optimum sowing dates and minimize<br />
yield losses when late planting is unavoidable.<br />
MATERIALS AND METHODS<br />
Fifteen bread wheat genotypes, including the commercial cultivars (Condor, Debeira, Wadi el<br />
Neil and EI Neilain), were selected from the collaborative research activities with national,<br />
regional . and international (CIMMYT and CIMMYT/ICARDA) wheat improvement<br />
programs. Genotypes inclusion was based on performance over the preceding 3-4 seasons.<br />
<strong>The</strong> selected genotypes were planted within a range of optimum sowing dates (mid<br />
November) and after the optimum range of sowing dates (mid December) for 3 consecutive<br />
seasons (1995/96-1997/98) at Hudeiba Research Farm (17° 34'N, 33° 56'E; 350 m a.s.l.) in<br />
the northern region of Sudan. .<br />
<strong>The</strong> experimental design used was a split-plot (main plots were assigned to planting dates and<br />
subplots were assigned to genotypes) with 3 replications. A net area of 11 m 2 (1995/96) and<br />
4.8 m 2 (1996/97 and 1997/98) was used for the final grain yield harvest. Nitrogen fertilizer,<br />
in form of urea, was applied uniformly to all experimental plots at the rates of 86 kg ha- 1 N<br />
(1995/96 and 1996/97) and 107.5 kg ha- 1 N (1997/98). <strong>The</strong> crop was kept weed-free and<br />
irrigated at 8-12 day intervals.<br />
<strong>The</strong> data collected included: meteorological data (daily ambient air temperature) crop<br />
phenology, biomass yield, grain yield and yield components. Statistical analyses were carried<br />
out using MSTA TC statistical program. (1984). Analysis of variance for all characters<br />
studied was made separately for each season as well as combined analysis over seasons.<br />
RESULTS AND DISCUSSION<br />
<strong>The</strong>rmal Environments<br />
<strong>The</strong> prevailing thermal regimes during the three growing seasons are described as follows:<br />
• <strong>The</strong> 1995/96 season exhibited late season (late-January to late-March) heat stress of about<br />
I-4°C above the long-term (1986/87-1998/99) average (LTA).<br />
• In contrast, the 1996/97 season experienced early season (December to mid-January) heat<br />
stress of about I-5°C above the L T A.<br />
• <strong>The</strong> 1997/98 season was an "average" season with a very short mid-season (late-January<br />
to early-February) heat stress.<br />
Grain Yield<br />
<strong>The</strong> analysis of the grain yield data (Tables 1-3) revealed that grain productivity was<br />
significantly influenced by the season, planting date, genotype and the interactions of<br />
planting date x season, genotype x planting date and genotype x planting date x season.<br />
122
Response ofwheat genotypes to sowing date - Ibrahim et al. <br />
Season Effect <br />
<strong>The</strong> highest seasonal average grain yield (4714 kg ha- 1 ) was obtained in the third growing<br />
season (Table la). <strong>The</strong> lower grain yields in the other two seasons could be attributed to late<br />
and early heat stresses, respectively. In contrast, less heat stress was experienced in 1997/98<br />
cropping season.<br />
<strong>The</strong> late heat stress of 1995/96 resulted in a low partitioning efficiency of assimilates<br />
(reduced harvest index) and reduced grain-filling (small kernel size) in comparison to the<br />
1997/98 season (Table 1 a). On the other hand, early heat stress (1996/97) caused reductions<br />
in total assimilate (biomass) production and the number of spikes m- 2 .<br />
Sowing Date Effect<br />
Delaying planting date by one month (from 15 November to 15 December) reduced grain<br />
productivity by 27% (Table I b) because the crop was exposed to heat stress during the grain<br />
filling period. <strong>The</strong> reductions in grain yield of late planted crops were reflected by low<br />
biomass productivity, low fertility "(fertile spikes m- 2 ), poor grain-fill (small kernel size),<br />
weak partitioning efficiency of assimilates (reduced harvest index), shorter crop growth<br />
cycle, and shorter plant stature (Table 1 b).<br />
Genotype Effect<br />
Averaged over seasons and planting dates, the productivity of genotypes ranged from 3930<br />
(12300) to 4464 kg ha- 1 (HD2380) with a grand average productivity of 4100 kg ha- 1 (Table<br />
Ic). <strong>The</strong> productivity of the commercial cultivars ranged from 4055 (Wadi el Neil) to 4263<br />
kg ha- 1 (Condor). Only one entry (HD2380) was superior to the best check (Condor).<br />
However, four genotypes (HD2380, Seri82, Nacozari and Fang60) exhibited yields higher<br />
than mean yield performance of the commercial cultivars (4092 kg ha- 1 ).<br />
Planting Date x Season Effect<br />
Reduction in grain yield due to late planting varied significantly between seasons (Table 2a).<br />
Delayed planting in 1995/96 resulted in the most severe reduction (37%) in grain yield in<br />
comparison to 1996/97 (25%) and 1997/98 season(21 %). <strong>The</strong> observed severe reductions in<br />
grain yield of late planted crop in 1995/96 season could be attributed to the hot period (1<br />
4°C) that prevailed during spike formation and grain-fill phases.<br />
Genotype x Planting Date Effect<br />
In the ranged o~timum planting dates, grain yield of the wheat genotypes ranged from 4583<br />
to 4984 kg ha- (Table 2b). <strong>The</strong> highest yielding genotypes were Seri82 (4984 kg ha- 1 ),<br />
HD2380 (4927 kg ha- 1 ), Debeira (4871 kg ha- 1 ), F6bulk (4816 kg ha- 1 ), Wadi el Neil (4802<br />
kg ha- I ) and El Neilain (4800 kg ha- 1 ). With the exception of HD2380, all genotypes are of<br />
the medium maturity types (Table 2b).<br />
On the other hand, in the range of late planting dates, grain yield of the evaluated wheat<br />
genotypes ranged from 3068 to 4000 kg ha- 1 (Table 2b). <strong>The</strong> highest grain yield in this<br />
environment was displayed by the genotypes HD2380 (4000 kg ha- 1 ), Condor (3793 kg ha- 1 ),<br />
123
Response ofwheat genotypes to sowing date - Ibrahim et al.<br />
Fang60 (3744 kg ha- I ) and Nacozari (3743 kg ha- l ), and all of these genotypes are early<br />
maturing types (Table 2b). It should be noted that the Indian genotype HD2380 was superior<br />
under both early and late planting situations. In addition, this genotype was characterized by<br />
a stable short crop growth cycle (Table 2b).<br />
<strong>The</strong> above results are in agreement with those reported by Ibrahim (1996) and confirm the<br />
differential response of wheat genotypes to planting date. <strong>For</strong> farmers to obtain maximum<br />
yield, the best option is to cultivate high yielding, medium maturing genotypes within the<br />
range of optimum sowing dates. When late planting is unavoidable, the best option to<br />
minimize yield losses associated with late planting is to cultivate high yielding, early<br />
maturing genotypes such as HD2380, Condor, Fang60 or Nacozari.<br />
Genotype x Planting Date x Season Effect<br />
In late plantings, in each of the three growing seasons, the genotypes HD2380, Condor,<br />
Fang60 and Nacozari were consistently ranked among the highest yielding genotypes (Table<br />
3). With optimum planting and, in seasons characterized by mid to late season heat stress<br />
(1995/96 and 1997/98), the genotype"s HD2380 and Seri82 ranked among the highest yielding<br />
genotypes. Unfortunately, when exposed to early heat stress (during optimum planting,<br />
1996/97 season) these two genotypes ranked among the lowest yielding genotypes (Table 3).<br />
CONCLUSIONS<br />
1. Delaying the planting date of the wheat crops by one month (mid-November to mid<br />
December) in Northern Sudan resulted in substantial grain yield losses (27%).<br />
2. Among commercial bread wheat cultivars, the medium maturing varieties Debeira, Wadi<br />
el Neil and El Neilain should be planted early.<br />
3. Seri82 proved superior at optimum planting dates and is recommended as a strong<br />
candidate for release as a commercial variety for the northern region.<br />
4. <strong>The</strong> genotype HD2380 is superior under both optimum and late planting. In addition, the<br />
genotype HD2380 has shown a number of acceptable traits e.g., early maturity (96 days)<br />
and high single kernel weight. This genotype is recommended for both early and late<br />
plantings.<br />
5. When late planting is unavoidable cultivation of early maturing cultivars such as<br />
HD2380, Condor, Fang60 and Nacozari can help in minimizing the grain yield losses<br />
associated with late planting.<br />
REFERENCES<br />
Ageeb,O.A.A. 1994. Environments for yield testing of wheat popUlations. In: First six-month report for the<br />
ODA holdback project R5960 (H), selection criteria for adaptation to high temperature in wheat.<br />
<strong>Wheat</strong> Program, Mexico, D.F.: CIMMYT. p. 30.<br />
Fischer, R.A. 1985. Physiological limitations to producing wheat in semitropical and tropical environments and<br />
possible selection criteria. In: <strong>Wheat</strong>s for more tropical environments. A Proceeding of the<br />
International Symposium. 18-24 Septemberl984. Mexico, D. F.: CIMMYT.<br />
Ibrahim, O.H. 1993. Effects of sowing time on growth and yield of wheat. In: Nile Valley <strong>Regional</strong> Program on<br />
Cool-Season Food Legumes and <strong>Wheat</strong>-Sudan. Bread <strong>Wheat</strong> Report, Annual National Coordination<br />
124
Response o/wheat genotypes to sowing date - Ibrahim et al.<br />
Meeting, 28 August-I September 1993, Agricultural Research Corporation, Wad Medani, Sudan. p.<br />
160.<br />
Ibrahim,O.H. 1996. Effects of sowing time on wheat production in the Sudan. pp. 90-98 In: Ageeb, O.A.,<br />
Elahmadi, A.B., Solh, M.B. and M.e. Saxena (eds.). <strong>Wheat</strong> Production and Improvement in the Sudan.<br />
Proceedings of the National Research <strong>Workshop</strong>, 27-30 August 1995, Wad Medani, Sudan.<br />
ICARDA/Agricultural Research Corporation. ICARDA, Aleppo, Syria.<br />
Morgunov, A. 1994. Bread wheat breeding for heat tolerance. pp. 29-35. In: Rajaram, S. and G.P. Hettel (eds.).<br />
<strong>Wheat</strong> Breeding at CIMMYT: Commemorating 50 Years of Research in Mexico for Global <strong>Wheat</strong><br />
Improvement. Ciudad Obregon, Sonora, Mexico. Mexico, D.F.: CIMMYT.<br />
Reynolds, M.P., Balota, M., Delgado, M.l.B., Amani, I. and R.A. Fischer. 1994. Physiological and<br />
morphological traits associated with spring wheat yield under hot irrigated conditions. Australian<br />
Journal of Plant Physiology, 21: 717-730.<br />
Questions and Answers:<br />
Amanuel Gorfu: In selecting the sowing dates, what is the basis for taking Nov. 15 as the<br />
first sowing date? If you had considered another sowing date before Nov. 15, do you think<br />
Nov. 15 would still remain an optimum sowing date?<br />
Answer: <strong>The</strong> optimum range of sowing dates at Hudeiba extends from 1 st November to 1 st<br />
December, that is why we selected the mid point of the range, i.e., 15 November.<br />
125
Response ofwheat genotypes to sowing date - Ibrahim et al.<br />
Table 1.<br />
Effect of season, planting date and genotype on mean grain yield and other<br />
crop characters at Hudeiba Research Farm, 1995/96- 97/98.<br />
, Grain Bioillass ' Harvest 'Grains Kernel Plant<br />
yield ' yield Index Days to Spikes p,er weight height<br />
Treatment (kg/ba) , (kg/hal ' (o/~) maturity per ni 2 , spike. ' (mg) (em)<br />
(a) Season effect:<br />
1995/96 3744 11912 3Ll 102 428 44.7 37.2 90<br />
1996/97 3843 10703 35.8 101 295 38.9 38.0 81<br />
1997/98 4714 12862 36.7 101 450 37.4 39.8 90<br />
Effect *** ** *** NS *** *** * ***<br />
SE+ 75 232 0.25 0.3 5 0.27 0.42 0.3<br />
(b) Planting date effect:<br />
15 November (OPT) 4750 13260 36.1 104 414 40.8 41.8 90<br />
15 DecemberiLPT) 3451 10391 33.0 99 367 39.9 34.9 83<br />
Effect *** *** *** *** *** ** *** ***<br />
SE+ 61 189 0.20 0.2 4 0.22 0.35 0.3<br />
(c)Genotype effect:<br />
Seri 82 4247 11442 36.8 102 365 47.9 36.7 83<br />
HD2380 4464 11800 • 37.5 96 433 31.2 46.5 84<br />
Nacozari 4212 11395 36.9 95 405 39.7 36.5 81<br />
Glennson 3998 11943 33.4 101 376 44.2 35.3 88<br />
Giza 165 3987 11875 33.4 104 305 47.4 39.7 92<br />
Debeira 4184 12368 33.7 104 392 39.4 38.8 88<br />
Genaro 81 4053 11727 34.5 101 347 46.9 34.8 80<br />
Gemmeiza 1 3960 11575 34.0 104 302 47.5 39.6 93<br />
Wadi e1 Neil 4055 11815 34.1 104 399 39.1 39.7 90<br />
Fang 60 4187 11198 37.4 93 406 36.4 38.9 88<br />
Condor 4263 11944 35.8 100 478 34.6 37.2 76<br />
F6bulk a 3942 12020 32.5 104 414 40.9 35.1 87<br />
12300 b 3930 12287 31.6 104 432 35.7 37.1 88<br />
145F6 c 3959 12059 32.7 104 419 35.3 36.5 87<br />
El Neilain 4068 11936 33.9 104 388 39.1 42.6 95<br />
Effect *** *** *** *** *** *** *** ***<br />
SE+ 82 142 0.60 0.3 11 0.61 0.35 0.7<br />
C.V.(%) 8,5% 5.1% 7.4% 1.4% 11.7% 6.4% 3.8% 3.4%<br />
a = F6bulk L.2606-90/91; b = 12300XI4PYTV(NH243); and c = 145F6-79/80X14PYTV(NH248). <br />
*, **, *** = Significant at 5, 1 and 0.1 % probability levels, respectively. <br />
NS = Not significant. <br />
OPT = Optimum planting time and LPT = Late planting time. <br />
126
Response ofwheat genotypes to sowing date - Ibrahim et at.<br />
Table 2.<br />
Effect of planting date within season and genotype within planting date<br />
on mean grain yield and other crop characters at Hudeiba, 1995/96-97/98.<br />
Grain Harvest Grains Kernel Plant<br />
yield Bhunass Index 'Days to Spikes per weight , height<br />
Treatment (kg/ba) (kg/ba) (0/0) maturity perm 2 spike (m~) (em)<br />
(a) Planting date x season effect:<br />
OPT x 1995/96 4607 14008 32.9 106 444 46.9 40.7 94<br />
LPT x 1995/96 2882 9817 29.3 98 412 42.6 33.7 86<br />
OPT x 1996/97 4389 11495 38.3 103 332 38.1 42.0 81<br />
LPT x 1996/97 3297 9911 33.3 99 258 39.7 34.1 80<br />
OPT x 1997/98 5256 14278 36.9 103 468 37.4 42.6 96<br />
LPT x 1997/98 4173 11446 36.4 98 431 37.5 37.0 85<br />
Effect * * ** ** ** *** NS ***<br />
SE+ 106 328 0.35 0.4 7 0.39 0.60 0.4<br />
iblGenotype x planting date effect:<br />
Optimum plantin?, date (15 November)<br />
Seri 82 4984 12872 38.8 105 378 48.3 40.4 86<br />
HD2380 4927 12731 38.6 97 465 30.2 48.5 84<br />
Nacozari 4680 12395 • 38.1 96 455 37.5 38.5 83<br />
Glennson 4669 13325 35.4 104 378 46.3 39.1 91<br />
Giza 165 4655 13633 34.3 107 311 49.4 43.6 97<br />
Debeira 4871 14146 34.5 107 421 40.2 42.3 92<br />
Genaro 81 4713 13143 36.1 103 354 48.1 38.3 84<br />
Gemmeiza 1 4646 13167 35.4 107 316 49.2 43.4 98<br />
Wadi el Neil 4802 13340 36.1 108 426 40.7 43.2 95<br />
Fang 60 4630 12019 38.9 94 460 33.6 42.0 90<br />
Condor 4733 13172 36.4 102 511 34.1 40.5 78<br />
F6bulk" 4816 13700 35.'2 108 425 42.0 39.1 92<br />
12300 b 4747 14116 33.7 107 467 35.9 41.0 91<br />
145F6 c 4583 13507 34.2 108 438 35.9 40.5 90<br />
EI Neilain 4800 13637 35.3 108 413 40.6 45.9 101<br />
Late plantinf!, date (15 December)<br />
Seri 82 3509 10013 34.7 99 352 47.5 33.0 80<br />
HD2380 4000 10869 36.3 94 400 32.1 44.5 83<br />
Nacozari 3743 10395 35.7 93 355 42.0 34.5 80<br />
Glennson 3326 10561 31.4 98 375 42.1 31.5 84<br />
Giza 165 3319 10118 32.6 101 300 45.4 35.8 87<br />
Debeira 3497 10591 32.9 101 363 38.7 35.3 84<br />
Genaro 81 3394 10311 32.9 98 341 45.7 31.4 76<br />
Gemmeiza 1 3274 9983 32.6 100 288 45.8 35.7 89<br />
Wadi el Neil 3308 10291 32.0 101 372 37.5 36.2 85<br />
Fang 60<br />
3744 10376 35.9 92 352 39.2 35.8 I 86<br />
Condor 3793 10716 35.2 98 445 35.2 33.9 74<br />
F6bulk a 3068 10339 29.7 100 404 39.8 31.2 83<br />
12300 b 3114 i0458 29.4 100 397 35.5 33.3 85<br />
145F6 c 3335 10611 31.3 101 400 34.6 32.6 83<br />
El Neilain 3335 10236 32.5 100 362 37.7 39.2 90<br />
Effect ** *** NS *** * *** *** ***<br />
SE+ 116 201 0.85 0.5 15 0.86 0.49 1.0<br />
C.V.(%) 8.5% 5.1% 7.4% 1.4% 11.7% 6.4% 3.8% 3.4%<br />
a = F6bulk L.2606-90/91; b = 12300X14PYTV(NH243); and c = 145F6-79/80X14PYTV(NH248). <br />
*, **, *** = Significant at 5,1 and 0.1% probability levels, respectively. <br />
NS = Not significant. <br />
OPT = Optimum planting time and LPT = Late planting time. <br />
127
Response ofwheat genotypes to sowing date - Jbrahim et al.<br />
Table 3.<br />
Mean grain yield (kglha) of elite wheat genotypes as influenced by<br />
planting date in the three growing seasons (1995/96-1997/98) at the<br />
Hudeiba Research Farm.<br />
Optimum plantlngdate (15. Nov.)<br />
Lat~ planting date (15 Dec.)<br />
Genotype 95/96 96/97 97/98 95/96 96/97 97/98<br />
Seri 82 5079 4202 5673 2707 3681 4139<br />
HD2380 5089 4151 5541 2988 3909 5103<br />
Nacozari 4514 4139 5387 2917 3606 4707<br />
Glennson 4377 4318 5313 2941 3040 3995<br />
Giza 165 4292 4332 5340 2796 3068 4092<br />
Debeira 4535 4536 5543 3009 3195 4286<br />
Genaro 81 4759 4481 4898 2997 3515 3670<br />
Gemmeiza 1 4361 4434 5143 2669 3261 3891<br />
Wadi el Neil 4462 4557 5386 3209 2656 4058<br />
Fang 60 4850 3927 5114 2966 3582 4683<br />
Condor 4638 4479 5082 2968 3755 4657<br />
F6bulk a<br />
4574 . 4479 5395 2768 2902 3534<br />
12300 b<br />
4353 4842 5046 2416 2950 3976<br />
145F6 c 4494; 4535 4719 2889 3052 4064<br />
El Neilain 4721 4421 5257 2983 3287 3737<br />
Effect **<br />
SE+ 202<br />
C.V.(%) 8.5<br />
a = F6bulk L.2606-90/91; b = 12300XI4PYTV(NH243); and c = 145F6-79/80XI4PYTV(NH248).<br />
*, **, *** = Significant at 5,1 and 0.1 % pro\Jability levels, respectively.<br />
NS = Not significant.<br />
128
FIELD PERFORMANCE OF MIXTURES OF FOUR WHEAT CULTIV ARS <br />
IN SUDAN <br />
Mohamed S. Mohamedl, Abu Elhassan S. Ibrahim2, Asharaf M. Elhashim land <br />
Izzat S.A. Tahir l <br />
1Agricultural Research Corporation, Wad Medani, Sudan <br />
2University of Gezira, Wad Medani, Sudan <br />
ABSTRACT<br />
<strong>Wheat</strong> (Triticum aestivum L.) genotypic mixtures were studied for two<br />
seasons, 199711998 and 1999/2000, at the Gezira Research Station, Wad<br />
Medani, Sudan. Four agro-morphologically distinct commercial cultivars, viz.,<br />
Debeira, Condor, Argine and Neilain, were compared with all two-way<br />
mixtures in addition to 3: 1 and 1:3 ratios of Debeira and Condor. Means for<br />
grain yield were significantly different in the first season only. Plant height<br />
conferred a high competitive ability upon Neilain, the tallest cultivar, which<br />
suppressed admixture genotypes in both seasons. On the contrary, Debeira,<br />
being taller than Condor, was a poor competitor in IDebeira:lCondor and<br />
3Debeira: 1 Condor mixtures. However, in the second season, the same<br />
combinations outyielded all other mixed stands. In the first situation, growth<br />
habit, rate and cycle, related to early flowering and maturity of Condor, were<br />
probably effective competitive factors. Reversal of mixture performance in the<br />
second season could be related to genotype-environment interactions of<br />
component cultivars. While 1 Argine: 1 Condor performance was second best<br />
amongst mixed stands in the first season, it was the poorest in the second<br />
season. 1 Debeira: 1 Argine outyielded all other mixed stands, was second best<br />
among all treatments in the first season, and ranked third in second season.<br />
<strong>The</strong> mixture out yielded its component genotypes. in both seasons. Although<br />
the increase in Debeira grain yield more than compensated for the loss III<br />
Argine, complementary competition was indicated.<br />
INTRODUCTION<br />
Previous studies on intergenotypic mixtures of self pollinated cereal crops indicated a better<br />
yield performance and stability over the performance of component genotypes in pure stand.<br />
Usually the mixture outyielded its components mid-monoculture but not the highest yielding<br />
component in pure stand (Sharma and Prasad, 1978). Mixture performance depends on the<br />
interactions and competitive effects between the component genotypes. Schutz et at. (1968)<br />
developed a model applicable to completely homozygous, self-fertilizing crops when grown<br />
in mixtures and identified the following types of interactions:<br />
• Neutral, absence of competitive effects,<br />
• Complementary, gain in one genotype is offset by the loss in the other,<br />
• Over compensatory, mutual advantageous combination i.e. significant increase in mixture<br />
performance,<br />
• Under compensatory, disadvantageous combination i.e. lower performance of mixture.<br />
129
Mixtures offour wheat cultivars in Sudan - Mohamed et·al.<br />
High temperature is the main wheat production constraint in the Sudan where the winter is<br />
short and warm. <strong>The</strong> use of intergenotypic mixtures may modify the micro-environment of<br />
the wheat crop through differences in leafiness, height and tillering ability. In an alternative<br />
attempt to increase productivity and yield stability, studies on intergenotypic mixtures were<br />
conducted under Sudan's 'unique' wheat growth environment. <strong>The</strong> objectives were to study<br />
the interactions of varietal mixtures and identify high-yielding harmonious combinations, if<br />
possible.<br />
MATERIALS AND METHODS<br />
Four agro-morphologically distinct commercial bread wheat cultivars were used in this study:<br />
• Neilain (N), tallest and early in heading and latest in maturity;<br />
• Debeira, second tallest and mid-early in heading and maturity;<br />
• Argine (A), third shortest and latest in heading and with mid-maturity;<br />
• Condor (C), shortest and earliest in heading and maturity.<br />
In addition, 1: 1 binary mixtures of all genotypes were studied. In addition, Debeira and<br />
Condor were studied in 3: 1 and 1:3 mixed stands. Mixing of genotypes was calculated on<br />
basis of seed number. <strong>The</strong> experiment comprised of twelve treatments: four pure stands, six<br />
1: 1 binary mixed stands and two 3: 1 and I:3 mixtures of Debeira and Condor. <strong>The</strong> twelve<br />
treatments were arranged in a randomized complete-block design with 4 replications. Each<br />
treatment was sown in 16 rows, 5 m long and 0.2 m apart. <strong>The</strong> experiment was conducted for<br />
two seasons, 1997-98 and 1999-2000, at Gezira Research Station, Wad Medani, Sudan (14 0<br />
24'N 33 0 38'E 400 m a.s.1. <strong>The</strong> experiment was planted during the 4th week of November at a<br />
seeding rate of 100 kg ha- 1 • Nitrogen and phosphorus fertilizer were applied at sowing at the<br />
rate of 86 kg N ha- 1 and 43 kg P ha- 1 • Sowing seeds were treated with Gaucho for controlling<br />
both termites and aphids. <strong>The</strong> experiment was irrigated every 2 weeks and hand-weeded.<br />
Measured characters included flowering, maturity, plant height, productive tillers (number of<br />
spikes m""2), kernels spike-I, thousand kernel weight and grain yield. Component cultivars in<br />
mixed stands were separated according to spike type. <strong>The</strong> results for each season were<br />
analyzed for differences. According to De Wit and Van der Bergh (1965), the following<br />
calculations was made:<br />
Yielding ability (%) (Y mixIY mono)/ 100<br />
Relative yield total = Yz [(Yab mix/Yaa mono) + (Yba mix/Ybb mono)]<br />
Mean relative yield (%) (Y mixlYmid-mono)/1 00<br />
Where,<br />
Yab mix = yield of genotype a (kg ha- 1 ) in mixed stand with genotype b;<br />
Yaa mono = pure stand yield (kg ha-') of genotype a;<br />
Yba mix = yield (kg ha- 1 ) ofgenotype b in mixed stand with genotype a;<br />
Ybb mono = pure stand yield (kg ha- 1 ) ofgenotype b;<br />
Ymix<br />
= yield (kg ha-') of mixed stand;<br />
Ymono = pure stand yield (kg ha- 1 ) of higher yielding genotype; and<br />
Ymix-monoculture yield (kg ha- 1 ) = (Yaa mono + Ybb mono)/2<br />
Competitive ability = percent grain or loss of a genotype in mixed stand relative to its pure<br />
stand yield (kg ha- 1 ).<br />
130
Mixtures offour wheat cuttivars in Sudan - Mohamed et at.<br />
RESULTS AND DISCUSSION <br />
<strong>The</strong> mean performance of the treatments for grain yield is presented in Table 1. Means for the<br />
first season were associated with significant differences (P 0.05) and means for the second<br />
season were all similar. In the first season, Neilain performance in pure stand out yielded all<br />
treatments, ID:IA ranked second, followed by Debeira pure stand, lA:lC mixture and<br />
Argine pure stand. 1 D: 1 A combination out yielded its component genotypes pure stand with<br />
101.88 yielding ability, 1.07 relative yield total and 102.77 mean relative yield (Table 2).<br />
Although the increase in Debeira performance was more, +6.88, than the decrease in Argine<br />
performance, -1.41 (Table 3), complementary competitive effects were indicated. A similar<br />
trend of mixture performance was demonstrated by 1 A: 1 C with 100.66 yielding ability, 1.01<br />
relative yield total and 100.84 mean relative yield. In this combination, Argine was more<br />
competitive, 2.76, than Condor, -1.07. <strong>The</strong> performance of D:C genotypic mixtures,<br />
especially in ID:IC and 3D:IC mixed stands, was modest. Debeira performance in the two<br />
mixed stands was significantly inferior to its performance in pure stand. Debeira, though<br />
taller, was less competitive, -17.75, with shorter Condor, 2.76, and plant height had no<br />
competitive advantage. Other factors such as growth habit, growth rate and cycle, early<br />
flowering and maturity may have been involved. Sage (1971) studied the behavior or<br />
mixtures of wheat cultivars having wide phenotypic differences and found that height and<br />
earliness in maturity were strong competitive characters. <strong>The</strong> performance of Neilain in<br />
association with the other 3 cultivars, Debeira, Argine and Condor was unharmonious,<br />
indicating under compensatory competition. Neilain, being taller, suppressed its component<br />
cultivars in mixed stands. In this situation, plant height conferred high competitive ability.<br />
Since the means of the treatments for the second season were not significantly different, our<br />
discussion will consider the general trend of the performance of the treatments. Three<br />
genotypic mixtures, ID:IC, 3D:IC and ID:IA out yielded all other treatments. Argine was<br />
the leading cultivar in pure stand. Three genotypic mixtures, 1A: 1C, '1 D: 1 N ~md 1 D:3C<br />
indicated lower performance than the performance of component genotypes in pure stand.<br />
<strong>The</strong>se included 1 A: 1 C which was second best mixed stand in first season. Of interest is the<br />
good performance of ID: 1 C and 3D: 1 C mixed stand in this season. At this point there is no<br />
possible explanation for this change in the performance of the two mixtures except for<br />
genotype-environment interactions.<br />
Based on these results ID: lA genotypic mixture only demonstrated harmonious performance<br />
in the two seasons.<br />
REFERENCES<br />
De Wit, C.T. and J.P. van de Bergh. 1965. Competition between herbage plants. Neth. 1. Agric. Sci. 13: 212<br />
221.<br />
Sage, G .C.M. 1971. Intervarietal competition and its possible consequences for the production of F I hybrid<br />
wheat. 1. Agric. Sci. (Cambridge) 77: 491-498.<br />
Schutz, W.M., Brim, c.A. and S.A. Usanis. 1968. r. Feedback system with stable equilibria in populations of<br />
autogramous homozygous lines. Crop Sci., 8: 61-66.<br />
Sharma, S.N. and R. Prasad. 1978. Systematic mixed versus pure stands of wheat genotypes. J. Agric. Sci.<br />
(Cambridge) 90: 441-444.<br />
131
Mixtures offour wheat cuttivars in Sudan - Mohamed et at.<br />
Questions and Answers:<br />
Sewalem Amogne: What is the reason for 1Debeira: 1 Argine to ranking first in the first<br />
season but third in the second season in terms of grain yield?<br />
Answer: This was attributed to genotype by environment interaction. 1999-00 season<br />
encountered high temperature during the season or late season and adversely affected both<br />
genotypes.<br />
Sewalem Amogne: Do you think it is logical to mix early- and late-maturing varieties<br />
together? <strong>The</strong>re will be a problem of harvesting.<br />
Answer: Maturity differences are not that big - 5-8 days. Early and late maturity can tolerate<br />
early-season and late-season heat stress better.<br />
Vicki Tolmay: Do farmers and "end users" find the mixtures acceptable?<br />
Answer: This is a question that we are raising and since our wheat varieties are more or less<br />
similar in maturity and quality we expect acceptance. We have to have an answer to this<br />
question.<br />
Table 1.<br />
Means for yield (kg/ha) of pure and mixed stands.<br />
Season<br />
Treatment<br />
1997-98' 1999-2000<br />
Debeira<br />
4478 AB 4069<br />
Condor<br />
4385 AB 4000<br />
Argine<br />
4401 AB 4203<br />
Neilain<br />
4921 A 4160<br />
Debeira:Condor 1: 1<br />
3876 B 4366<br />
Debeira:Argine 1: 1<br />
4562 AB 4213<br />
Debeira:Neilain 1: 1<br />
4398 AB 3933<br />
Argine: Condor 1:1<br />
4430 AB 3803<br />
Argine:Neilain 1:1<br />
4128 AB 4177<br />
Condor:Neilain 1: 1<br />
4216 AB 4041<br />
Debeira:Condor 3: 1<br />
4009 B 4210<br />
Debeira:Condor 1 :3<br />
4218 AB 3953<br />
S.E. ±<br />
248<br />
Means within the same column having the same letter(s) are not sIgmficantly dIfferent at the<br />
5% level of the LSD test.<br />
132
Mixtures offour wheat cultivars in Sudan - Mohametl et al.<br />
Table 2.<br />
Yielding ability (%), relative yield total and mean relative yield of mixed<br />
stands.<br />
Mixed Yielding ability (%) . Relative yield total Mean relative yield (%)<br />
stand 1997-98 1999~00 1997.;.9$ 1999~00 1997;:.98 • 1999-00<br />
ID:IC 86.56 107.30 0.871 1.09 87.47 108.20<br />
ID:IA 101.88 100.20 1.027 1.030 102.77 101.90<br />
ID:IN 89.45 94.50 0.940 0.95 93.57 I 95.80<br />
1A:IC 100.66 90.90 1.008 0.93 100.84 92.70<br />
lA:IN 83.88 99.40 0.923 1.00 88.57 99.90<br />
1C:IN 85.88 97.0 0.928 0.99 90.50 99.00<br />
3D:IC 89.45 104.8<br />
.<br />
1.007 1.41 90.39 105.70<br />
ID:3C 94.18 97.2 0.948 0.90 95.17 98.00<br />
Table 3.<br />
Competitive ability of genotypes; percent gains (+) or losses (-) as<br />
compared to pure stand, 1996-97.<br />
Associate producer Debeira ' 'Condor Argine Neilain<br />
Debeira 0.000 -17.75 +6.88 -3.22<br />
Condor +6.50 0.00 -1.07 -17.67<br />
Argine -1.41 +2.76 0.00 -24.14<br />
Nei1ain -8.99 +8.74 +3.33 0.00<br />
• <br />
133
THE ASSESSMENT AND SIGNIFICANCE OF PATHOGENIC VARJABILITY <br />
IN PUCCINIA STRIIFORMIS IN BREEDING FOR RESISTANCE TO <br />
STRIPE (YELLOW) RUST: AUSTRALIAN AND INTERNATIONAL STUDIES <br />
C.R. Wellings 1 , R.P. Singh 2 , R.A. McIntosh I and A. Yahyaoui 3<br />
I<strong>The</strong> University of Sydney, Plant Breeding Institute Cobbitty, Private Bag 11, <br />
Camden, NSW 2570, Australia <br />
2CIMMYT, Apartado Postal 6-641, 06600, Mexico D.F., Mexico <br />
3ICARDA, P.O. Box 5466, Aleppo, Syria <br />
ABSTRACT<br />
Stripe (yellow) rust, caused by Puccinia striiformis, continues to cause crop<br />
losses in several regions of the world. National and international control<br />
strategies focussing on breeding resistant cultivars are dependent on relevant<br />
infonnation concerning the nature and extent of pathogenic variation. Detailed<br />
studies in Australia have shown a progressive evolution of pathotypes which<br />
have, in some instances, led to epidemics and caused significant problems for<br />
commercial wheat production. Recent changes in the pathogen population<br />
have caused potential problems for the barley industty. While studies have<br />
been undertaken in certain locations for varying periods of time, the<br />
continuing need for specialist facilities, experienced staff and common<br />
differential testers has generally resulted in discontinuous data sets. In order to<br />
overcome these difficulties, and provide a basis for regular data collection, a<br />
simplified method based on field assessment of near isogenic lines (NILs) has<br />
been evaluated in several international locations. <strong>The</strong> NILs, which are based<br />
on a selection of the susceptible spring wheat cultivar Avocet, have allowed<br />
the effectiveness of a range of single resistance genes to be detennined. Data<br />
arising from this international project has provided evidence for regional<br />
differences in pathogenic variability between populations of P. striiformis f.sp.<br />
tritici. <strong>For</strong> example virulence for Yr1 was common in the eastern districts of<br />
Central Asia, China and certain locations in India. However, virulence for Yr9<br />
was more widespread in diverse locations including the Middle East (Iraq,<br />
Turkey, Syria), China, Africa (Uganda), Australasia (New Zealand) and South<br />
and Central America (Chile, Ecuador, Mexico). Avirulence for certain genes,<br />
including Yr5, Yr15 and Yr18, suggests potential usefulness of these genes in<br />
breeding programs. However, virulence for the fonner two resistance genes<br />
reported elsewhere would preclude their adoption in some breeding programs.<br />
<strong>The</strong> paper will describe these studies, and discuss the use of the data in<br />
breeding programs aimed at the release of stripe rust resistant wheats.<br />
INTRODUCTION<br />
Stripe or yellow rust, caused by Puccinia striiformis Westend., has traditionally been<br />
associated with cereal production in the cool, temperate regions of the world including the<br />
Americas, Europe, Asia, the Middle East, Central and South East Asia, Russia, China and<br />
East and Central Africa. <strong>The</strong>se environments, which may include a large array of latitude and<br />
134
Assessment o/pathogenic variability in stripe rust - Wellings et al.<br />
elevation combinations, are generally characterized by varying periods of cool temperature (0<br />
°c to 15°C) and high humidity in the crop canopy which are necessary for infection and<br />
disease development. Where the~e environmental conditions coincide with available<br />
pathogen inoculum and susceptible host material, including specific cereal and grass genera,<br />
stripe rust epidemics of varying intensity and duration may develop.<br />
<strong>The</strong> introduction of the stripe rust pathogen to certain new areas that were environmentally<br />
conducive to epidemic development has resulted in significant national issues over the past<br />
20 years. This progressive extension of the geographical distribution of stripe rust has served<br />
to highlight the important influence tbat human transport assumes in global plant disease<br />
epidemiology. <strong>The</strong> following incidents illustrate this principle:<br />
1. <strong>The</strong> discovery of barley stripe rust in Central America in 1975 (Dubin and Stubbs, 1986)<br />
and subsequently North America in 1991 (Marshall and Sutton, 1995). <strong>The</strong> evidence<br />
suggests that the introduction to Colombia (Central America) originated from Europe,<br />
whereas the detection in Mexico was thought to be related to travel by people undertaking<br />
clandestine activities from Central America (H.J. Dubin, pers. comm.).<br />
2. <strong>The</strong> first report of wheat stripe rust in Australia in 1979 was suggested to be due to<br />
contaminated clothing on international air travelers from Europe (WeI lings et at, 1988).<br />
<strong>The</strong> authors provided evidence including spore survival and common features between<br />
stripe rust detected in the initial outbreak in Australia and those of the contemporary<br />
pathogen population in southern Europe.<br />
3. <strong>The</strong> first detection of wheat stripe rust in South Africa was reported in 1996 (Pretorius et<br />
I ,<br />
at., 1997). Initial / isolates appeared to be phenotypically similar to pathogen<br />
characteristics known in the Middle East, and hence human transport may again be<br />
implicated.<br />
/<br />
<strong>The</strong> significance of unique pathogen isolates introduced into newly defined geographical<br />
regions, referred to in this paper as exotic introductions, can only be determined on the basis<br />
of current knowledge of pathogen populations in those pa.rticular regions. <strong>The</strong> availability of<br />
this background data can be critical in allowing a basis for predicting the expected<br />
contemporary impact of such introductions, and provide the possibility of introducing control<br />
strategies, such as importing resistant cultivars and introducing diverse resistances to<br />
breeding programs.<br />
Recurrent stripe rust epidemics have occurred throughout the Middle East, West Asia and<br />
Pakistan during the 1990s and more recently in the Central Asian republics over the past<br />
several years. <strong>The</strong>se epidemics were associated with the widespread deployment of cultivars<br />
previously protected by the resistance gene Yr9. In these regions where the magnitude of<br />
pathogen inoculum has dramatically increased, the opportunities for further pathogenic<br />
evolution have also escalated and thereby assumed a potential threat to the deployment of<br />
current and future resistant cultivars.<br />
Our objectives in this paper are to review factors governing the nature and importance of<br />
pathogen variability in the context of cultivar development and deployment. Examples will<br />
be drawn from Australian and international studies which have been directed at<br />
methodologies for monitoring pathogenic change in P. striiformis populations.<br />
135
Assessment a/pathogenic variability in stripe rust - WeLlings et al. <br />
Factors Influencing Pathogenic Variability in P. striiformis <br />
It is convenient to consider two broad areas of pathogenic variation that have been observed<br />
in the capacity of this pathogen to cause disease. <strong>The</strong>se can be conveniently regarded as<br />
specialization between hosts, and specialization within hosts. <strong>The</strong> former is that<br />
specialization that has been noted between various host genera in their respective capabilities<br />
to support the growth and survival of pathogen isolates. <strong>The</strong> International Code of Botanical<br />
Nomenclature recognizes the taxonomic unit offorma speeialis (literally "special form") to<br />
describe this variation which was first reported for P. striiformis in Europe by Eriksson and<br />
Henning in 1894. Although this concept has been widely appreciated, there remain several<br />
areas of contention which are important in understanding global variation in P. striiformis.<br />
In addition to differences in host range, further levels of specialization within defined<br />
collections of certain hosts were observed in the USA for the wheat stem rust pathogen (P.<br />
graminis Pers. f. sp. tritid) by Stakman and colleagues in 1917, and later in P. striiformis by<br />
Allison and Isenbeck (1930) in Europe. This second level of specialization within hosts has<br />
been variously termed biologic form, physiologic race, strain or pathotype.<br />
1. <strong>For</strong>mae specia/es in P. striiformis<br />
Since the initial work of Eriksson in 1894 and subsequent contributions in the early twentieth<br />
century, a corpus of research accumulated in an attempt to describe the limits of host range<br />
variability within P. striiformis. <strong>The</strong> following represents an attempt to draw conclusions<br />
from this work:<br />
P. striiformis f. sp. tritici (Eriksson, 1894; Pst), the pathogen of wheat stripe (yellow) rust,<br />
has a host range which is predominantly wheat, but also includes certain barley, rye and<br />
triticale genotypes. Other hosts include the weedy grasses encompassing species within the<br />
Hordeum, Agropyron, Phalaris, Hystrix and Bromus genera (Hungerford and Owen, 1923;<br />
Zadoks, 1961; Holmes and Dennis, 1985).<br />
P. striiformis f. sp. hordei (Eriksson, 1894; Psh), th~ pathogen of barley stripe rust,<br />
principally infects barley although it has also been reported to cause disease on certain wheats<br />
(Stubbs, 1985). <strong>The</strong> host range has also been noted to include weedy grasses, in particular<br />
Hordeum murinum (Zadoks, 1961) and H. jubatum and H. leporinum (Marshall and Sutton,<br />
1995).<br />
P. striiformis f. sp. dactylidis (Manners, 1960). Stripe rust infecting cocksfoot (Dactylis<br />
glomerata) was originally described as morphologically distinctive in urediospore size and<br />
therefore ascribed the status of variety within P. striiformis (Manners, 1960). However, the<br />
consensus of opinion leads to the conclusion that this pathogen is best regarded as a distinct<br />
forma spedalis (Tollenaar, 1967; Latch, 1976). <strong>The</strong> host: pathogen association is very close,<br />
so that pathogen isolates collected from cocksfoot cannot infect cultivated cereals and<br />
grasses, or vice versa. <strong>The</strong> optimum temperature for urediospore germination was noted to be<br />
21-24 o C (Manners, 1960), in contrast to 6°C for Pst (Tollenaar, 1967).<br />
P. striiformis f. sp. poae (Tollenar, 1967) was described as the pathogen causing stripe rust<br />
of Kentucky bluegrass (Poapratensis). Temperature optima for urediospore germination (12<br />
18°C) and the close association between pathogen isolates and the host suggest that this is a<br />
136
Assessment ofpathogenic variability in stripe rust - Wellings et al.<br />
distinctive forma specialis, although the geographic distribution outside the USA remains<br />
unclear.<br />
A potentially new form of P. striiformis was described in Australia by WeI lings et al. (2000).<br />
<strong>The</strong> pathogen was closely associated with weedy Hordeum species, showed broad avirulence<br />
on the wheat differential testers and appeared to contrast at one isozyme locus with Pst. <strong>The</strong><br />
pathogen, temporarily referred to as barley grass stripe rust (BGYR), was observed to cause<br />
disease on certain barley cultivars naturally infected in the field.<br />
2. Pathotype variation within P. striijormis f. sp. tritici<br />
Pathotype variability has traditionally been studied using defined sets of host genotypes<br />
inoculated with pathogen isolates in controlled environments. Such studies have almost<br />
entirely focussed on greenhouse testing of seedling plants and, when most effective, have<br />
attempted to relate the results to resistance genes deployed in commercial agriculture. <strong>The</strong><br />
various sets of differential genotypes employed in the study of Pst were reviewed by<br />
McIntosh et al., (1995). <strong>The</strong> set of Johnson et al. (1972), as modified by Wellings and<br />
McIntosh (1990), have been used for continuing studies of pathotype variability in the cereal<br />
rust laboratory at PBI Cobbitty since the first introduction of Pst to Australia in 1979. During<br />
this period, pathotype evolution arising from progressive single step mutation has resulted in<br />
the detection of over twenty variants. <strong>The</strong> results are summarized in Figures 1 and 2. While<br />
the majority of new pathotypes have represented a progressive increase in virulence, several<br />
reversions to avirulence have also been detected. With the exception of pathotype 64 El A-,<br />
all new pathotypes have only varied by one gene for virulence compared to a previously<br />
detected pathotype. On the basis of these observations, it can be concluded that there has<br />
been no evidence of further exotic introduction ofPst into Australia.<br />
Similar studies of Pst have been conducted by various groups around the world. <strong>The</strong> most<br />
notable contribution was that of the late R.W. Stubbs at the Research Institute for Plant<br />
Protection (IPO), Wageningen, <strong>The</strong> Netherlands. Although Stubbs work was focussed on<br />
Europe, he was able to accept Pst isolates from around the world under an agreement with<br />
CIMMYT, and so was able to gain some insight into global variability. Investigations of<br />
recent stripe rust epidemics in Central Asia discovered that <strong>The</strong> Institute of Genetics,<br />
Tashkent, Uzbekistan, has conducted similar Pst surveys for the former Soviet Union over<br />
many years, although the data has remained essentially unavailable to the Western scientific<br />
community.<br />
As a result of the recurring epidemics noted in the above regions, and in the absence of a<br />
consistent monitoring program for pathotype change in Pst over large areas of the world's<br />
wheat growing areas, an alternative method employing near isogenic lines in trap nurseries is<br />
being evaluated. This has become a joint project between CIMMYT, ICARDA and PBI<br />
Cobbitty, with some funding provided by the Australian Center for International Agricultural<br />
Research. <strong>The</strong> method provides advantages in being less reliant on specialist facilities and<br />
expertise, and can potentially sample pathogen populations over the period that the nursery<br />
remains viable in the field.<br />
<strong>The</strong> nurseries distributed as four cohorts have resulted in the collection of 58 data sets.<br />
Several of these collections represent multiple observations across several years at a single<br />
site. Low disease responses on the recurrent parent Avocet S has indicated poor and uneven<br />
infection or the presence of highly avirulent pathotypes at several sites. In these situations<br />
137
Assessment o/pathogenic variability in stripe rust - Wellings et at.<br />
where Avocet S showed responses of less than 40S, the data sets were regarded as difficult to<br />
interpret and hence were not considered in the analysis. <strong>The</strong> following represents a summary<br />
of current results.<br />
I.General Trends: <strong>The</strong> data indicate that pathogen populations show dynamic change in<br />
several dimensions. Firstly, variability at a single site is illustrated in Table 1 where virulence<br />
for YrA was present in 1996 at Tel Hadya, Syria, but absent in subsequent years. It is possible<br />
that YrA could be selected in breeding populations at this site, despite the widespread<br />
ineffectiveness of this gene in most regions.<br />
Secondly, the data provide evidence that the pathogen population may vary within countries.<br />
<strong>The</strong> data in Table 2 indicate that variation for virulence for YrA occurs at sites within New<br />
Zealand and Turkey. <strong>The</strong> progressive accumulation of such data will be helpful in predicting<br />
cultivar response at certain locations within countries.<br />
Thirdly, there was evident pathogen variability across regions. <strong>The</strong> data in Table 3 indicates<br />
that variation for Yr1 enabled some distinction between the pathogen population in eastern<br />
Europe (i.e., west of the Caspian Sea) and Central Asia, and between countries in South<br />
America and the Indian subcontinent. Although these data sets are limited, the early evidence<br />
suggests that distinctions in pathogen populations may give understanding in the large scale<br />
movements of new virulence combinations, and hence allow some early prediction of<br />
potential problems with cultivars carrying known resistance genes.<br />
2. Comments on Specific Resistance Genes: It is evident that several genes were broadly<br />
ineffective in providing cultivar resistance. <strong>The</strong> Yr9 gene has been widely deployed and the<br />
responses of a large group of Yr9-cultivars related to Seri 82 have received considerable<br />
publicity in many regions where the pathogen population acquired virulence. However, the<br />
NIL data indicate that Yr9 remained effective at sites in India, China, South Africa and<br />
Australia. Similarly, the resistance genes Yr6, Yr7 and YrA were broadly ineffective although<br />
they appeared to provide protection at some sites. .<br />
Virulence for Yr8 has generally been associated with the Middle East region, although the<br />
only clear data to confirm this was obtained from Adana (Turkey), Almaty (Kazakhstan) and<br />
Bajaura (India). This resistance gene has not been deployed in cultivars and hence any<br />
variation must be due to factors other than selection. Virulence for Yr17 appeared to be rare,<br />
although Carillanca (Chile), Grey town (South Africa), Sichuan (China) and possibly Almaty<br />
(Kazakhstan) showed distinctly high responses on the Yr17 NIL. <strong>The</strong> response of the adult<br />
plant resistance gene Yr11 was variable, ranging from R to 70 MS. However, it could not be<br />
concluded that virulence for Yr11 was evident at these sites.<br />
<strong>The</strong> resistance genes Yr5, YrJ0, YrJ5 and YrJ8 were concluded to be effective at all sites. <strong>The</strong><br />
response of Yr18 was variable, ranging from R in the Yr18 NIL to 80MS in the Jupateco R<br />
line depending on site and year.<br />
CONCLUSIONS<br />
Sources of resistance to stripe rust are not difficult to find and exploit in. breeding programs<br />
which aim to select and release resistant cultivars. <strong>The</strong> issues of disease control through<br />
breeding will pre-eminently focus on resistance durability which, in the case of the cereal<br />
138
Assessment o/pathogenic variability in stripe rust - Wellings et at.<br />
rusts in general, will be a function of genetic variation in characters determining<br />
pathogenicity.<br />
<strong>The</strong> development and deployment of trap nurseries utilizing isogenic lines for the assessment<br />
of pathogenic variation in P. striiformis offers several advantages. Field nurseries are<br />
relatively convenient to establish and monitor provided the materials are well adapted<br />
agronomically, and that the size of the nursery maintains a balance between numbers of<br />
entries and efficiency in monitoring resistances of economic importance. If these parameters<br />
are kept in view, the NIL nursery will provide a cost-effective means of pathogenicity<br />
assessment by removing reliance on sample collection, multiplication and processing through<br />
expensive environmentally controlled greenhouses. S,uch facilities are usually not available in<br />
developing countries.<br />
However problem areas will need to be addressed in order to overcome certain inefficiencies:<br />
1. Gene combinations in the NILs will allow the identification of certain virulence<br />
combinations in pathogen populations which cannot be detected with the current stocks.<br />
<strong>The</strong>se combinations will also ass1st in the detection of pathotype mixtures which would<br />
be expected to occur on occasion in naturally infected nurseries. Further genes will need<br />
to be transferred to Avocet S in Dfder to allow a complete array of testers for international<br />
monitoring. Initiatives have been taken to address these issues.<br />
2. Data collection and dispatch is currently sporadic and greater attention is required to have<br />
co-operators return data promptly in order to maintain a contemporary brief on pathogen<br />
change.<br />
3. <strong>The</strong> Yr12 and Yr17 NILs have been shown to be identical, with the former concluded to<br />
be incorrect based on paired seedling tests with Yr17 avirulent/virulent cultures. While<br />
this error has served as a check in nursery data, it also provides. a reminder in regard to<br />
the difficulties of identifying error in NIL development.<br />
4. <strong>The</strong> morphological similarity of NILs will mean that authentication of line integrity will<br />
be limited by the pathogen cultures available to the developer. Linked markers, such as<br />
brown chaff and Yr10, can be useful in certain circumstances.<br />
Despite several shortcomings, the NIL set for monitoring P. striiformis has shown sufficient<br />
potential to warrant further development of the set, and the continued deployment of<br />
nurseries at a range of international locations. <strong>The</strong> direction of the project must continue to be<br />
founded on direct links to breeding programs aiming to deliver stripe rust resistant cultivars.<br />
If these links are not maintained, the project risks irrelevance. However, the concerted<br />
commitment of pathology and breeding groups will facilitate the development and<br />
monitoring of resistances in order to capture the long term benefits of disease control for<br />
farming communities.<br />
REFERENCES<br />
Allison, CC and K. IsenQeck. 1930. Biologische specialisierung von Puccinia glumarum tritid Eriksson and<br />
Henning. Phytopathologische Zeitschriji2: 87-98.<br />
Dubin, H.J. and R.W. Stubbs. 1986. Epidemic spread of barley stripe rust in South America. Plant Disease 70:<br />
141-144.<br />
139
Assessment ofpathogenic variability in stripe rust - Wellings et al.<br />
Erikkson,l. 1894. Ueber die specialisierung des parasitismus bei den getreiderostpilzen. Berlin Devt. Botantical<br />
Ges. 12: 44-46.<br />
Johnson, R., Stubbs, R.W., Fuchs, E. and N.H. Chamberlain. 1972. Nomenclature for physiologic races of<br />
Puccinia striiformis infecting wheat. Transactions ofthe British Mycological Society 58: 475-480.<br />
Latch, G.C.M. 1976. Stripe rust, Puccinia striiformis f. sp. dactylidis on Dactylis glomerata in New Zealand.<br />
New Zealand Journal ofAgricultural Research 19: 535-536.<br />
Manners, J.G. 1960. Puccinia striiformis Westend. var dactylidis var. nov. Transactions ofthe British<br />
Mycological Society 43: 65-68.<br />
Marshall, D. and RL. Sutton. 1995. Epidemiology of stripe rust, virulence ofPuccinia striiformis f. sp. hordei,<br />
and yield loss in barley. Plant Disease 79: 732-737.<br />
McIntosh, R.A., Wellings, C.R and R.F. Park. 1995. "<strong>Wheat</strong> Rusts; an Atlas of Resistance Genes", CSIRO<br />
Press, 200 pp.<br />
Pretorius, Z.A., Boshoff, W.H.P. and G.H.J. Kema. 1997. First report ofPuccinia striiformis f.sp. tritici on<br />
wheat in South Africa. Plant Disease 81: 424.<br />
Tollenaar, H. 1967. A comparison ofPuccinia striiformis f. sp. poae on bluegrass with P. striiformis f. sp. tritici<br />
and f. sp. dactylidis. Phytopathology 57: 418-420. .<br />
WeIlings, C.R and R.A. McIntosh. 1990. Puccinia striiformis f. sp. tritici in Australasia - pathogenic changes<br />
during the first ten years. Plant Pathology 39: 316-325.<br />
Wellings, C.R., McIntosh, R.A. and 1. Walker. 1987. Puccinia striiformis f. sp. tritici in eastern Australiapossible<br />
means of entry and implications for plant quarantine. Plant Pathology 36: 239-241 .<br />
Wellings, C.R, Burdon, J.J., McIntosh, R.A., Wallwork, H., Raman, H. and G.M. Murray. 2000. A new variant<br />
of Puccinia striiformis causing stripe rust on barley and wild Hordeum species in Australia. New<br />
Disease Report, British Society for Plant Pathology.<br />
Questions and Answers:<br />
Cobus Ie Roux: Are you able to distinguish between different biotypes by using the isogenic<br />
Avocet lines in the trap nurseries?<br />
Answer: <strong>The</strong> trap nurseries with Avocet NILs are designed to evaluate the effectiveness of<br />
single genes. It can be expected that nurseries will be infected with one or more pathotypes.<br />
As gene combinations in NILs become available, it will be feasible to distinguish pathotype<br />
mixtures in nurseries. It is also anticipated that the NIL set will form the basis for a revision<br />
of pathotype nomenclature in Pucdnia striiformis fsp. tritid.<br />
M.A. Mahir: What is the possibility of hybridization and recombination between pathotypes<br />
being responsible for the continuous development of new pathotypes and biotypes of YR<br />
beside genetic mutation?<br />
Answer: Somatic recombination between cereal rust pathotypes has been clearly documented<br />
in Australia for wheat stem rust (P. graminis trifid) and rye stem rust (P. graminis secalis)<br />
giving rise to hybrid stem rust pathotypes. <strong>The</strong> literature also suggests somatic recombinants<br />
for P. striiformis. However, the evidence for P. striiformis in Australia does not support<br />
somatic recombination at the present time.<br />
Temam Russien: How often do you find new pathotypes of yellow rust in Australia? In<br />
other words, what is the rate of mutation of Y r of wheat?<br />
Answer: It is difficult to predict a precise mutation rate, since this will be a function of<br />
population size and selection pressure. Nevertheless, it appears on average that we can expect<br />
a new pathotype each year, although most of these pathotypes have not been signi ficant for<br />
our commercial wheats.<br />
140
Assessment o/pathogenic variability in stripe rust - Wellings et al.<br />
Temam Hussien: You mentioned "step-wise mutation" as one of the causes ofvariability in<br />
yellow rust of wheat. What do you mean by step-wise mutation?<br />
Answer: <strong>The</strong> detection of a new pathotype has always been linked to a pre-existing<br />
pathotype, with the only difference being a single gene for virulence. <strong>The</strong> simplest<br />
explanation is that genes for virulence are mutating one at a time and give rise to a new, but<br />
closely related, pathotype. Historically, this has occurred for one gene at a time, usually for<br />
increased virulence and occasionally for loss of virulence, and hence the term "step-wise".<br />
Figure 1.<br />
Progressive emergence of new pathotypes of P. striiformis f. sp. tritici in<br />
relation to previously detected pathotypes for the period 1979 to 1988 in<br />
Australia.<br />
Year<br />
1979<br />
104 E137 A<br />
1981<br />
Yr6<br />
104 E137 A+<br />
1983<br />
YrS<br />
1984<br />
1985<br />
104 E153 A<br />
-Yr2<br />
Yr7<br />
1986<br />
1988<br />
104 E9 A<br />
104E9A+<br />
141
Assessment a/pathogenic variability in stripe rust - Wellings et al.<br />
Figure 2.<br />
Progressive emergence of new pathotypes of P. striiformis f. sp. tritid in<br />
relation to previously detected pathotypes for the period 1992 to 1999 in<br />
Australia.<br />
Year<br />
1992<br />
104 E137 A· 104 E137 A+ 110 E143 A+ 104 E9 A· 360 E137 A+ 104 E153 A<br />
1993<br />
Yr9<br />
1994<br />
234 E137 A+<br />
Yr9<br />
YrCV<br />
1995<br />
238 E143 A+ 104 E41 A·<br />
1997<br />
1999<br />
237 E137 A·<br />
104 E137 A·, Yr17+<br />
?<br />
1<br />
Yr8 ·YrVii<br />
64 E1 A- 360 E205 A+ 96 E153 A·<br />
142
Assessment a/pathogenic variability in stripe rust - Wellings et al.<br />
Table 1.<br />
Variation in stripe rust response at the ICARDA breeding plots, Tel<br />
Hadya Syria, for NILs contrasting for YrA in the period 1997 to 1999.<br />
Year'of Assessment ,Avocet R (YrA) AvocetS <br />
1996 90S 95S <br />
1997 5R 95S <br />
1998 5R 95S <br />
1999 5R 100S <br />
Table 2.<br />
Disease response variation for NILs contrasting for YrA and grown at<br />
different sites in New Zealand and Turkey in 1998.<br />
Location<br />
.<br />
AvocetR(YrA) Avocet S<br />
New Zealand:<br />
Lincoln 80S 60S<br />
Aorangi R 100S<br />
Gore 80S 80S<br />
Turkey:<br />
Gissar R 80S<br />
Adana . 100S 100S<br />
Izmir 100S 100S<br />
Ankara 90S 90S<br />
Table 3.<br />
Stripe rust disease responses of NILs contrasting for Yrl in several <br />
regional locations. <br />
Location Yrl NIL, . Avocet S '<br />
<strong>Eastern</strong> Europe:<br />
Ankara, Turkey R 90S<br />
Apsheron, Azerbaijan R 100S<br />
Central Asia:<br />
Almaty, Kazakhstan 40 80<br />
Sichuan, China 40S 80S<br />
South America:<br />
Santa Catalina, Ecuador R 90S<br />
Quilamapu, Chile 50S 90S<br />
Indian Subcontinent:<br />
Ludhiana, India 60S 80S<br />
Kavre, Nepal R 80MS-S<br />
Islamabad, Pakistan R 40S<br />
143
SOURCES AND GENETIC BASIS OF VARIABILITY OF MAJOR AND MINOR <br />
GENES FOR YELLOW RUST RESISTANCE IN CIMMYT WHEATS <br />
Ravi P. Singh I and Julio Huerta-Espin0 2 <br />
ICIMMYT, Apdo. Postal 6-641, 06600, Mexico, D.F., Mexico <br />
2Campo Experimental Valle de Mexico-INIFAP, Apdo. Postal 10,56230, <br />
Chapingo, Edo. de Mexico, Mexico <br />
ABSTRACT <br />
Twenty-seven race-specific genes that confer resistance to yellow rust<br />
(Puccinia striiformis) have been catalogued so far. Of these genes, Yr1, Yr3,<br />
Yr15, Yr17 and Yr27 have conferred high levels of resistance to some<br />
CIMMYT wheats either singly or in combination with Yr9 to current pathogen<br />
populations globally. We have detected the presence of additional, possibly<br />
new, genes in recent CIMMYT wheat lines. <strong>The</strong>se major genes can be traced<br />
to the following sources: 'Bobwhite', 'Weaver', Chinese and synthetic wheats.<br />
<strong>The</strong> resistance gene from Bobwhite confers a seedling infection type ranging<br />
between 3 and 5 (on a 0-9 scale) and is present in several advanced lines<br />
through the Bobwhite derived line 'Pastor'. Weaver's seedling resistance is<br />
associated with a gene that displays seedling infection types ranging from 4 to<br />
6; whereas seedling reactions of the Chinese and synthetic wheats derived<br />
advanced lines indicate that they may have contributed at least 4 new genes. A<br />
high degree of genetic diversity for additive, minor genes also exists in<br />
CIMMYT germplasm. Genetic analyses of wheat lines showing high levels of<br />
adult-plant resistance in evaluations conducted recently in Mexico, Ecuador,<br />
Kenya, Uganda and Iran indicate the presence of at least 4 to 5 additive, minor<br />
genes in each line. Utilization of resistance based on minor genes should lead<br />
to resistance durability.<br />
INTRODUCTION<br />
Yellow (or stripe) rust, caused by Puccinia striiformis trifici, is an important disease of wheat<br />
in most wheat growing regions including Africa. Using resistant cultivar for disease control is<br />
the best strategy as it has no cost to the farmer and is environmentally safe. Historically, racespecific<br />
major genes have been used to breed resistant cultivar. At present, 30 genes are<br />
catalogued (McIntosh et al., 1998). A majority of these are race-specific in nature and<br />
virulence has been identified for several of them at least somewhere in the world. Some<br />
important cultivars where resistance is based on a single race-specific gene, or combinations<br />
of two of them, are currently grown on a large area in countries where yellow rust has posed<br />
major losses or threats in the past years. Resistances of Inquilab 92 based on Yr27 and<br />
PBW343 based on the combination of Yr3 and Yr9 are highly vulnerable as they are the most<br />
important cultivars in northwestern Pakistan and India, respectively, and virulences for these<br />
genes and their combinations are known. <strong>The</strong>se cultivars show unacceptable levels of adult<br />
plant resistance in Mexico when tested with a race virulent on the above genes. Similarly, a<br />
number of Kauz derived varieties, e.g. Bakhtawar 94 (Pakistan), WH542 (India), Memof<br />
(Syria), Basribey 95 and Seyhan 95 (Turkey) and Atrak (Iran), were released following the<br />
144
Sources ofvariability ofgenes for yellow rust resistance - Singh and Huerta-Espino<br />
widespread epidemic in these countries on Veery#5 derived cultivars. Immunity of Kauz in<br />
these countries is due to the presence of the combination of Yr9 and Yr27. Combination of<br />
virulences for these two genes in the yellow rust population do not exist at present in the<br />
above countries, however, is known to occur in Mexico. Slow rusting gene Yr18, also present<br />
in Kauz, does not confer enough protection under high disease pressure (Ma and Singh 1996)<br />
and hence Kauz shows unacceptable disease levels when tested in Mexico. This kind of<br />
information on the genetic basis of resistance could be extremely useful for a country to<br />
prepare for a forthcoming epidemic and take all measures to diversify the crop by promoting<br />
additional genetically diverse cultivars. One of the main objectives of CIMMYT's wheat<br />
genetics and breeding programs is to generate diverse gennp}asm. We thrive to achieve<br />
resistance durability by combing genes that have small to intennediate but additive effects.<br />
<strong>The</strong> magnitude of genetic diversity that exists in the CIMMYT germplasm with respect to<br />
genes conferring race-specific and durable resistance is reported in this paper.<br />
MATERIALS AND METHODS<br />
<strong>Wheat</strong> lines reported for genetic diversity of race-specific genes (Table 1) were identified<br />
after testing over 2000 new lines- that are currently being distributed through various<br />
screening nurseries from CIMMYT. <strong>The</strong>se lines were evaluated in the seedling growth stage<br />
with Mexican P. striiformis trifici pathotype Mex 96.11 that has following avirulencel<br />
virulence formula: Yr1, 4, 5, 8, 15, 17/ 2,3, 6, 7, 9, 10,27 based on the near-isogenic Avocet<br />
lines. Some reported genes could be identified by further testing of these lines with additional<br />
races and through the use of pedigree analysis. <strong>The</strong> lines were also evaluated in the field at<br />
CIMMYT's research station near Toluca, Mexico State during different years. <strong>The</strong> 0-9<br />
infection type scale used for seedling evaluation is described in Roelfs et al. (1992). Modified<br />
Cobb Scale (Peterson et al., 1948) was used for field evaluation of disease severity and<br />
response to infection was characterized as R, MR, MS and S (Roelfs et al., 1992).<br />
<strong>The</strong> eleven lines (Table 2) included for genetic analysis have shown high levels of adult plant<br />
resistance in field trials at Mexico, Ecuador, Kenya and Iran. <strong>The</strong>se lines show seedling<br />
susceptibility in Mexico and Iran and therefore the field resistance observed at least in<br />
Mexico and Iran must be based on genes that are effective in adult plant stage. <strong>The</strong> resistant<br />
lines were crossed with the yellow rust susceptible parent Avocet S. A total of 298 eight F3<br />
lines were obtained for each of the cross by harvesting individual F2 plants from five F2<br />
populations derived from individually harvested F 1 plants. About 80 seeds of the F3 lines and<br />
parents were grown in the field at Toluca during crop season 2000 in two I-m paired row (0.2<br />
m apart) plots on the top of 0.75 m wide raised beds with 0.5 m pathway. Hills of the highly<br />
susceptible spreader cultivar Morocco were sown in the middle of the 0.5 m pathway on one<br />
side of each plot. Yellow rust epidemic was initiated by inoculating the 4 weeks old spreader<br />
rows with a suspension of urediniospores in the light weight mineral oil Soltrol 170. <strong>The</strong><br />
parents and the F3 lines were classified for yellow rust for the first time when the flag leaves<br />
of the susceptible parent Avocet displayed between 80-100% rust severity. Classification was<br />
made two ways: 1) by visually estimating the mean yellow rust severity of the plot, and 2) by<br />
classifying each of the line in one of the four segregation categories as given in Table 3 and<br />
described in detail by Singh and Rajaram (1992). Some F3 lines that had disease ratings<br />
similar or close to the respective resistant parents were evaluated for a second time about 2<br />
weeks after the first evaluation. By this time disease had further increased on those lines that<br />
were different from the resistant parent could be separated from the lines that were truly<br />
homozygous for the severity response similar to that of their resistant parent. <strong>The</strong> X 2 analysis<br />
145
Sources ofvariability ofgenes for yellow rust resistance - Singh and Huerta-Espino<br />
was carried out to test whether the observed distribution of F 3 lines was in agreement with the<br />
expected ratio.<br />
RESULTS AND DISCUSSION<br />
Possible diversity for race-specific genes present in CIMMYT wheats that are being<br />
distributed in the recent years is shown in Table 1. Known genes, such as YrJ, Yr15 and Yr J7<br />
could be identified in some wheat lines. Noteworthy is line Milan that carries gene Yr17. This<br />
gene is not yet deployed in Africa and is effective to the current population of P. striifarmis.<br />
However, this gene was used extensively in Europe, Australia and New Zealand resulting in<br />
the identification of virulent races in the past years in each of the above countries. We can<br />
indicate the presence of at least five additional unknown genes in the gennplasm that<br />
probably have wheat origin. A gene conferring seedling infection type 34 and high level of<br />
adult plant resistance is present in wheat lines Pastor, Tinamu, Ducula, etc. and may be<br />
derived from some selections of Bobwhite. This gene is effective in Africa and all other sites<br />
reporting data on these lines. Its proportion in new CIMMYT lines is increasing due to the<br />
use of Pastor in many crosses. Pastor has high yield potential, wide adaptation, excellent<br />
industrial quality and resistance to . Septaria tritid making it an attractive parent in the<br />
crosses.<br />
<strong>The</strong> use of Chinese wheat germplasm to incorporate resistance to head scab has also<br />
introduced at least two major yellow rust genes in CIMMYT germplasm. Examples of these<br />
CIMMYT lines are some selections of Catbird and SW89.2089/Kauz that have low and<br />
moderate seedling resistance but high levels of adult plant resistance (Table 1). CIMMYT<br />
lines Weaver and Star appear to carry genes that confer intermediate seedling infection types<br />
but moderate and moderately high field reactions, respectively.<br />
Some new genes are also entering in the germplasm from synthetics (Table 1). We recently<br />
identified and designated gene Yr28 (Singh et al., 2000) of T tauschii origin. At least two, or<br />
more, additional genes are also present in synthetic derived lines. In' all it can be stated that<br />
CIMMYT germplasm contains high degree of genetic diversity for race-specific genes that<br />
are currently effective in most developing countries. <strong>The</strong>se genes will probably protect some<br />
important varieties in the future but eventually succumb to new virulences that will arise in<br />
time.<br />
<strong>The</strong> eleven lines listed in Table 2 display susceptible infection types when tested in Mexico<br />
and Iran (data not presented). <strong>The</strong>se lines were purposefully bred to accumulate minor,<br />
additive genes for resistance to leaf and yellow rusts and evaluated at selected hot-spot<br />
locations under the nursery PCYR/LR (Singh et al., 1999). Lines included for the genetic<br />
analysis and listed in Table 2 have shown near-immunity to yellow rust in field trials in<br />
Mexico for the last 4 years. In each cross, the distribution of the F3 lines for disease severity<br />
was continuous between the parental severities. Distributions for two crosses are shown in<br />
Figures 1 and 2. Only rare F3 lines showed disease severities similar to the resistant or<br />
susceptible parents. <strong>The</strong> observed continuous distribution indicated that the resistance was<br />
complex and was not based on major genes.<br />
<strong>The</strong> expected proportions of the F3 lines in four segregation categories, assuming that the<br />
resistance is based on 2, 3, 4 and 5 minor additive genes, is given in Table 3. <strong>The</strong> observed<br />
distributions of F 3 lines in 9 of the crosses conformed the ratio expected for segregation of at<br />
146
Sources ofvariability ofgenes for yellow rust resistance - Singh a,!d Huerta-Espino<br />
least of 4 additive genes (Table 4). Resistance of Chapio and Tukuru was based on the<br />
additive interaction of at least 5 minor genes.<br />
All resistant parents included in the genetic analysis are likely to carry the durable slow<br />
rusting gene Yr18 (Singh, 1992; McIntosh, 1992) as they show the linked leaf tip necrosis of<br />
adult plants. At least the lines derived from the crosses involving Pavon 76 are also likely to<br />
carry minor genes Yr29 and YrJO. <strong>The</strong>se genes are known to be present in Pavon 76 and are<br />
very closely linked! pleiotropic to the genes Lr46 and Sr2 that confer durable slow rusting<br />
resistance to leaf and stem rusts, respectively. Based on the results from genetic analysis it<br />
appears that resistance to yellow rust, approaching near-immunity, can be developed by<br />
combining slow rusting genes that have minor/ intermediate but additive effects. <strong>The</strong> wheat<br />
lines listed in Table 4 or 5 should be used in the future crossing program if aim is to achieve<br />
high level of minor genes based resistance. Resistance of cultivars carrying such genes should<br />
prove to be durable.<br />
REFERENCES<br />
Ma, H. and R.P. Singh. 1996. Expression ofadult resistance to stripe rust at different growth stages of wheat.<br />
Plant Dis. 80: 375-379.<br />
McIntosh, RA. 1992. Close genetic linkage ofgenes conferring adult-plant resistance to leaf rust and stripe rust<br />
in wheat. Plant Pathol. 41: 523-52i<br />
McIntosh, R.A., Hart, G.E., Devos, K.M., Gale, M.D. and W.J. Rogers. 1998. Catalogue of gene symbols for<br />
wheat. Slinkard, A.E. (ed.) Proc. 9 th Int. <strong>Wheat</strong> Genetics Symp., 2-7 Aug. 1998, Saskatoon, Canada.<br />
Vol 5: 1-235.<br />
Peterson, R.F., Campbell, A.B. and A.E. Hannah. 1948. A diagrammatic scale for estimating rust intensity of<br />
leaves and stem of cereals. Can. J. Res. Sect.' C. 26: 496-500.<br />
Roelfs, A.P., Singh, RP. and E.E. Saari. 1992. Rust tiiseases of wheat: Concepts and methods of disease<br />
management. CIMMYT, Mexico, D.F. 8lpp.<br />
Singh, RP. 1992. Genetic association ofleaf rust resistance gene Lr34 with adult plant resistance to stripe rust<br />
in bread wheat. Phytopathology, 82 : 835-838.<br />
Singh, RP., Nelson, J.C. and M.E. Sorrells. 2000. Mapping Yr28 and other genes (or resistance to stripe rust in<br />
wheat. Crop Sci. 40: 1148-1155.<br />
Singh, RP, and S. Rajaram. 1992. Genetics of adult-plant resistance to leaf rust in ' Frontana' and three<br />
CIMMYT wheats. Genome, 35: 24-31.<br />
Singh, R.P., Rajaram, S. and J. Huerta-Espino. 1999. Combining additive genes for slow rusting type of<br />
resistance to leaf and stripe rusts in wheat. pp, 394-403. In: Proc. <strong>The</strong> 10 th <strong>Regional</strong> <strong>Wheat</strong> <strong>Workshop</strong><br />
for <strong>Eastern</strong>, Central and Southern Africa. Addis Ababa, Ethiopia: CIMMYT.<br />
Questions and Answers:<br />
Colin R. WeIlings: <strong>The</strong> F3 distribution ofR x S crosses were presented as a distribution.<br />
Were these means for LAI within lines, as one would expect segregation to susceptible in a<br />
proportion ofthe material?<br />
Answer: <strong>For</strong> the estimation of gene number, we use the four categories (HPTR, HPTS, SegI<br />
and SegS). Severity mean of the lines is a useful tool to show the pattern ofthe distribution of<br />
the lines.<br />
HarjU Singh: Since there are a number ofexamples where slow rusting resistance has been<br />
found to be race specific, will it be appropriate to label "slow-rusting" as "race non-specific"<br />
as you have done in your presentation?<br />
147
Sources ofvariability ofgenes for yellow rust resistance - Singh and Huerta-Espino<br />
Answer: In the broad sense, yes! Exceptions can always be found in nature.<br />
Colin Wellings: Given that estimations of additive gene number involve relatively small<br />
frequencies of homozygous parental types, do you see any advantage in DB versus RIL<br />
populations?<br />
Answer: No, because at CIMMYT we can obtain RlLs (Recombinant Inbred Lines, F5 or F6)<br />
in the same time as one can obtain enough seeds ofDH. Ratios are changed only slightly<br />
from F6 to DB.<br />
Colin WeHings (Comment following Ravi Singh's comment): <strong>The</strong> evidence suggests that<br />
virulence to Yr9 arose in the late 1980s in Ethiopia, and subsequently transferred to the high<br />
elevation mountain plateau of Yemen. From there the new rust pathotype survived, and<br />
spread to the Nile Valley, Middle East and beyond. <strong>The</strong>se observations would support Dr.<br />
Singh's concern.<br />
F3 lines (No.)<br />
60<br />
50<br />
40<br />
30<br />
..<br />
20 o<br />
C.<br />
10<br />
.
Sources ofvariability ofgenes for yellow rust resistance - Singh alld Huerta-Espino<br />
F31ines (No.)<br />
70<br />
60<br />
50<br />
40<br />
30<br />
(/)<br />
20<br />
10<br />
o<br />
Qi<br />
-- t)<br />
o<br />
~<br />
+<br />
5 10 15 20 30 40 50 60 70 80 90 100<br />
Yellow rust severity (%)<br />
Fig. 2. Distribution of 298 F3 lines from the cross of<br />
susceptible parent Avocet 5 with resistant parent Kukuna<br />
Table 1.<br />
Usual seedling infection type (IT) and adult plant responses (APR)<br />
observed in Mexico on race-specific genes present in CIMMYT<br />
germplasm.<br />
Gene<br />
Yrl<br />
Yrl5<br />
Yrl7<br />
?C<br />
?<br />
?<br />
?<br />
?<br />
Yr28<br />
?<br />
?<br />
Response<br />
Seedling ITa <br />
01 <br />
1 <br />
23 <br />
34 <br />
23 <br />
45 <br />
45 <br />
56 <br />
45 <br />
12 <br />
13 <br />
APR b . <br />
0 <br />
0 <br />
5MR <br />
5R-MR <br />
0 <br />
5R-MR <br />
20MR <br />
60M <br />
30MR <br />
1MR <br />
1MR <br />
Line<br />
TJB368.2511Buc//Oci<br />
V763.2312/V879.C8.11.11.11(36)/Star/3/Star<br />
Milan<br />
Pastor, Bobwhite, Tinamu, Ducula<br />
Catbird<br />
SW89.20891Kauz<br />
Weaver<br />
Star<br />
Altar 84/Ae. tauschii//Opata<br />
Opata//Sora/Ae. tauschii (323)<br />
Croc lIAe. tauschii (205)1lKauz/3/Sasia<br />
a Seedling infection type follow a 0-9 scale as described in Roelfs et al. (1992).<br />
b <strong>The</strong> APR has two components, % rust severity based on the modified Cobb Scale<br />
(Peterson et al. 1948) and response to infection as described by Roelfs et al. (1992).<br />
C Unknown, probably new, genes for resistance.<br />
149
Sources ofvariability ofgenes for yellow rust resistance - Singh and Huerta-Espino<br />
Table 2.<br />
Yellow rust responses, as observed at hot-spot field sites in four countries,<br />
for resistant lines included in the genetic analysis .<br />
,.<br />
".':<br />
•' '.' '. Yellow rust r:t!sponse~<br />
Cross & selection history New name Ni:exlco • ····Ecuador Kenya Iran '.<br />
ToniIYacol/Kauz*3/Trap Chapio 0 1 1 SR<br />
CG84-099Y -099M-1 Y -SM-3Y-OB<br />
TrapNaco//Kauz*3ITrap Tukuru 1 1 1 0<br />
CG96-099Y -099M-17Y-6M-2Y-OB<br />
Sni/HD2281 liStar Mirtu 1 1 1 20R<br />
CG13-099Y-099M-9Y-IM-4Y-OB<br />
SniiTonii/Kauz*3/Trap Kuruku 1 S 1 20MR<br />
CG22-099Y -099M-50Y-2M-2Y-OB<br />
SnilPB W 651IKauz* 3/Trap Kukuna 1 1 1 20MR<br />
CG36-099Y -099M-69Y-1 M-4Y-OB<br />
HD2281/Pvn//Kauz*3/Trap Konkitu 1 5 5 10MR<br />
CG40-099Y-099M-21 Y -4M-5Y-OB<br />
Pvn/Yacol/Kauz*3/Trap Kakatsi 1 1 0 0<br />
CG68-099Y -099M-15Y-1 M-2Y-OB<br />
PvnIPBW65//Kauz*3/Trap Khuaki 1 1 5 10MR<br />
CG74-099Y-099M-41 Y-4M-4Y-OB<br />
Toni/Trap//Kauz*3/Trap Tsapki 1 1 5 20MR<br />
CG78-099Y -099M-22Y-4M-1 Y -OB<br />
ToniNacol IBav92 Chos 0 1 1 1R<br />
CG82-099Y-099M-5Y-4M-2Y-OB<br />
TrapNacol IBav92 Jarumba 0 1 1 lR<br />
CG94-099Y-099M-10Y-1M-4Y-OB .<br />
a Adult plant field response has two components: % severity based on the modIfied Cobb<br />
Scale (Peterson et al. 1948) and reaction to infection as described by Roelfs et al. (1992).<br />
Data recorded when susceptible checks show 100% severity.<br />
ISO
Sources ofvariability ofgenes for yellow rust resistance - Singh and Huerta-Espino<br />
Table 3. Expected frequency of lines in four phenotypic classes in the F 3<br />
generation in the susceptible X resistant cross when resistance is<br />
controlled by genes that have minor/ intermediate but additive effects<br />
on disease severity.<br />
"<br />
"<br />
,No. of ' "' Li,D,ei(%~ :; , " ..;<br />
genes , :Hrf:R? " ... HPJrS 2<br />
"<br />
' ,<br />
... ~' . 8~g13,<br />
SegS1<br />
2 6.3 6.3 37.5 50.0<br />
3 1.6 1.6 56.3 40.6<br />
4 0.4 0.4 68.0 31.3<br />
5 0.1 0.1 76.2 23.6<br />
I<br />
HPTR - Homozygous Parental Type ResIstant. <br />
2 HPTS = Homozygous Parental Type Susceptible. <br />
3 SegJ = Segregating, or intermediate, but no completely susceptible plant. <br />
4 SegS = Segregating with completely susceptible plants. <br />
Table 4.<br />
Distribution of F3 lines from the crosses of yellow rust susceptible parent<br />
Avocet S with the 10 resistant wheats when evaluated at Toluca, Mexico<br />
during 2000.<br />
Grossed with E 3 Imes(nQ.) , Estimated<br />
, , ' 2 '<br />
AyocetS HPTR J " H~TS1 < , , Seiii J , ... ' SegS 4 genes: (no.) , "I.: value<br />
Chapio 1 1 237 59 5 5.75 ns)<br />
Tukuru 0 0 227 71 5 0.57 ns<br />
Mirtu 1 0 204 93 4 1.20 ns<br />
Kuruku 1 2 179 116 4 6.36 ns<br />
Kukuna 0 2 192 104 4 3.58 ns<br />
Konkitu 0 0 186 112 4 7.51 ns<br />
Kakatsi 2 1 197 98 4 1.03 ns<br />
Khuaki 2 1 189 106 4 3.45 ns<br />
Tsapki 0 1 203 94 4 1.20 ns<br />
Chos 2 2 190 104 4 3.25 ns<br />
larumba 0 0 200 98 4 2.62 ns<br />
I<br />
HPTR - Homozygous Parental Type ResIstant. <br />
2 HPTS = Homozygous Parental Type Susceptible. <br />
3 SegJ = Segregating, or intermediate, but no completely susceptible plant. <br />
4 SegS = Segregating with completely susceptible plants. <br />
5 Non-significant values at P = 0.05. <br />
151
PERFORMANCE OF FOUR NEW LEAF RUST RESISTANLE GENES <br />
TRANSFERRED TO COMMON WHEAT <br />
FROM TRITICUM TAUSCHII AND T. MONOCOCCUM <br />
Temam Hussien<br />
Alemaya University, P.O. Box 138, Dire Dawa, Ethiopia<br />
ABSTRACT<br />
<strong>The</strong> diploid progenitors of hexaploid common wheat (Triticum aestivum L.<br />
AABBDD), tauschii (DD) and T. monococcum (AA), are valuable sources of<br />
genes for resistance to the leaf rust fungus (Puccinia recondita f.sp. tritici). In<br />
this study, four new leaf rust resistance genes previously transferred from<br />
these species to common wheat were considered. <strong>The</strong> gene Lr43, occurring in<br />
the wheat line KS92WGRC 1 0, was transferred from A. tauschii. One gene,<br />
occurring in the wheat line KS92WGRC23, was transferred from T.<br />
monococcum var. monococcum, Two other genes, occurring in the wheat lines<br />
KS93U3 and KS93UI80, were obtained from T. monococcum var. boeoticum.<br />
<strong>The</strong> genes in KS92WGRC23 and KS92WGRC16 were resistant in both<br />
Kansas and Texas field tests. <strong>The</strong> gene in KS93U3 was moderately resistant in<br />
Kansas but moderately resistant to moderately susceptible in Texas. <strong>The</strong> gene<br />
in KS93Ul80 was moderately resistapt in Kansas but moderately resistant to<br />
susceptible in Texas. Adult plant tests conducted in the greenhouse using<br />
isolate CBBQ indicated that KS92WGRC23, KS92WGRCI6, and KS93UI80<br />
were highly resistant but KS93U3 gave a moderately resistant reaction.<br />
Typical seedling infection types produced by these lines were zero (0), fleck<br />
(;), fleck associated with chlorosis (;C), and heterogeneous (X-). Results of<br />
growth chamber studies at different temperatures (12, 16, 20 and 24°C)<br />
showed slight temperature effects on the expressioR of KS93UI80, only. <strong>The</strong><br />
genes in the four lines should be used in combination with other resistance<br />
genes to prolong their usefulness.<br />
INTRODUCTION<br />
Genetic resistance is potentially the most cost effective and environmentally sound method of<br />
controlling leaf rust of wheat (Triticum aestivum L.). Unfortunately, development and<br />
management of durably resistant cultivars in the central Great Plains of the USA has not been<br />
entirely successful (1, 6). New resistant cultivars are frequently overcome by new or<br />
previously undetected races of the leaf rust fungus (Puccinia recondita Rob. ex. Desm. f. sp.<br />
trifici) after several years of large scale production. <strong>For</strong> example, the Hard Red Winter <strong>Wheat</strong><br />
cultivars Abilene, Karl, and Newton were classified as resistant when originally released, but<br />
eventually succumbed to prevalent races. Evolution of new pathogen races in the Great Plains<br />
is favored by many factors including: (1) Large populations of inoculum produced on highly<br />
susceptible, widely grown cultivars like Chisholm and TAM 107; (2) Frequent overwintering<br />
of the pathogen on juvenile winter wheat; (3) Oversummering on volunteer wheat; (4)<br />
Deployment of many cultivars along a north-south axis which corresponds to the migration<br />
152
Performance offour new leafrust resistance genes - Temam<br />
route of the rust; (5) Reliance on a relatively small pool of resistance genes in popular<br />
cultivars; and (6) Use of only one or a few effective resistance genes in each cultivar.<br />
Development of new sources of resistance genes could ameliorate the last two problems and<br />
possibly slow the evolution of new pathogen races.<br />
Wild relatives of cultivated wheat are a valuable source of new resistance genes for<br />
improving wheat cultivars (3, 4). <strong>The</strong> <strong>Wheat</strong> Genetics Resource Center (WGRC) at Kansas<br />
State University recently released wheat germplasm KS92WGRC16, which contains a leaf<br />
rust resistance gene (designated Lr43) from A. tauschii (Coss.) Schmal. This species is the D<br />
genome progenitor of common wheat and is widely distributed in countries around the<br />
Caspian Sea including Turkey, Iran, Pakistan, Afghanistan, Azerbaijan, Armenia, southern<br />
Russia (Dagestan), Georgia, and Turkmenistan (5). Kihara and coworkers collected a large<br />
number of accessions of this species in 1965. Since then, this species has been well-studied<br />
(5). Three other new leaf rust genes in the wheat lines KS92WGRC23, KS93U3, and<br />
KS93UI80 were transferred from cultivated einkorn wheat (T monococcum var.<br />
monococcum) and its wild progenitor (T monococcum var. boeoticum). T monococcum is the<br />
A-genome progenitor of common wheat. It is believed that einkorn wheat was first<br />
domesticated by Neolithic farmers from var. boeoticum. This diploi
Performance offour new leafrust resistance genes - Temam<br />
MATERIALS AND METHODS<br />
Field Studies<br />
Winter wheat accessions containing the new leaf rust resistance genes investigated in this<br />
study are listed in Table 1. Several wheat varieties and gennplasm releases, including<br />
Wrangler (PI477288), TAM 107 (PI495594), Karl 92 (PI564245), TAM 200 (PI578255),<br />
Wichita (CII952), Century (PI502912), KS91WGRCI2-1, KS86WGRC2 (PI504517),<br />
KS90WGRCIO (PI549278), KS91 WGRCII (PI566668), and S92WGRC 15 (PI566669), were<br />
included as controls. Field nurseries were established at the Ashland experimental field,<br />
Manhattan, Kansas during the growing seasons of 1992/93,1993/94, and 1994/95. <strong>The</strong> wheat<br />
accessions were planted in three-row plots with 20 cm between rows. Plots were 2.7 m long<br />
by 0.6-m wide with no border between plots. Experiments were arranged in a randomized<br />
complete block design with four replications.<br />
To enhance buildup of rust epidemics, test entries were inoculated unifonnly when they were<br />
between boot and early heading stages (45-53 on Zadoks' scale) of development with a<br />
mixture of urediniospores of different leaf rust fungal isolates collected from the Ashland<br />
field in previous years. Three cultures of Puccinia recondite Rob. ex Desm. fsp. tritici,<br />
CBBQ, CDBL, and MFBL were included in the rust population used to inoculate the test<br />
entries. <strong>The</strong> avirulence/virulence fonnulae of these rust isolates are:<br />
CBBQ = 1, 2a, 2c, 3ka, 9,11,16,17,24,26, 30/3a, 10, 18;<br />
CDBL = 1, 2a, 2c, 3ka, 9, 11, 16, 17, 18,26, 30/3a, 10,24; and<br />
MFBL = 2a, 2c, 3ka, 9, 11, 16, 17, 18,3011 ,.3a, 10,24,26.<br />
<strong>The</strong>se three isolates elicit a high infection type on the hexaploid parental lines involved in<br />
producing the resistant gennplasm. Urediniospores were suspended in light-weight mineral<br />
oil (Phillips Petroleum Company, Bartlesville, OK) and sprayed with a battery operated, fine<br />
nozzle sprayer between 6:00 and 7:00 p.m. after dew fonnation to maintain conditions<br />
necessary for spore gennination and infection.<br />
Disease severity (percentage of leaf area infected by rust in each line was assessed in Kansas<br />
twice a week between the early milk (73 on Zadoks' scale) (10) and hard dough stages (87 on<br />
Zadoks' scale) of development using the modified Cobb scale (9). <strong>The</strong> host response to<br />
infection was scored using "R" to indicate resistance or miniature uredinia; "MR" to show<br />
moderate resistance that is expressed as small uredinia; "MS" to indicate moderately<br />
susceptible, expressed as moderate-sized uredinia (smaller than the fully compatible type);<br />
and "s" to indicate full susceptibility (9).<br />
In Texas nurseries, single row entries of 3 m each were planted at the Texas Agricultural<br />
Experiment Stations at Prosper and Beeville in 1994/95. <strong>The</strong>se nurseries were exposed to<br />
natural infection. Rust severity estimations were made at watery ripe to milky developmental<br />
stages (71-77 on Zadoks' scale).<br />
Growth Chamber Studies<br />
Seedlings of the four accessions with new leaf rust resistance genes along with parental lines<br />
and susceptible checks were tested twice in 12, 16, 20, and 24°C environments. <strong>The</strong> leaf rust<br />
154
Performance offour new leafrust resistance genes - Temam<br />
cultures mentioned above were used. Seeds were planted in 6- to 7-cm-diameter plastic pots<br />
filled with vermiculite. Each pot represented an experimental unit, and treatments were<br />
replicated three times in a completely randomized design. Seedlings that were 10 to 12 days<br />
old were inoculated with urediniospores (9). Briefly, urediniospores of the cultures CBBQ,<br />
CDBL, and MFBL were brought out from storage in liquid nitrogen, then were heat shocked<br />
at 40°C for 5 minutes. Primary leaves of 5 4-72 seedlings of each line were inoculated just<br />
before emergence of the second leaf using a suspension of urediniospores in light-weight<br />
mineral oil. After inoculation, the plants were misted with tap water and placed in a<br />
refrigerated (I6°C) moist chamber (100% RH) overnight. After 16 hours of incubation, plants<br />
were allowed to dry slowly and then moved to 12, 16,20, and 24°C growth chambers. <strong>The</strong>se<br />
chambers were illuminated at about 200 flmole m -2 s -I for 12 hours each day with light from<br />
cool white fluorescent tubes suspended about 1 m above the plants. Infection types were<br />
evaluated when they appeared to be fully developed for each temperature and were classified<br />
using the Stakman scale of 0-4 (9).<br />
Greenhouse Studies<br />
<strong>For</strong> adult-plant evaluations in the greenhouse, five to six seeds were sown in 6- to 7-cm<br />
diameter plastic pots filled with vermiculite. <strong>The</strong> seedlings were then vernalized at 10°C for<br />
seven weeks. At the end of vernalization, two seedlings per pot were transplanted into 15-cmdiameter<br />
plastic pots filled with a 1: 1:3 peat moss:perlite:soil mixture. Seedlings were grown<br />
at 21± 3°C with a 12-hour photoperiod in the greenhouse. Each pot represented an<br />
experimental unit, and treatments were replicated three times in a completely randomized<br />
design.<br />
Plants were inoculated when they were at the flowering to watery ripe stages of development.<br />
After inoculation, plants were incubated in the dark in an enclosed plastic chamber with<br />
100% relative humidity for 15 hours. <strong>The</strong>y were then returned to a greenhouse with<br />
conditions similar to those described above. Disease severity was assessed on flag leaves of<br />
five randomly selected tillers 15 to 20 days after inoculation using the scales and scoring<br />
procedures described for seedling tests. This experiment was also repeated.<br />
RESULTS<br />
Adult Plant Reactions to Leaf Rust<br />
Field trial results are given in Table 2. <strong>The</strong> level of leaf rust infection in the field varied<br />
among years. Infection was relatively high in the Kansas field nursery in 1992/93 but low in<br />
1993/94 and 1994/95 seasons. <strong>The</strong> 1992/93 crop year was particularly favorable for overwintering<br />
of the leaf rust fungus in Kansas, resulting in more than average severity on<br />
susceptible varieties (1). Rust severity also was high in Texas in 1995. <strong>The</strong> genes in<br />
KS92WGRC23 and KS92WGRC16 conferred immunity to leaf rust in both Kansas and<br />
Texas. <strong>The</strong> gene in KS93U3 was moderately resistant in Kansas but moderately resistant to<br />
moderately susceptible in Texas. <strong>The</strong> gene in KS93UI80 was moderately resistant in Kansas<br />
but moderately resistant to susceptible in Texas. TAM 200 (the hexaploid parent of<br />
KS92WGRCI6), Karl 92 (the recurrent parent of KS92WGRC23), and Wrangler (the<br />
recurrent parent of KS93UI80 and KS93U3) all had high infection types under field<br />
conditions in the test areas.<br />
155
Performance offour new leafrust resistance genes - Temam<br />
Adult-plant tests conducted in the greenhouse using the isolate PBJL also showed levels of<br />
resistance similar to those observed under field conditions (Table 2). <strong>The</strong> wheat lines<br />
KS92WGRC16, KS92WGRC23, and KS93UI80 showed fleck (;), zero (0), and fleck<br />
associated with chlorosis (C), respectively. <strong>The</strong> wheat line KS93U3 was moderately resistant<br />
(20MR) producing a typical heterogeneous (X-) infection type.<br />
Effects of Temperature on Seedling Reactions<br />
<strong>The</strong> reactions of the four wheat lines (plus checks) to pathotypes CBBQ, CDBL, and MFBL<br />
in four environments are given in Table 3. KS92WGRC23 and KS92WGRC16 produced<br />
infection types zero (0) and fleck (;) at all temperatures with the three isolates. KS93UI80<br />
produced a fleck infection type associated with chlorosis (C) with all three isolates in the 12<br />
and 16°C environments. At 20 and 24°C, however, a slightly higher infection type (1 C) was<br />
obtained, indicating a slight temperature effect on this line. KS93U3 showed the typical<br />
heterogeneous (X-) infection type with all three isolates at 12, 16, 20, and 24°C. Wrangler<br />
and Karl are the recurrent parents of the wheat lines carrying the resistance genes. Wrangler<br />
showed high infection types (3 to 3+) in all environments with all isolates. However, Karl<br />
gave low infection types with CBBQ and high infection types with the other two isolates in<br />
all environments. TAM 200 gave a low infection type (0 to ;1) at all temperatures. Wichita<br />
and TAM 107, the susceptible checks, produced a high infection type at all temperatures with<br />
all the three isolates (Table 3).<br />
DISCUSSION<br />
New rust resistance genes in the lines KS93UI80 and KS93U3 from T monococcum var.<br />
boeoticum both provided good levels of resistance in Kansas and north Texas field tests.<br />
However, KS93UI80 and KS93U3 were moderately susceptible to susceptible in south Texas<br />
at Beeville in 1995. Texas is generally considered a "hot spot" for leaf rust (6). <strong>The</strong>refore, the<br />
difference in performance of resistant lines between locations is likely due to greater<br />
diversity of rust pathogen races in south Texas. P. recondita isolates from south Texas can<br />
have different virulence combinations than isolates found in other parts of Texas (6).<br />
Although the genes in these two lines both are derived from T monocvccum var. boeoticum<br />
and both appear to have the same race specificity, they are not identical. <strong>The</strong> low IT for the<br />
gene in KS93Ul80 is typically a fleck with extra chlorosis (C). In contrast, the low infection<br />
type for KS93U3 is typically heterogeneous (X-) with a mixture ofpustule types. <strong>The</strong> gene in<br />
KS93UI80 also showed slight temperature sensitivity whereas the gene in KS93U3 did not.<br />
<strong>The</strong>se two genes segregated independently of each other indicating that they are not allelic<br />
(T. S. Cox, unpublished).<br />
<strong>The</strong> resistance gene transferred from T monococcum var. monococcum to line<br />
KS92WGRC23 conferred very high resistance in all field tests. Greenhouse tests using<br />
standard races also showed very low infection types ranging from immune (0) to a few flecks<br />
(0) (Table 3).<br />
KS92WGRC16, containing Lr43 from A. tauschii, is the only line of the four that was<br />
resistant in all field and greenhouse tests. Temperature did not appear to affect the reaction,<br />
and the gene was equally effective in seedlings and adult plants. <strong>The</strong> IT of Lr43 was very<br />
low, ranging from fleck (;) to flecks with a few small pustules associated with chlorosis (1 C).<br />
156
Performance o.ffour new leafrust resistance genes - Temam<br />
Lr43 could be a very useful new gene for development of rust resistant wheat varieties. It is<br />
highly effective, stable up to now, and no pre-existing virulence has yet been detected. On the<br />
other hand, the resistance genes in lines KS92WGRC23, KS93Ul80 and KS93U3 may be<br />
useful in some areas.<br />
<strong>The</strong> utility of these genes would be greatly increased if they were used in combinations rather<br />
than singly. <strong>For</strong> example, a combination ofKS92WGRC23 plus either KS93UI80 or KS93U3<br />
should be resistant to many races whereas separately these lines are defeated by these races.<br />
Use of Lr43 would also be optimized by combination with other Lr genes. Even though<br />
preexisting virulence has not yet been detected for Lr43, the pathogen only needs to mutate at<br />
one locus to become virulent. <strong>The</strong> leaf rust fungus has repeatedly demonstrated this capacity.<br />
However, if Lr43 were combined with several other effective resistance genes such as Lr2l,<br />
Lr39, Lr41, Lr42 or the genes in KS92WGRC23 and KS93U180, more durable resistance<br />
could result. Durability would be enhanced if the genes were not deployed singly in any<br />
cultivars. This might prevent the rust from defeating the genes in a stepwise manner.<br />
- REFERENCES<br />
Appel, lA, Bowden, R.L., Willis, W.G. and Eversmeyer, M.G. 1992. Preliminary 1992 Kansas wheat disease<br />
loss estimates. Plant Disease Survey Report, Vol. 18 Kansas State Board of Agriculture, Topeka, KS.<br />
4pp.<br />
Browder, L.E. and Eversmeyer, M.G. 1987. Influence of temperature on development ofPiiccinia recondita<br />
with Triticum aestivum "Suwon 85 ". Phytopathology 77:423-425.<br />
Cox, T.S., Raupp, W.l, Wilson, D.L., Gill, B.S., Leath, S., Bockus, W.W. and Browder, L.E. 1992. Resistance<br />
to foliar diseases in a collection of Triticum. tauschii germplasm. Plant Dis. 76: 1061-1064.<br />
Cox, T. S., Raupp, W. l, and Gill, B. S. 1994. Leaf rust resistance genes Lr41, Lr42, and Lr43 transferred from<br />
Triticum tauschii to common wheat. Crop Sci.34:339-343.<br />
Kihara, H., Yamashita, K. and Tanaka, M. 1965. Morphological, physiological, genetical, and cytological<br />
studies in Aegi/ops and Triticum collected in Pakistan, Afghanistan, and Iran. Results Kyoto Univ. ScI.<br />
Expedition to Korakoran, HindukLish, 1965. 1: 1-118.<br />
Marshall, D. 1989. National and international breeding programs and deployment of plant germplasms, new<br />
solutions or new problems? Pages 182-203 In: Spatial Components of Plant Disease Epidermics. MJ.<br />
Jerger, (ed.). Prentice-Hall, Englewood Cliffs, N. l 273 pp.<br />
McIntosh, R.A., Wellings, C.R. and Park, R.F. 1995. <strong>Wheat</strong> Rusts: An Atlas of Resistance Genes. CSIRO,<br />
Australia. 200 pp.<br />
Pretorius, Z.A., Rijkenberg, F.HJ. and Wilcoxson, R.D. 1988. Temperature-specific seedling resistance and<br />
adult plant resistance to pziccinia recondita f sp. tritici in the wheat cultivar Glenlea. Plant Dis.<br />
72:439-442.<br />
Roelfs, AP., Singh, R.P. and Saari, E.E. 1992. Rust Diseases of <strong>Wheat</strong>: Concepts and Methods of Disease<br />
Management. Mexico, D.F.: CIMMYT. 81 pp.<br />
Zadoks, J.c., Chang, T.T, and Konzak, C.F. 1974. A decimal code for the growth stages of cereals. Weed<br />
Research 14: 415-421.<br />
Questions and Answers:<br />
Ravi Singh (Comment): <strong>The</strong> four resistance genes have been transferred to two CIMMYT<br />
spring wheat backgrounds and will be distributed in the 2001 Int. Bread <strong>Wheat</strong> Screening<br />
Nursery (IBWSN).<br />
Answer: This is good news! Thank you.<br />
157
Performance offour new leafrust resistance genes - Temam<br />
Table 1.<br />
Pedigrees of four leaf rust resistant wheat lines.<br />
Resistant ,<br />
"<br />
hexaploid lille Pedi2ree .' Resistance ~ene source<br />
KS92WGRCI6 Triumph 64/3fKS8010-711 TA2470 (Triticum tauschii)<br />
TA24701lTAM 200<br />
KS92WGRC23 Karl*311PI266844/PI355520 P1266844 (T. monococcum var. monococcum)<br />
KS93U180 Wrangler *2/TA 749 TA749 (T. monococcum var. boeoticum)<br />
KS93U3 WranglerllMustang *2/TA213 TA2l3 (T. monococcum var. boeoticum)<br />
Table 2.<br />
Field and adult plant infection responses displayed by four wheat lines<br />
containing new leaf rust resistance genes and eleven controls.<br />
Field inf~ction response and ..dis~ease severity a<br />
Kansas Texas Greenhouse<br />
Variety or line Manhatt.an Prosper Beeville Adult.IT b<br />
1992/93 ,1993/94 1994/95 1994/95 1994195<br />
KS9lWGRC16 0 0 0 0 0 ,<br />
KS92WGRC23 0 0 0 0 0 0<br />
KS93U180 10MR 0 lMR 10MR 40-50S ;C<br />
KS93U3 20MR 2MR 2MR 5-l0MR 10-20MS x-<br />
Wrangler 30S 55S 28S 80S 80S 3+<br />
TAM 107 30S 18S 23S 50S 70S 3+<br />
KarI92 50S 25S 55S 60S 70S 2+<br />
Wichita 60S 55S 28S 40S 80S Nrc<br />
TAM 200 30S IS IS 80S 80S ,<br />
WGRCI2-l 10MR 5MR 0 20S 10MS-MR NT<br />
Century 30S 9S 9S NT NT 3+<br />
WGRC2 5MR lMR lMR NT NT NT<br />
WGRClO 5MR 8MR 0 IR 0 NT<br />
WGRCll 0 0 0 lR 0 NT<br />
WGRC15 5MR 0 0 0 0 NT<br />
a Field infection responses are based on modified Cobb scale (9) and include two<br />
components: terminal disease severity and infection type; e.g. , 1 = 1 % severity, 5 = 5%<br />
severity, etc; and<br />
o= immune; R = resistant; MR = moderately resistant; MS = moderately susceptible; and <br />
S = susceptible infection type (IT). <br />
b <strong>The</strong> greenhouse adult ITs are scored on the 0 to 4 sCOIing scale (9). <br />
C NT = not tested. <br />
I<br />
158
Performance offour new leafrust resistance genes - Temam<br />
Table 3.<br />
Seedling infection types (ITs) displayed by four wheat accessions carrying<br />
new leaf rust resistance genes and five controls when inoculated with<br />
three isolates (CBBQ, CDBL, and MFBL) ofPucdnia recondita f.sp. tritid<br />
at four temperature regimes.<br />
". ..<br />
. ',J2,.?C " " j6~t '<br />
" ~: .., . :,20°C 24'IlC<br />
Cultivar orJioe CBB.Q .'CDBL :MFBL CBJJo. CDBL NiFBV ClmQ' eDSV, MFBL ,C61JQ ' ~nBL ;MFBL.<br />
KS92WGRC16 , , , , , , , , , , , ,<br />
~S92WGRC23 0 0 0 0 0 0 0 0 0 0 0 0<br />
KS93U180 ;C ;C ;C ;C ;C ;C ;lC ;lC ;IC ;lC ;lC ;lC<br />
KS93U3 x- x- x- x- x- x- x- x- x- x- x- x-<br />
Karl 92 2- 3 3 2 3+ 3+ 2 3+ 3+ 2 3+ 3+<br />
TAM 107 3 3 3 3 3 3 3 3 3 3 3 3+<br />
TAM 200 O', 0', 0; 0', 0', O', 0; 0 ;1 0 0 ; 1<br />
Wichita 3+ 3+ 3+ 4 4 4 4 4 4 4 4 4<br />
iWrangler 3 3 3 3 3 3+ 3 3 3+ 3 3 3+<br />
*<strong>The</strong> seedling infection types reported are (0) == no uredinia or other macroscopic sign of infection;<br />
(;) = no uredinia, but small chlorotic flecks present; (I) = small uredinia surrounded by necrosis;<br />
(2) = small to medium sized uredinia with green islands and surrounded by necrosis or chlorosis;<br />
(3) = medium sized uredinia with or without chlorosis; (4) = large uredinia without chlorosis;<br />
(X) = heterogeneous, similarly distributed over the leaves; (C) = more chlorosis than nonnal for the<br />
infection type; (+) = uredinia somewhat larger tha.n normal for the IT; and (-) = uredinia somewhat<br />
smaller than normal for the IT.<br />
159
HOST RANGE OF WHEAT STEM RUST IN ETHIOPIA<br />
Zerihun Kassaye l and O.S. Abdalla 2<br />
IPlant Protection Research Center, P.O. Box 37, Ambo, Ethiopia<br />
2C1MMYTIICARDA, P.O. Box 5466, Aleppo, Syria<br />
ABSTRACT<br />
Surveys were conducted to identify the host ranges of stem rust of wheat on<br />
non-Triticum grasses collected in Arsi, Bale, East and Western Shewa,<br />
Ethiopia, during the main and off-seasons, 1997-1998. Seedlings of<br />
susceptible wheat varieties were inoculated with urediospores collected from<br />
weeds, and vice versa. Of 10 rust infected weed species, Lolium temulentum<br />
and Setaria pumila were identified to be secondary hosts for wheat stem rust.<br />
Leaves of Avena fatua, Snowdenia polystachya, Cynodon dactylon, Bromus<br />
pectinatus and Euphorbia shiperiana turned yellow, but no sporulation<br />
occurred. <strong>Wheat</strong> sown in the off-season sown and volunteer wheat in fallow<br />
lands, along the edges of crop fields, roads, irrigation canals and under<br />
orchards were found to be good sources ofstem rust infection.<br />
INTRODUCTION<br />
<strong>Wheat</strong> is one of the most important cereal crops in Ethiopia. <strong>The</strong> area under production in<br />
Ethiopia is about 750,000 ha (Hailu, 1991). Average national wheat yields are low, ranging<br />
from 1.1 t ha- 1 on the peasant farms to 2.0 t ha- 1 on state farms (Hailu et al., 1991).<br />
Diseases are a major constraint to wheat production in the country. <strong>The</strong> importance of rust<br />
diseases, was recognized in 1930 by Castellani, 1938; Sibilia, 1938. <strong>Wheat</strong> stem rust is the<br />
widely distributed and can cause serious yield loss. Severity of stem rust epidemic is<br />
determined by the virulence of the pathogen, resistance of the host, favorable environment,<br />
and time available for disease development.<br />
In some parts of the world, wild grasses or weeds play an important role in the epidemiology<br />
of wheat rust (Puccinia spp). A number ofgrass species have been observed to be susceptible<br />
to these pathogens (Roelfs et al., 1992). Endemicity of rust is possible only if there is either<br />
annual continuity of hosts a resting period for the pathogen, or both. Continuity of hosts can<br />
be provided by crop cultivars, alternate host(s) or accessory graminaceous hosts (Zadoks,<br />
1980). <strong>For</strong> instance in Mediterranean countries, uredoinoculum has a graminicolous facies,<br />
with inoculum accumulation occurring on wheat migrating to grasses situated in the Atlas<br />
mountains (Zadoks, 1965) as crop harvest occurs.<br />
In Ethiopia, attempts have been made to investigate the specialization of stem rust on wild<br />
grasses. As a result it has been reported that Lotium spp. were considered as possible<br />
secondary hosts of stem rust (SPL, 1978; Loban et al., 1988). However, there remains a<br />
scarcity of information available on the host range of this pathogen in Ethiopia. This paper<br />
160
Host range a/wheat stem rust in Ethiopia - Zerihun<br />
presents efforts made to clarify the host range of wheat stem rust in Ethiopia.<br />
MATERIALS AND METHODS <br />
Surveys were conducted in the major wheat growing areas of Arsi, Bale and Shewa regions<br />
in 1997 and 1998. Fields were assessed and grass weeds were observed for rust infection.<br />
Rust infected specimens were also sent to the principal author by cooperators from other<br />
research centers and development organizations.<br />
Collected grass species seeds were sown in 10 cm diameter clay pots. Fifteen to twenty<br />
seedlings of wheat or each weed species were inoculated with urediospores from the wheat or<br />
weed species, at the two leaf stage. Spores with 100% germination rate, multiplied in<br />
greenhouse, were used for inoculation. Plants were inoculated in the evening and kept in a<br />
moisture chamber for 12-14h at ISoC, after which they were moved to a greenhouse at lS-28<br />
0c. Seedling of the susceptible wheat variety Morocco was inoculated with stem rust spores<br />
collected from weed species and cultivated wheat. Disease scoring was done using 0-4<br />
scoring scale (Roelfs et al., 1992). Symptoms were inspected and notes were taken 14 to 16<br />
days after inoculation.<br />
RESULTS AND DISCUSSION<br />
Ten grass weed species, naturally infected by rust diseases, were collected from fields during<br />
the main and off-seasons in Shewa, Arsi and Bale regions. Lotium temulentum was found to<br />
be commonly infected by stem rust throughout the surveyed regions (Table 1).<br />
Different levels of infection were observed when inoculating a susceptible wheat variety with<br />
urediospores collected from weeds of Lotium temulentum, Setaria pumila, Avena fatua,<br />
Snowdenia polystachya, Cynodon dactylon, Bromus pectinatus and Euphorbia shiperiana.<br />
Andropogon spp., Hordeum spp., and Agrostis spp. did not exhibit infection or disease<br />
symptoms (Table 2).<br />
Reverse inoculation with stem rust urediospores collected from wheat showed highest level<br />
of infection on Lotium temulentum and Setaria pumila. <strong>The</strong> remaining eight grass weed<br />
species exhibited no infection (Table 3). During the off season survey in some parts of Bale<br />
and Showa regions wheat and other stem rust host plants grown in fallow lands, along the<br />
edges of crop fields and irrigation canals were also infected by stem rust and were hence a<br />
good source of wheat stem rust inoculum.<br />
ACKNOWLEDGMENTS<br />
This research was financially supported by the Ambo Agricultural Research Center (EARO),<br />
in cooperation with the CIMMYT/European Union funded project "Strengthening <strong>Wheat</strong><br />
Breeding and Pathology Research in NARS in <strong>Eastern</strong> Africa".<br />
REFERENCES<br />
Castellani, E. 1938. Preliminary observation on cereal rusts in the highlands of Ethiopia. [Observazioni<br />
preliminari sulle ruggini del grano nell' aitopiano etiopico]. L' Agricoltura coloniale 32: 400-407.<br />
Hailu Beyene, Mwangi, W., and Workneh Negatu. 1991. <strong>Wheat</strong> production constraints in Ethiopia. pp. 17-32.<br />
In: Hailu Gebre Mariam, Tanner, D.G., and Mengistu Hulluka (eds.). <strong>Wheat</strong> research in Ethiopia: A<br />
161
Host range ofwheat stem rnst in Ethiopia - Zerihun<br />
historical perspective. Addis Ababa, Ethiopia: IARiCIMMYT.<br />
Hailu Gebre Mariam. 1991. <strong>Wheat</strong> production and research in Ethiopia. pp. 1-16 .. In: Hailu Gebre Mariam,<br />
Tanner, D.G., and Mengistu Hulluka (eds.). <strong>Wheat</strong> research in Ethiopia: A historical Perspective. Addis<br />
Ababa, Ethiopia: IARICIMMYT.<br />
Loban, V.L., Zerihun Kassaye and Temam Hussain. 1988. Wild grasses as reservoirs of stem rust of wheat.<br />
pp.12-15. Ethiopian Plant Pathology Newsletter. Vol. 13 No 3. Ethiopian Phytopathological<br />
Committee. Addis Ababa, Ethiopia.<br />
Roelfs, A.P., Singh, R.P. and E.E. Sarari. 1992. Rust diseases of wheat: Concepts and methods of disease<br />
management. Mexico, D.F.: CIMMYT. 7-14.<br />
SPL (Scientific Pathological Laboratory) 1978. Progress Report for the period 1977/78. SPL, Ambo, Ethiopia.<br />
Sibilia, C. 1938. First notes on Puccinia graminis tritici in Italian East Africa (Ethiopia). [Prime notize sulla<br />
Puuccinia graminis f sp. tritici u Africa Orientle ltaliana]. Boll. R. Staz. Patol. Veg. 18: 67-74.<br />
Zadoks, J .C. 1980. <strong>Wheat</strong> rust epidemiology in Ethiopia in relation to wheat breeding. Laboratory of Phytopath.<br />
Agri. Univ. Binneuhaven 9, <strong>The</strong> Netherlands. 34 pp.<br />
Zadoks, J.C. 1965. Epidemiology of wheat rust in Europe. FAO Plant Prot. Bull. 13:97-108.<br />
Questions and Answers:<br />
Colin Wellings (Comment): I am not aware that Latium temulentum and Setaria pumila<br />
support wheat stem rust in Australia. However, it is important to appreciate the role of grass<br />
hosts in the survival and evolution ofrust pathogens.<br />
Table 1.<br />
Incidence of stem rust infection on Lolium temulentum in the surveyed<br />
regions of Ethiopia, 1997-1998.<br />
Region Loe.~tion · .. Altitllde Ind4ence..(9fo) .<br />
Arsi Asasa 2300 22<br />
Dixis 2600 2<br />
Bekoji 2730 2<br />
Lole - 2<br />
Serufta 2520 3<br />
Lemu 2660 5<br />
Gofer 2520 5<br />
Bale Sinana 2400 10<br />
Adaba 2700 3<br />
Agarfa area 2450 10<br />
Shoa Debre Zeit 1850 23<br />
Debre Brihan 2550 3<br />
Sheno 2700 7<br />
Ambo 2225 15<br />
Gedo 2500 10<br />
Adda-Berga - 8<br />
162
Host range ofwheat stem rust in Ethiopia - Zerihun<br />
Table 2.<br />
Reaction of weed species to wheat stem rust.<br />
., . - ~ .. ' . - _~: " • " J<br />
' '-
STABILITY OF STEM RUST RESISTANCE <br />
IN SOME ETHIOPIAN DURUM WHEAT VARIETIES <br />
Sewalem Amogne, Woubit Dawit and Yeshi Andenow<br />
Debre Zeit Agricultural Research Center (EARO), P.O. Box. 32, Debre Zeit, Ethiopia<br />
ABSTRACT<br />
In the central highlands of Ethiopia, durum wheat (Triticum durum Desf.) and<br />
stem rust (PucCinia gram in is f.sp. trifici) have co-evolved for thousands of<br />
years resulting in a wide virulence spectrum of the stem rust fungus. Races of<br />
the pathogen in the region are among the most virulent in the world, and the<br />
Debre Zeit area is known to represent the widest virulence spectrum in the<br />
country. Five durum wheat cultivars, viz., Gerardo, Cocorit-71, Foka, Boohai<br />
and DZ-04-118, were studied from 1993/94 to 1999/00 at Debre Zeit to<br />
determine the stability of their resistance to stem rust. Two statistics suitable<br />
for measuring the stability of disease resistance over time were used in this<br />
investigation: genotypic variance (S2D and coefficient of variation (CVD.<br />
Accordingly, cultivars Foka and Boohai were found to be more stable in their<br />
resistance to stem rust than the other cultivars tested. Foka and Boohai had<br />
smaller S2j with values of 0.146 and 0.154, respectively; and relatively lower<br />
CV i values of 27.30 and 30.62, respectively. Gerardo was the least stable<br />
cultivar in terms of resistance to stem rust.<br />
INTRODUCTION<br />
Durum wheat (Triticum durum Desf.) is largely grown in the central highlands of Ethiopia, at<br />
an altitude ranging from 1700 to 2900 m a.s.l. (Efrem, 1983). In this region, durum wheat and<br />
stem rust (Puccinia gram in is Pers. f.sp. trifici) have co-evolved for thousands of years, and<br />
this close association has resulted in a wide virulence spectrum of the stem rust fungus<br />
(Getinet et al., 1990). Stem rust is one of the major durum wheat diseases in the vicinity of<br />
the Debre Zeit Research Center (Yeshi et al., 1995).<br />
Stem rust races prevalent in the central highlands of Ethiopia are among the most virulent in<br />
the world (van Ginkel et al., 1989), with the widest virulence spectrum observed at Debre<br />
Zeit where virulence for 60% of the Sr-genes tested was observed (Getinet et al., 1990;<br />
Mengistu and Yeshi, 1992).<br />
Currently, the disease is mainly controlled by the use of resistant varieties developed through<br />
hybridization and/or introduction (Mengistu and Yeshi, 1992). However, resistant varieties<br />
with acceptable level of disease resistance often rapidly succumb to the disease soon after<br />
release. Ideally, when the resistance of a variety has broken down, it should be withdrawn<br />
from production. However in practice, farmers often grow these varieties for many years.<br />
This experiment was therefore conducted to monitor the persistence/stability of resistance in<br />
released durum wheat varieties to stem rust at Debre Zeit, Ethiopia.<br />
164
Stability ofstem rust resistance in some Ethiopian durum wheat varieties - Sewalem et al.<br />
MATERIALS AND METHODS<br />
Five durum wheat varieties released in Ethiopia (Gerardo, Cocorit-71, Foka, Boohai, and DZ<br />
04-118) were tested in the 1993/94 to 199912000 cropping seasons at Debre Zeit, Ethiopia for<br />
reaction to stem rust. Planting was conducted in four replicates (three replicates in the<br />
1999100 crop season) using a randomized complete block design (RCBD) on 3m x3m plots.<br />
<strong>The</strong> local susceptible durum wheat variety, DZ-04-118, was used as a check. <strong>The</strong> disease,<br />
developed from natural infection, was assessed after heading using the modified Cobb's<br />
scale. Data were recorded for stem rust severity and reaction types and were converted into<br />
coefficient of infection (C.l.), which were transformed into logarithmic scales to stabilize<br />
variances (Petersen, 1994).<br />
According to Becker and Leon (1988), stability can be divided into two groups: static and<br />
dynamic concepts of stability. <strong>The</strong> dynamic concept of stability deals with YIeld or other<br />
quantitative traits that react similarly to favorable or unfavorable environmental conditions.<br />
<strong>The</strong> static concept of stability is useful for traits, the level of which have to be maintained at<br />
all costs, e.g. for quality traits, for resistance against diseases, or for stress characters such as<br />
winter hardiness. .<br />
Lin et al. (1986) and Xie and Mosjids (1996) suggestt?d genotypic variance (S2;) and<br />
genotypic coefficient of variation (CV i ) as appropriate measures of stability of static traits.<br />
We used two statistics to determine the stability of durum wheat varieties for resistance to<br />
stem rust, computed as follows:<br />
q<br />
S? = L (X ij - 8i.)2/q-1; and<br />
j=l<br />
where Xij = the observed mean stem rust severity value of genotype i in year j; Xii - 8j. =<br />
deviation from the average stem rust severity; q = number of years; and 8i. = mean of<br />
genotype i over all years. Years were considered as separate environments since the<br />
experiment was conducted at one location, i.e., Debre Zeit, Ethiopia. Locations, years and<br />
cultural practices usually result in similar reactions of a genotype and thus can replace one<br />
another (Becker and Leon, 1988).<br />
RESUL TS AND DISCUSSION<br />
<strong>For</strong> stability to be considered, the variety x year interaction need to be significant; otherwise,<br />
one could directly select any variety with the lowest mean stem rust severity. <strong>The</strong> results of<br />
the combined ANOVA showed that there was a highly significant (P = 0.01) variety x year<br />
interaction (Table 1). Stability parameters were calculated as indicated in Table 2. According<br />
to Petersen (1994) and Becker and Leon (1988), the smaller the numerical values of S2i and<br />
CV i , the more stable is the genotype.<br />
<strong>The</strong> susceptible check cultivar, DZ-04-118, showed the highest mean stem rust severity<br />
(Table 2). Cultivars Cocorit-71 and Boohai expressed the highest degree of resistance,<br />
165
Stability ofstem rust resistance in some Ethiopian durum wheat varieties - Sewalem et at.<br />
however, there were no significant differences (P =<br />
severities exhibited by Boohai, Cocorit-7l or Foka.<br />
0.01) among the mean stem rust<br />
Foka and Boohai were stable in their resistance to stem lUst (Table 2). <strong>The</strong>y had lower mean<br />
stem rust scores with values of 1.42 and 1.28, and smaller S2/ with values of 0.146 and 0.154,<br />
respectively, and relatively lower CVj with values of 27.30 and 30.62, respectively. Boohai,<br />
released in 1982, remains resistant to stem rust, and may thus be considered to exhibit<br />
durable resistance to stem rust (DZARC, 1997).<br />
Although Cocorit-7l exhibited a low value for mean stem rust severity (1.28), variable<br />
reaction over years resulted in its poor stability for resistance to stem rust. Low means with<br />
high CVj and S2, indicate that means are not efficient measures of stability for disease<br />
resistance.<br />
CONCLUSIONS<br />
Evidence is presented concerning the stability of resistance to stem rust by the cultivars Foka<br />
and Boohai as tested over six years. '<strong>The</strong>se cultivars may exhibit durable resistance to stem<br />
rust. Studies to ascertain the number and diversity of genes for resistance should' be<br />
performed to enable breeders to effectively use these cultivars for development of resistant<br />
cultivars.<br />
<strong>The</strong>re should be little danger in growing Cocorit-71 at Debre Zeit since its resistance to stem<br />
rust is reasonably stable. <strong>The</strong> variety should be grown as long as it shows a reasonable<br />
resistance to the disease.<br />
Gerardo was the most susceptible cultivar observed relative to the susceptible check DZ-04<br />
118. <strong>The</strong> variety was found to be unstable in its resistance to stem rust. With regular close<br />
supervision of its status of resistance, the variety Gerardo may remain under production for<br />
some years until it becomes critically susceptible to the disease.<br />
ACKNOWLEDGMENTS<br />
<strong>The</strong> authors wish to thank Mr. Tiruneh Kefyalew and Mr. Tebkew Damte, Debre Zeit<br />
Agricultural Research Center, for their help in analyzing the data and provision of reference<br />
literature on the subject ofstability.<br />
REFERENCES<br />
Becker, H.c. and J. Leon. 1988. Stability analysis in plant breeding. Plant Breeding 101: 1-23. <br />
DZARC (Debre Zeit Agricultural Research Center). 1997. DZARC from Where to Where? "Research With A <br />
Mission" (1953-1997). Mesfin Abebe and Tekalign Mamo (eds.). DZARC. Debre Zeit, Ethiopia.<br />
Efrem Bechere. 1983. <strong>Wheat</strong> production and research in Ethiopia. In: <strong>Regional</strong> <strong>Wheat</strong> <strong>Workshop</strong> for <strong>Eastern</strong>,<br />
Central and Southern Africa. Arusha, Tanzania. June 13-17, 1983.<br />
Getinet Gebeyehu, van Ginkel, M., Mentewab Haregewoin, Mengistu Hulluka, Yeshi Andenow, and Ayele<br />
Badebo. 1990. <strong>Wheat</strong> rust virulences in Ethiopia. pp, 28-38. In: Tanner, D.G., van Ginkel, M. and M.<br />
Mwangi. (eds.). Sixth <strong>Regional</strong> <strong>Wheat</strong> <strong>Workshop</strong> for <strong>Eastern</strong>, Central and Southern Africa. Mexico,<br />
D.F. : CIMMYT.<br />
Lin, C.S., Binns, M.R. and L.P. Lefkovitch. 1986. Stability analysis: Where do we stand? Crop Sci. 26: 894<br />
899.<br />
166
Stability ofstem rust resistance in some Ethiopian durum wheat varieties - Sewalem et al.<br />
Mengistu Hulluka and Yeshi Andenow. 1992. Stability of the reaction of wheat differential lines to stem and<br />
leaf rusts at Debre Zeit. Ethiopia. pp. 190-192. In: Tanner, D.G. and W. Mwangi (eds.). Seventh<br />
<strong>Regional</strong> <strong>Wheat</strong> <strong>Workshop</strong> for <strong>Eastern</strong>, Central and Southern Africa. Nakuru, Kenya. CIMMYT.<br />
Petersen, R.G. 1994. Agricultural Field Experiments: design and analysis. Marcel Dekker Inc., New York,<br />
USA.<br />
van Ginkel, M., Getinet Gebeyehu, and Tesfaye Tessema. 1989. Stripe, stem and leaf rust races in major wheat<br />
producing areas in Ethiopia. IAR Newsletter of Agricultural Research 3(4): 6-8.<br />
Xie, C. and 1.A. Mosjids. 1996. Selection of stable cultivars using phenotypic variances. Crop Sci. 36: 572-576.<br />
Yeshi Andenow, Negussie Tadesse and Sewalem Amogne. 1995. Program Review in Crop Protection. pp. 27<br />
31. In: Efrem Bechere (ed.). <strong>For</strong>ty Years of Research Experience: Debre Zeit Agricultural Research<br />
Centre (DZARC). 1955-1994. DZARC, AUA.<br />
Questions and Answers:<br />
Colin Wellings: You indicated that genetic analysis of the resistance in the resistant durums<br />
will be undertaken. Do you intend to combine this with a detailed study of variation in the<br />
pathogen?<br />
.<br />
Answer: Yes, there is a plan to do race identification for the stem rust fungus at regular<br />
intervals. When we'll be able to set up such studies, it will be possible to combine it with a<br />
stability study which is continuous.<br />
167
Stability ofstem rust resistance in some Ethiopian durum wheat varieties - Sewalem et al.<br />
Table 1. A combined ANOV A for the six test years (1993/94 to 1999/00) .<br />
SQ~rce<br />
Variety (V) 4 3.5353<br />
.4.musted,<br />
."'N1$:- ....<br />
0.8838<br />
'.<br />
F<br />
Ratio<br />
6.35**<br />
Years (Y) 5 7.4477 1.4895 10.70**<br />
VxY 20 11.4343 0.5717 4.11 **<br />
Error 82 11.4192 0.1393<br />
Total 114<br />
** Significant at P .:s; 0.01.<br />
Table 2.<br />
Mean stem rust severity and stability statistics for stem rust resistance<br />
in durum wheat varieties tested over six years at Debre Zeit, Ethiopia.<br />
Year of<br />
)Vleam~t~mrust .' Stability statini~s3<br />
Genotype 1<br />
'l<br />
rei¢~s~'<br />
sev~rity':(j9g c.Il· . S.; C¥;<br />
Gerardo 1976 1.48ab 0.249 33.69<br />
Cocorit-71 1976 1.28b 0.199 34.82<br />
Foka 1993 1.42b 0.146 27.30<br />
Boohai 1982 1.27b 0.154 30.62<br />
DZ-04-118 1966 1.75a 0.202 25.71<br />
I<br />
<strong>The</strong> figures III parentheses Illdlcate the years of release of the respective culttvars. <br />
1 c.l.: coefficient of infection, significant at P .:s; 0.01. <br />
3 S2i: genotypic variance; and CVi: genotypic coefficient of variation. <br />
168
FIELD RESPONSE OF BREAD WHEAT GENOTYPES <br />
TO SEPTORIA TRITICI BLOTCH <br />
Temesgen Kebede l and T.S. Payne 2<br />
IKulumsa Research Center (EARO), P.O. Box 489, Asella, Ethiopia<br />
2CIMMYT, P.O. Box 5689, Addis Ababa, Ethiopia<br />
ABSTRACT<br />
A field experiment was conducted in order to evaluate bread wheat genotypes<br />
for resistance to Septaria tritid blotch. Thirty-six bread wheat genotypes were<br />
evaluated at the Bekoji and Boletta Agricultural Research Centers. <strong>The</strong><br />
combined analysis of variance showed that the mean squares due to genotypes,<br />
environments and the interaction effect were significant (P
Field response o/bread wheat genotypes to Septoria tritici blotch - Temesgen and Payne<br />
experiment conducted at Holetta ARC, 82% grain yield loss was recorded due to this disease<br />
under natural infection (JAR, 1971). Thus the seriousness of STB outbreaks have made it<br />
imperative to devise suitable control measures.<br />
Resistance in wheat to Septaria tritici has been demonstrated by a number of researchers, and<br />
breeding for resistance is likely to be the most practical method of control (Arama, 1996).<br />
Several sources of resistance have been reported but breeding for resistance has not always<br />
been successful in protecting wheat cultivars from the damaging effects of the disease (Mann et<br />
at., 1985; Rajaram and Dubin, 1982), because expression of resistance is often correlated with<br />
morphological traits such as plant height, maturity and canopy architecture (Eyal et at., 1985).<br />
Moreover, wheat cultivars resistant in one part of the world may display susceptibility<br />
elsewhere. Even within countries, differences observed in virulence may be associated with<br />
fungal genetic variability (Eyal et aI., 1973; 1985). Thus, the objective of this experiment was<br />
to evaluate the response of bread wheat genotypes against the prevailing Septaria trifici<br />
population at two locations in Ethiopia.<br />
MATERIALS AND METHODS<br />
Plant Materials, Experimental Design and Procedures<br />
<strong>The</strong> field experiment was conducted at two locations; Bekoji and Holetta ARC, Ethiopia, both<br />
hot spot areas for STB. Thirty-six bread wheat genotypes, including a standard check (Kubsa)<br />
and a susceptible check (Laketch), were used in the experiment (Table 1). <strong>The</strong> experiment was<br />
conducted using a plot size of 1.6 m 2 (4 rows of2 m long and 20 cm between rows) in a simple<br />
lattice design with two replications. <strong>The</strong> genotypes were evaluated under natural disease<br />
epidemics during the 1998 main cropping season, June to November. All standard cultural<br />
practices were applied as recommended for each location. Disease assessments were made<br />
when the genotypes were on average between medium milk and late milk growth stages using<br />
the double digit 00-99 scoring scale (Saari and Prescott, 1975; Eyal et at., 1987). At the same<br />
growth stage, the percentage necrotic leaf area on the flag leaf (F) and penultimate leaf (F -1)<br />
was estimated. <strong>For</strong> estimating the percentage necrotic leaf area, ten tillers were sampled at<br />
random from the two central rows of each plot. <strong>The</strong> pe~centage of necrotic leaf area was<br />
combined for the two leaves on each tiller and averaged for the ten tillers observed in each<br />
plot.<br />
Analysis of variance<br />
Statistical Procedures<br />
Analysis of variance for simple lattice design was performed for percentage necrotic leaf area<br />
and grain yield separately for the two locations using MST A TC computer software statistical<br />
package (Michigan State University, 1989). Since the simple lattice design used in this study<br />
was more efficient than a Randomized Complete Block Design for the two response<br />
variables, the treatment means were adjusted accordingly. In order to determine the<br />
performance of the bread wheat genotypes across locations, a combined analysis of variance<br />
for the two variables was performed.<br />
170
Field response ofbread wheat genotypes to Septoria tritici blotch - Temesgen and Payne<br />
Regression analysis<br />
In order to identify the true genetic resistance of bread wheat genotypes to STB a multiple<br />
linear regression analysis was done in order to correct the linear effects of days to heading<br />
(DH) and plant height (HT) on percentage necrotic leaf area following the procedures of van<br />
Beuningen and Kohli (1990).<br />
Similar to the percentage necrotic leaf area, the linear effects of days to heading and plant<br />
height on severity of STB assessed using the double-digit 00-99 scoring scale was analyzed.<br />
Following the procedures of van Beuningen and Kohli (1990) a coefficient of infection (eI)<br />
was derived by multiplying the two digits of the double digit 00-99 scale. To calculate a<br />
balanced average, these original disease scores were converted to relative values, expressed<br />
as a percentage of the maximum reading at the same testing location and referred to as the<br />
relative coefficient of infection (ReI).<br />
<strong>The</strong> relative coefficient of infection obtained was then utilized in computing the multiple<br />
linear regression to investigate the relationship between disease severity due to STB, and<br />
days to heading and plant height.<br />
From the multiple linear regression analysis the observed ReI (Y) was expressed as a linear<br />
function of days to heading (DH) and plant height (HT), giving the following regression<br />
model.<br />
Y= a + (PI x DH) + (P2 x HT) + e<br />
Where: a = intercept<br />
PI and P2 = partial regression coefficients<br />
DH = days to heading<br />
HT = plant height<br />
E<br />
= error term<br />
Using this model, the expected ReI, the value for which .the effects of days to heading and<br />
plant height are removed, was calculated. <strong>The</strong> difference between the observed ReI and<br />
expected ReI constitutes an improved approximation of the true genetic resistance which is<br />
expressed as the error term "e", or those components of resistance that do not depend on days<br />
to heading and plant height, although it also includes nonlinear effects of DH and HT and<br />
environmental error. When "e" is expressed in units of the standard error of regression, the<br />
value obtained is referred to as the deviation from the regression of infection on DH and HT<br />
(DRIHH). This allowed an immediate interpretation of the resistance.<br />
RESULTS AND DISCUSSION<br />
Reactions of Bread <strong>Wheat</strong> Genotypes to STB<br />
<strong>The</strong> analysis of variance for the individual locations and the combined analysis of variance<br />
for the mean percentage necrotic leaf area is presented in Table 2. <strong>The</strong> combined analysis of<br />
variance indicated that the main effects of genotypes and environment were significant<br />
(P=O.Ol). <strong>The</strong> genotype and environment interaction was also significant (P=O.Ol). <strong>The</strong><br />
significance of the mean square due to G x E indicates that genotypes differ from one<br />
171
Field response o/bread wheat genotypes to Septaria tritici blotch - Temesgen and Payne<br />
location to another in terms of their reaction to STB. On the other hand the significance of G<br />
x E indicates possible differences in pathogen virulence spectrum between the two locations.<br />
<strong>The</strong> magnitude of the G x E interaction was low as compared to the main effects of<br />
genotypes. This indicates that some genotypes performed consistently across locations.<br />
Hence those genotypes which performed better across the two locations were selected<br />
through mean separation. Comparison of the mean percentage necrotic leaf area (Table 3)<br />
indicated that HAR 3640 was significantly different (P=0.05) from the susceptible check,<br />
Laketch followed by the advanced lines such as HAR 3638, HAR 1698, HAR 2096, HAR<br />
3641, and the cultivar Mitike.<br />
Interestingly, recently released cultivars such as Magal and Wabe were more susceptible to<br />
STB than Laketch. This may be explained by yellow rust infection that occurred late in the<br />
season at Bekoji on Laketch competing for the remaining green leaf area of flag and<br />
penultimate leaves, and hence, the development of STB on Laketch could not progress<br />
further.<br />
<strong>The</strong> percentage necrotic leaf area' on HAR 3634 (=Bob white), was low indicating an<br />
effectiveness of the resistance genes in this genotype. However, virulence on HAR 3634 has<br />
already been reported in other countries such as Argentina (Cordo et aI., 1994) and in Mexico<br />
(Gilchrist and Velazquez, 1994).<br />
Effect of Days to Heading and Plant Height on Severity of STB<br />
STH assessed using percentage necrotic leaf area<br />
<strong>The</strong> effect of days to heading (DH) and plant height (HT) on percentage necrotic leaf area<br />
was assessed by multiple linear regression analysis. <strong>The</strong> regression and partial regreSSIOn<br />
coefficients for this analysis are presented in Table 4.<br />
<strong>The</strong> analysis of variance due to regression ofpercentage necrotic leaf area on days to heading<br />
and plant height, presented in Table 5, indicated that both agronomic characters significantly<br />
(P=O.OI) affected percentage necrotic leaf area. However, days to heading and plant height<br />
accounted for only about 29% of the variation in observed percentage necrotic leaf area.<br />
From the multiple linear regression analysis, the following regression model was developed<br />
in order to modify the observed percentage necrotic leaf area.<br />
Percentage necrotic leaf area = 258.243 - 1.693DH - 1.036HT + e<br />
<strong>The</strong> observed, expected percentage necrotic leaf area and the deviation from the regression of<br />
the infection on DH and HT (DRIHH) of bread wheat genotypes with superior resistance are<br />
presented in Table 6. A value of -1.5 for a genotype implies that it would be situated 1.5 units<br />
from the standard error below the regression plane and indicates that the genotype would<br />
have considerably less infection than can be explained by the linear effects of heading date or<br />
plant height.<br />
After correcting the observed percentage necrotic leaf area, advanced lines found to be<br />
resistant to STB through analysis of variance are still resistant to STB. However, HAR 3640<br />
which was reported to be the most resistant through analysis of variance of observed<br />
172
Field response o/bread wheat genotypes to Septoria tritici blotch - Temesgen and Payne<br />
percentage necrotic leaf area, was not selected as resistant after correcting percentage necrotic<br />
leaf area. This result indicated that when genotypes are evaluated under natural conditions,<br />
taller or late maturing varieties tend to escape disease infection and may wrongly be<br />
considered resistant.<br />
STB assessed using the double digit 00-99 scale<br />
In order to identify the true genetic resistance using this scoring method, the relationship<br />
between (RCI), and days to heading (DH) and plant height (HT) was analyzed using the<br />
multiple linear regression (Table 7). <strong>The</strong> RCI, DB and HT appeared to vary among genotypes<br />
but there was an association among these variables.<br />
<strong>The</strong> analysis of variance for the multiple linear regression is presented-in Table 8. <strong>The</strong> results<br />
indicated that days to heading and plant height significantly affected relative coefficient of<br />
infection due to STB. However, days to heading and plant height accounted for only about 28<br />
% of the variation in relative coefficient of infection. This low correlation coefficient may be<br />
due to lack of variability for heading or height among the genotypes tested. <strong>The</strong> range<br />
between minimum and maximum heading date was 21 days. <strong>The</strong> range for plant height looks<br />
high, about 50 cm, but it was because one entry, HAR 3640, is relatively tall, 130 cm, with<br />
the remaining cultivars and advanced lines, either semi-dwarf or medium tall.<br />
From the multiple regression analysis the following regression model was developed in order<br />
to correct the relative coefficient of infection and thus identify the true genetic resistance.<br />
RCI = 228.92 - 1.6lDH - 0.80HT + e<br />
<strong>The</strong> observed, expected RCI and the deviation from the regression of the infection on days to<br />
DR and RT (DRIRH) of bread wheat genotypes with superior resistance is presented in Table<br />
9. A value of -1.6 for a genotype implies that it would be situated 1.6 units of the standard<br />
error below the regression plane and indicates that it has considerably less infection than can<br />
be explained by the linear effects of its heading and height.<br />
<strong>The</strong> results of this study indicated that the , severity of STB assessed using both percentage<br />
necrotic leaf area and double digit 00-99 scale are associated with days to heading and plant<br />
height. In agreement, Eyal et al. (1983) reported the association between resistance to STB<br />
and days to heading and plant height. Tavella (1978) concluded that plant height was<br />
negatively correlated with wheat STB disease severity. We found a low but significant<br />
correlation coefficient between percentage necrotic leaf area and days to heading and plant<br />
height. Similar correlation was found for relative coefficient of infection.<br />
<strong>The</strong>se results are in contrast to Arama (1996) who did not observe an effect ofplant height on<br />
the observed disease severity. On the other hand, Eyal and Talpaz (1990) and van Beuningen<br />
and Kohli (1990) have observed significant effects of heading date and plant height on<br />
severity of STB. <strong>The</strong> present finding is in agreement with the findings of Jilbene et al. (1992)<br />
and Camacho-Casas et al. (1995) who showed the association between reduced disease<br />
severity with late maturity and tall plant height.<br />
173
Field response ofbread wheat genotypes to Septoria tritici blotch - Temesgen and Payne <br />
Grain Yield Performance of Bread <strong>Wheat</strong> Genotypes <br />
<strong>The</strong> analysis of variance for the individual locations and the combined analysis of variance<br />
for grain yield are presented in Table 10. <strong>The</strong> combined analysis of variance for the mean<br />
grain yield indicated that highly significant difference (P=O.O 1) were observed among the<br />
genotypes. <strong>The</strong> main effect of the environment and the interactions were also significant. <strong>The</strong><br />
significance of G x E interaction indicated that the yield performance of the genotypes<br />
differed between locations.<br />
<strong>The</strong> magnitude of the interaction effect was low, as compared to the main effects of the<br />
genotypes, indicating that some genotypes performed consistently across the locations.<br />
Comparison of mean grain yield of bread wheat genotypes showed that advanced lines such<br />
as HAR 1882, HAR 1755, HAR 1698 and commercial cultivar Mitikesignificantly yielded<br />
better than the standard check, Kubsa (Table 11). Advanced lines HAR 3638 and HAR 2096<br />
which were found to be resistant to STB based on corrected percentage necrotic leaf area and<br />
double digit 00-99 scale also had reasonable grain yield compared with Kubsa. <strong>The</strong> grain<br />
yield data was considered to have an insight into the yield potential of advanced lines which<br />
showed resistance to STB that may be used in transferring resistant genes to high yielding but<br />
susceptible cultivars to STB in the future improvement program.<br />
SUMMARY AND CONCLUSIONS<br />
A combined analysis of variance for the percentage necrotic leaf area showed that the main<br />
effects of the genotypes, environments and the interaction effect were significant (P=O.Ol).<br />
<strong>The</strong> advanced lines HAR 3640, HAR 3638, HAR 1698, HAR 2096, HAR 3641 and Mitike<br />
were resistant to STB as compared to Laketch.<br />
A multiple linear regression analysis showed that the percentage necrotic leaf area was<br />
significantly affected by days to heading and plant height. <strong>The</strong> advanced lines indicated<br />
above have true genetic resistance as observed through deviation from the regression of<br />
infection from days to heading and plant height. However, the resistance observed under field<br />
conditions for HAR 3640 was mainly due to escape mech.anisms involving late maturity and<br />
tall plant stature. <strong>The</strong> performance of the genotypes followed a similar trend for the double<br />
digit 00-99 score. <strong>The</strong> ranking of genotypes, however, varied between assessment methods.<br />
This study suggested that in screening germplasm for resistance to Septaria tritici blotch,<br />
severity data should be corrected for the effects of days to heading and plant height,<br />
especially when the genotypes are not grouped into maturity classes.<br />
REFERENCES<br />
Arama, P.F. 1996. Effects of cultivar, isolate and environment on resistance of wheat to Septoria trifici blotch in<br />
Kenya. Ph.D. <strong>The</strong>sis. Wageningen Agricultural University. 115 pp.<br />
Camacho-Casas, M.A., Kronstad, W.E., and A.L. Scharen. 1995. Septoria tritici resistance and associations with<br />
agronomic traits in a wheat cross. Crop Science 35:971-976.<br />
Cordo, c.A., PerHo, A.E., Arriaga, H.O., Bendicto, G., Avila, V. and I.R. de Ziglino. 1994. Resistancia a la<br />
"Mancha Foliar" causado por Septoria trifici en el trigo pan (Triticum aestivum L.). Revista de la Facultad<br />
de Agronomia, la Plata 70:23-26. (Cited in Eyal, 1995).<br />
Dagnachew Yirgu. 1969. Losses due to leaf blotch (Septoria tritici) of wheat. Progress Report on Agricultural<br />
Research Activities. Debre Zeit : H.S.I.U.<br />
174
Field respanse afbread wheat genatypes to Septaria tritid blotch - Temesgen and Payne<br />
Eshetu Bekele. 1985. A review of research on diseases ofbarley, tef and wheat in Ethiopia. pp. 79-108. In: Tsedeke<br />
Abate (ed.). A Review of Crop Protection Research in Ethiopia. Proceedings of the First Ethiopian Crop<br />
Protection Symposium. 4-7 February, 1985. Addis Ababa, Ethiopia: IAR.<br />
Eyal, Z. and H. Talpaz. 1990. <strong>The</strong> combined effect ofplant stature and maturity on the response of wheat and<br />
triticale accessions to Septoria tritici. Euphytica 46: 133-141.<br />
Eyal, Z., Amiri, Z. and 1. Wahl. 1973. Physiologic specialization ofSeptaria tritici. Phytopathology 63: 1087-1091.<br />
Eyal, Z., Wahl, 1. and J .. M. Prescott. 1983. Evaluation of germplasm response to septaria tritid blotch. Euphytica<br />
32: 439-446.<br />
Eyal, Z., Scharen, A.L., Huffman, M.D. and J.M. Prescott. 1985. Global insights into virulence frequencies of<br />
Mycosphaerella gramillicola. Phytopathology 75: 1456-1462.<br />
Eyal, Z., Scharen, A.L., Prescott, J.M. and M. van Ginkel. 1987. <strong>The</strong> Septoria Diseases of <strong>Wheat</strong>: Concepts and<br />
methods of disease management. Mexico, D.F.: CIMMYT, 46 pp.<br />
Getinet Gebeyehu, van Ginkel, M., Temesgen Kebede, Mintwab Haregewoin, Rebeka Desta, Bainbridge, A. ,<br />
Mengistu Hulluka, Yeshi Andnew, Derege Tadesse, Amanuel Gorfu and Ayele Badebo. 1990. <strong>Wheat</strong><br />
disease survey in Ethiopia in 1988. pp. 153-165. In: Tanner, D.G., van Ginkel, M. and W.M. Mwangi<br />
(eds.). Sixth <strong>Regional</strong> <strong>Wheat</strong> <strong>Workshop</strong> for <strong>Eastern</strong>, Central and Southern Africa. Mexico, D.F. :<br />
CIMMYT.<br />
Gilchrist, L. and C. Velazquez. 1994. Interaction to Septaria tritid isolate-wheat as adult plant under field<br />
conditions. pp. 187-190. In: Arseniuk, E., Goral, T. and P. Czembor (eds.). Septoria of Cereals.<br />
Proceedings of the Fourth International <strong>Workshop</strong>. Radzikov, Poland.<br />
Institute ofAgricultural Research (IAR). 1971. Holetta Genet Research Station. Progress report for the period April<br />
1970 to March 1971. -<br />
Jlibene, M., Gustafson, J.P. and S. Rajaram. 1992. A field disease evaluation method for selecting wheats resistant<br />
to Mycospaerella graminicola. Plant Breeding 108:26-32.<br />
Mann, C.E., Rajaram, S. and R.L. Villareal. 1985. Progress in breeding for Septaria trifici resistance in semi-dwarf<br />
spring wheat at CIMMYT. In: A.L. Sacharen. (ed.). Septoria ofCereals: Proceedings of the workshop.<br />
Bozeman, Montana, 2-4, Aug. 1983. Montana State University. 116 pp.<br />
Michigan State University. 1989. MSTATC. A microcomputer program for the design, management and analysis<br />
ofagronomic research experiments. Michigan State University, East Lansing, USA.<br />
Rajaram, S. and H.J. Dubin. 1977. Avoiding genetic vulnerability in semi-dwarf wheats. Ann. N.Y. Acad. Sci. 287:<br />
243-254. .<br />
Rajaram, S. and H.J. Dubin. J982. <strong>The</strong> ClMMYT's international approach to breeding disease -resistant wheat.<br />
Plant Disease 66: 967- 971.<br />
Saari, E.E. and R.D. Wilcoxson. 1974. Plant disease situation of high-yielding dwarf wheats in Asia and Africa.<br />
Annual Review ofPhytopathoJogy 12: 49-68. .<br />
Saari, E.E. and J.M. Prescott. 1975. A scale for appraising the foliar intensity ofwheat diseases. Plant Disease<br />
Reporter 59: 377-380.<br />
Scientific Phytopathological Laboratory (SPL). 1975. Progress report for the period January, 1975 to December,<br />
1975. Ambo: SPL.<br />
Scientific Phytopathological Laboratory (SPL). 1978. Progress report for the period January, 1978 to December,<br />
1978. Ambo: SPL.<br />
Stewart, R.B. and Dagnatchew Yirgu. 1967. Index of Plant Diseases in Ethiopia. Experimental Station Bull. No.<br />
30. Ethiopia College ofAgriculture, Haile Selassie University.<br />
Tavella, C.M. 1978. Date of heading and plant height of wheat varieties as related to STB damage. Euphytica 27:<br />
577-580.<br />
Van Beuningen, L.T. and M.M. Kohli. 1990. Deviation from the regression of infection on heading and height as a<br />
measure of resistance to STB on wheat. Plant Disease 74: 488-493.<br />
175
Field response o/bread wheat genotypes to Septoria tritici blotch - Temesgen and Payne<br />
Table 1.<br />
List of bread wheat genotypes used in the field experiment.<br />
.. : n· ' · .· .. · .> - , ''''<br />
.- C()de ... _VarietY , .<br />
..,: - ' ; 'i -", v "'GlWs~if~di~ree i" .<br />
- . ',<br />
01 K6295-4A ROMANY x GB-GAMENY A<br />
02 ET-13A2 ENKOY UQI05 SEL.<br />
03 ENKOY [HEBRAND SELI(WIS245 x SUP51lx[CFR-FNNfA]<br />
04 MITIKE BOW 28 RBC<br />
05 DASHEN KVZIBUHO "S"IIKALIBB<br />
06 WABE MRL "s" BUC "s"<br />
07 GALAMA 4777 (2)1IFKN/GB/3/PVN "S"<br />
08 MAGAL F3711TRMIIBUC "S"/3/LlRA "S'<br />
09 ABOLA BOW "S'IBUC "s"<br />
10 TUSIE COOK/VEE "S"IIDOVE "S"/SERI<br />
11 HAR 1706 BOW "S"/BUC "s"<br />
12 KATAR COOK/VEE "S"IIDOVE "S"/SERII3IBJY "s"<br />
13 HAR 1875 GOV/AZIIMUS "s"<br />
14 HAR 1868 GOV9/AZIIMUS "S"/3/R37 GHLl2l11KALlBB/4/ANI "S'<br />
15 TURA ARO YR SEL.60/89<br />
16 HAR 1852 NDVG 9144 lIKALlBB/3/YACO "S"/4/CHIL "S'<br />
17 HAR2096 FUR Y -KEN/SLMI I ALDAN/41P ATOIIPAT2300/3IPVN<br />
18 HAR 1882 F6 74IBUN "S"IISIS "S"/3/THB "S"<br />
19 HAR2073 NDVG 9144 lIKALIBB/3/YACO "S"/4/CHIL<br />
20 HAR 2103 NESTOR<br />
21 HAR 1755 SUNBIRD 56 ROMANY BC<br />
22 HAR 1698 lAS 58/4lKALlBBCI "S"/31ALD "S"/5IBOW "s" (=TINAMOU)<br />
23 HAR 1861 BOW "S"INKT>"S"<br />
24 HAR 1864 URESIBOW 'S"<br />
25 HAR 1874 DOVE "S"IBOW "S"<br />
26 HAR3634 BOBWHITE<br />
27 HAR3635 CN079/4/CS/TH.CUIIGLEN/31ALD/PVN<br />
28 HAR3636 CHIR Y A.l Do.<br />
29 HAR3637 CS/TH.CUIIGLEN/3/ALD/PVN/4/SUZB<br />
30 HAR3639 ALDIPVNIIYMI #6<br />
31 HAR3640 lAS 20<br />
32 HAR 3641 KVZ/K4500.L.6.A.4<br />
33 HAR3642 GLENNSON M 81<br />
34 HAR 3638 EG-NH567.71114*EG-N3/2*CMH79.243<br />
35 KUBSA NDVG 9144 lIKALIBB/3/YACO "S"/4NEE "S"<br />
36 LAKETCH PJ "s" GB55<br />
176
Field response ofbread wheat genotypes to Septaria tritici blotch - Temesgen and Payne<br />
Table 2.<br />
Analysis of variance of percentage necrotic leaf area at Bekoji and<br />
Holetta, and combined analysis of variance across locations, 1998.<br />
'<br />
. " /;<br />
"<br />
',,' } .<br />
" .'<br />
"'"<br />
" ':. .<br />
: ,.:-, ,,,<br />
"<br />
, "" ,lJ~troji I " ''lIoJ~,(ta " ", ,''<br />
"'<br />
, "<br />
sourteo(:vatiatfon"<br />
; "<br />
'," ,',: :, c:lt ~" ::
Field response a/bread wheat genotypes to Septaria trifici blotch - Temesgen and Payne<br />
Table 3.<br />
Mean percentage necrotic leaf area of 36 bread wheat genotypes tested at<br />
Bekoji and HoJetta, 1998 for Septoria tritid blotch (Laketch = susceptible<br />
check).<br />
. CultivarlLine<br />
K6295-4A<br />
ET-13A2<br />
ENKOY<br />
MITlKE<br />
DASHEN<br />
WABE<br />
GALAMA<br />
MAGAL<br />
ABOLA<br />
TUSIE<br />
HAR 1706<br />
KATAR<br />
HAR 1875<br />
HAR 1868<br />
TURA<br />
HAR 1852<br />
HAR2096<br />
HAR 1882<br />
HAR2073<br />
HAR2103<br />
HAR 1755<br />
HAR 1698<br />
HAR 1861<br />
HAR 1864<br />
HAR 1874<br />
HAR 3634<br />
HAR 3635<br />
HAR3636<br />
HAR 3637<br />
HAR3639<br />
HAR 3640<br />
HAR 3641<br />
HAR3642<br />
HAR 3638<br />
KUBSA<br />
LAKETCH<br />
SE(m)±<br />
LSD (P=0.05)<br />
C.V.(%)<br />
-:... .<br />
Bekoji<br />
36.74<br />
22.49<br />
24.13<br />
11.52<br />
10.58<br />
77.29<br />
69.51<br />
92.95<br />
69.24<br />
26.78<br />
66.29<br />
73:05<br />
40.89<br />
91.94<br />
37.63<br />
44.52<br />
9.83<br />
14.29<br />
72.44 .<br />
51.04<br />
30.98<br />
17.72<br />
48.53<br />
26.84<br />
28.43<br />
34.23<br />
18.52<br />
26.41<br />
28.47<br />
17.43<br />
9.00<br />
. 23.44<br />
58.34<br />
5.48<br />
54.88<br />
47.84<br />
4.0<br />
11.6<br />
14.2<br />
lIoletta<br />
13.01<br />
29.49<br />
15.85<br />
16.12<br />
51.31<br />
99.95<br />
36.46<br />
97.94<br />
86.6<br />
17.22<br />
88.56<br />
25.85<br />
20.73<br />
12.57<br />
8.23<br />
24.84<br />
14.94<br />
17.58<br />
99.49<br />
62.62<br />
12.78<br />
5.75<br />
40.34<br />
40.98<br />
13.89<br />
12.47<br />
28.83<br />
22.45<br />
7.94<br />
17.58<br />
2.54<br />
3.27<br />
93.28<br />
10.15<br />
7.89<br />
100.0<br />
3.9<br />
11.4<br />
15.8<br />
Across location<br />
24.88<br />
25.99<br />
19.99<br />
13.82<br />
30.95<br />
88.62<br />
52.98<br />
95.45<br />
77.92<br />
22.00<br />
77.43<br />
49.45<br />
30.81<br />
52.25<br />
22.93<br />
34.68<br />
12.38<br />
15.93<br />
85.96<br />
56.83<br />
21.88<br />
11.73<br />
44.43<br />
33.91<br />
21.16<br />
23.35<br />
23.67<br />
24.43<br />
18.20<br />
17.50<br />
5.768<br />
13.36<br />
75.81<br />
7.81<br />
31.39<br />
74.16<br />
2.8<br />
7.9<br />
10.6<br />
178
Field response o/bread wheat genotypes to Septoria tritici blotch - Temesgen and Pay ne<br />
Table 4.<br />
Estimates of the regression and partial regression coefficients between<br />
percentage necrotic leaf area, and days to heading and plant height.<br />
Regression ~," -'" '" .:Partial regr.e~sion Std. err-orof<br />
'·Variable coe{fIcien't " Sla-nd~rd 'error coelficienf .. '. "partial coef.<br />
DH -1.69 0.70 -0.35* 0.15<br />
HT -1.04 0.38 -0.41** 0.15<br />
• SIgmficant at P=0.05 Intercept = 258.248<br />
.. Significant at P=O.O 1 Coefficient of Determination (r2) = 0.29<br />
Standard Error of regression = 22.403<br />
Table 5.<br />
Analysis of variance due to regression of percentage necrotic leaf area on<br />
days to heading and plant height.<br />
df<br />
Mean square<br />
Regression 2 3370.73*<br />
Residual 33 501.89<br />
Total 35<br />
. .<br />
SIgnIficant at P=O.OI<br />
Table 6.<br />
Bread wheat genotypes with superior resistance to STB assessed using<br />
percentage necrotic leaf area.<br />
Days to , HeiglIt ' .'. ·ST·B<br />
"<br />
,< ",<br />
CultivarlLine ,'<br />
'h'eadiiI~ (em) QPNLA3 EPNLA b ' '<br />
.'<br />
DRlBHc<br />
HAR 1882 66.00 93 .0 14.4 47.5 -1.5<br />
HAR 3638 69.00 96.5 7.15 38.7 -1.4<br />
HAR 3636 65 .50 88.0 25.5 53.6 -1.3<br />
ENKOY 63.75 96.5 20.6 47.5 -1.2<br />
HAR 3641 73.25 93.5 12.0 34.7 -1.0<br />
TUSIE 67.25 93 .0 23.3 45.3 -1.0<br />
HAR 1755 64.00 98.0 23.3 45 .5 -1.0<br />
HAR3634 68 .25 91.5 23.7 45.3 -1.0<br />
HAR2096 75.00 93.0 12.1 32.2 -0.9<br />
TURA 74.00 87.0 22.9 40.3 -0.8<br />
HAR 1698 76.75 92.0 13.2 30.3 -0.8<br />
MITIKE 65.75 110.0 14.4 29.8 -0.7<br />
HAR 1874 70.25 97.5 21.1 35.5 -0.6<br />
a Observed percentage necrotic leaf area<br />
b Expected percentage necrotic leaf area<br />
C Deviation from the regression of infection on heading and height<br />
179
Field response o/bread wheat genotypes to Septoria tritici blotch - Temesgen and Payne<br />
Table 7.<br />
Estimates of the regression and partial regression coefficients between<br />
relative coefficient of infection, and days to heading and plant height.<br />
. .<br />
. Regression , Standard" Pavt{al Reg~ ' . Std. Error. of<br />
., :'<br />
Variable ' Coefficient error Coefijcient. Parmll Coef.<br />
DH -l.61 0.6 -0.39** 0.15<br />
HT -0.80 0.3 -0.36* 0.15<br />
.. Significant at P:::; 0.01<br />
* Significant at P:::; 0.05<br />
Intercept = 228.92<br />
Coefficient of Determination (r2) = 0.281<br />
Standard Error of regression = 19.275<br />
Table 8.<br />
Analysis of variance due to regression of relative coefficient of infection<br />
on days to heading and plant height.<br />
df<br />
Mean Square<br />
Regression 2 2399.01 *<br />
Residual 33 37l.52<br />
Total 35<br />
* Significant at P:::; 0.01<br />
180
Field response ofbread wheat genotypes to Septoria tritici blotch - Temesgen and Payne<br />
Table 9.<br />
Bread wheat genotypes with superior resistance to STB assessed using<br />
double digit scale.<br />
.<br />
: " . , . ~ :<br />
"<br />
" i . ~ ". ' ~.<br />
:b~Y~Jo . :;-HeigHt<br />
~ , "<br />
.-STB<br />
CllltjvarfLfne ' lleadlu"fi ' i':¢ffl tl ' I) .. :'QRCIll ", : ' 1ilQXi;I b ' ,'<br />
,<br />
HAR 1755 64 98 17.36 47.48 -1.6<br />
HAR 3638 69 97 13.59 40.63 -1.5<br />
HAR 1882 66 93 22.74 48.26 -1.4<br />
TUSIE 67 93 20.83 46.25 -1.3<br />
TURA 74 87 14.93 40.18 -1.3<br />
MITlKE 66 110 12.5 35.06 -1.2<br />
ENKOY 64 97 29.86 49.08 -1.0<br />
HAR 1874 70 98 20.49 30.89 -0.9<br />
HAR 2096 75 93 17.75 33.77 -0.8<br />
HAR 1852 72 97 20.83 34.43 -0.7<br />
HAR 1698 77 92 18.32 31.75 -0.7<br />
HAR3634 68 . 92 32.39 45.84 -0.7<br />
HAR 3641 73 94 21.18 32.19 -0.6<br />
HAR 3636 66 88 43.75 53.07 -0.5<br />
K6295-4A 69 112 24.42 29.44 -0.3<br />
ET-13A2 73 102 26.39 29.79 -0.2<br />
HAR 1864 80 87 28.82 30.52 -0.1<br />
a Observed relative coefficient of infection. <br />
b Expected relative coefficient of infection. <br />
C Deviation from the regression of infection on heading and height. <br />
.><br />
,QRJiIHr:<br />
Table 10.<br />
Analysis of variance of the grain yield (kg/ha) at Bekoji and Holetta, and<br />
combined analysis of variance across locations, 1998.<br />
,BekQ.ii '<br />
Boletta '<br />
.-J.<br />
Source of Variati,on ,'>(if, " ;<br />
Mea,n.square<br />
Replications 1 198188 72279<br />
Genotypes<br />
- Unadjusted 35 5698394* 906708*<br />
- Adjusted 35 5704401* 889656*<br />
Blocks within Repsladj.) 10 121233 407564<br />
Error<br />
- Effective 25 80826 172190<br />
- RCB Design 35 86423 220348<br />
- Intrablock 25 72500 145463<br />
Efficiency. oflattice over RCBD (%) 6.9 28<br />
Combined analysis of variance across locations <br />
Source of variation df Mean Square <br />
Genotype 35 1881612* <br />
Environment 1 4783390* <br />
GxE 35 1415416* <br />
Pooled error 50 63254<br />
. Slgmficant at P=0.01<br />
181 <br />
"M~~an square
Field response o/bread wheat genotypes to Septoria tritici blotch - Temesgen and Payne<br />
Table 11.<br />
Mean grain yield (kg/ha) of 36 bread wheat genotypes at Bekoji, Holetta<br />
and across locations, 1998.<br />
CuItivarlLine <br />
K6295-4A <br />
ET-13A2 <br />
ENKOY <br />
MITIKE <br />
DASBEN <br />
WABE <br />
GALAMA <br />
MAGAL <br />
ABOLA <br />
TUSIE <br />
BAR 1706 <br />
KATAR <br />
BAR 1875 <br />
BAR 1868 <br />
TURA <br />
HAR 1852 <br />
HAR2096 <br />
HAR 1882 <br />
BAR 2073 <br />
BAR 2103 <br />
BAR 1755 <br />
BAR 1698 <br />
HAR 1861 <br />
HAR 1864 <br />
BAR 1874 <br />
HAR3634 <br />
HAR 3635 <br />
HAR 3636 <br />
HAR 3637 <br />
HAR 3639 <br />
HAR 3640 <br />
HAR3641 <br />
HAR3642 <br />
HAR 3638 <br />
KUBSA <br />
LAKETCH <br />
SE(m)± <br />
LSD (P=0.05) <br />
C.V.(%) <br />
B'ekoji <br />
3502 <br />
4444 <br />
4688 <br />
5599 <br />
330 <br />
626 <br />
273 <br />
1899 <br />
1930 <br />
3669 <br />
2192 <br />
1795 <br />
1057 <br />
2480 <br />
2819 <br />
845 <br />
3111 <br />
6191 <br />
507 <br />
1623 . <br />
5382 <br />
5041 <br />
380 <br />
2868 <br />
2749 <br />
1192 <br />
692 <br />
102 <br />
2691 <br />
2325 <br />
3580 <br />
3547 <br />
704 <br />
5247 <br />
3337 <br />
79 <br />
210.0<br />
585.5<br />
11.0<br />
· HQletta <br />
3782 <br />
2241 <br />
2055 <br />
3326 <br />
2499 <br />
3237 <br />
3189 <br />
2482 <br />
1879 <br />
3615 <br />
3030 <br />
4409 <br />
2943 <br />
3665 <br />
3049 <br />
3531 <br />
4388 <br />
3687 <br />
3014 <br />
2783 <br />
3486 <br />
3788 <br />
2962 <br />
3537 <br />
3156 <br />
3465 <br />
2985 " <br />
3136 <br />
2531 <br />
3186 <br />
2748 <br />
2173 <br />
3126 <br />
2906 <br />
4081 <br />
1357 <br />
293.4<br />
854.6<br />
13.4<br />
. Across' location<br />
3642 <br />
3343 <br />
3371 <br />
4463 <br />
1415 <br />
1932 <br />
2961 <br />
2190 <br />
1904 <br />
3642 <br />
2611 <br />
3102 <br />
2000 <br />
3073 <br />
2934 <br />
2188 <br />
3749 <br />
4939 <br />
1761 <br />
2203 <br />
4434 <br />
4415 <br />
1671 <br />
3203 <br />
2952 <br />
2329 <br />
1838 <br />
2076 <br />
2611 <br />
2755 <br />
3164 <br />
2860 <br />
1915 <br />
4076 <br />
3709 <br />
718 <br />
177.84<br />
501.60<br />
8.86<br />
182
IS IT NECESSARY TO APPLY INSECTICIDES <br />
TO RUSSIAN WHEAT APHID RESISTANT CULTIVARS? <br />
Vicki Tolmay and Rihanle Mare <br />
Agricultural Research Council- Small Grain Institute, Private Bag X29, <br />
Bethlehem, Free State Province, 9700, South Africa <br />
ABSTRACT<br />
<strong>Wheat</strong> cultivars resistant to Russian wheat aphid (Diuraphis noxia) have been<br />
available to farmers in the Free State Province of South Africa since 1992.<br />
Resistance conferred by the genes Dnl and Dn2 is known to reduce the<br />
percentage of tillers infested with aphids as well as lower the number of<br />
Russian wheat aphids per infested tiller. In addition, a dramatic increase in<br />
yield is associated with this "resistance when these cultivars are compared to<br />
susceptible wheat lines. Since aphids still occur on these cultivars, producers<br />
often ask whether it would be possible to increase yields further by applying<br />
insecticide to control the remaining aphids. Trials have shown that it is indeed<br />
possible to increase grain yields, using insecticides, but that these increases are<br />
not always economically justifiable: the combined cost of insecticide and its<br />
application are not always recovered. Factors such as Russian wheat aphid<br />
infestation level, and input cost rela!ive to the grain market price are important<br />
profit determinants.<br />
INTRODUCTION<br />
<strong>The</strong> Russian wheat aphid (RWA) (Diuraphis noxia (Kurdjumov)) has had a major impact on<br />
the South African wheat industry since the early 1980's. South Africa annually produces 1.5<br />
to 2 MT of wheat, most of which is produced in the SUITlmer rainfall region of the Free State<br />
where D. noxia is a serious pest of wheat. Symptoms of D. noxia infestation on susceptible<br />
plants are distinct white, yellow and purple to reddish-purple longitudinal streaks and severe<br />
rolling of the leaves of infested plants (Walters et al., 1980). <strong>The</strong> aphids are found mainly on<br />
the adaxial surface of the newest growth, in the axils of leaves or within rolled leaves. Tillers<br />
of young plants become prostrate under heavy infestations and at later growth stages heads<br />
become trapped in the rolled flag leaf. Apart from causing substantial yield losses, RWA has<br />
also prevented the planting of late-winter, intermediate and spring wheat in this region of<br />
South Africa (Du Toit and Walters, 1984; Du Toit, 1992). D. noxia infestation leads to a<br />
reduction in chlorophyll content (Kruger and Hewitt, 1984) which, when combined with leaf<br />
rolling, causes a considerable loss of effective leaf area on susceptible plants (Walters et al.,<br />
1980). Burd and Burton (1992) showed that RWA infestation resulted in water imbalances in<br />
the host plant, expressed as loss of turgor and reduced growth leading to substantial<br />
reductions in biomass. It is therefore not surprising that farmers view the small populations of<br />
RWA on resistant cultivars with much suspicion and often ask whether it would not be<br />
possible to increase the yields further by insecticide control of the remaining aphids. This<br />
paper discusses whether it is justified to apply insecticides to RWA resistant wheat cultivars.<br />
183
Necessary to app~y insecticides to Russian wheat aphid resistant cultivars? - To/may and Mare <br />
MATERlALS AND METHODS <br />
<strong>The</strong> RW A resistant winter wheat cultivar Gariep, which contains the resistance gene Dnl,<br />
was field tested near Bethlehem, Free State Province, South Africa, with and without<br />
insecticides, from 1994-1998 in a split-plot design with five replications. Insecticide<br />
treatments included an Imidacloprid WS seed-dressing (Gaucho®, 140 g ai per 100 kg seed);<br />
a foliar spray of a Demeton-S-Methyl EC / Parathion EC mixture (125g ai ha- 1 + 325g ai ha- 1 ,<br />
respectively) at Zadoks GS 30; and a combination of both treatments. Yield and hectoliter<br />
mass (HLM), which determine grade and price, were used to calculate the benefit of the<br />
insecticide treatment using the cost of insecticides and wheat prices for the 1998 season. <strong>The</strong><br />
cost of a Gaucho® seed dressing was calculated at R 114.00 ha- i and that of the foliar spray<br />
at R 214.00 ha- I .<br />
RESULTS<br />
<strong>The</strong> yield potential varied from year to year with the highest yield being obtained in the 1996<br />
season and the lowest in 1994 (Table I). Yield and hectoliter mass are shown as they<br />
determine the income per hectare fwm each particular treatment. In 1995 the low hectoliter<br />
mass resulted in downgrading of the crop and a lower price per ton. <strong>The</strong> use of a Gaucho®<br />
seed dressing on Gariep led to a decrease in yield in all five years that the trial was<br />
conducted. <strong>The</strong> application of the foliar spray of a Demeton-S-Methyl EClParathion EC<br />
mixture (125g ai ha- 1 + 325g ai ha- I , respectively) at Zadoks GS 30 lead to an increase in<br />
yield in three of the five years (1995, 1996 and 1997) and a decrease in the other two years.<br />
In all five years, the application of both seed , dressing and foliar spray resulted in yield<br />
increase. Despite higher yields obtained f~om some insecticide treatments, the cost of the<br />
insecticide was never recovered from the increase in yield and there was no benefit<br />
whatsoever in controlling RWA with insecticides on Gariep.<br />
DISCUSSION AND CONCLUSIONS<br />
<strong>The</strong> data from this trial indicate that insecticide treatment on resistant Gariep is not economically<br />
justifiable as the cost of the insecticide and application there9fwas not recovered. <strong>The</strong> decline in<br />
yield associated with insecticidal seed-dressing seems incongruous. This can possibly be<br />
explained by a delay in the induction of the R W A resistance reaction caused by R W A feeding<br />
due to the fad that the plant is kept aphid free until a later and possibly more sensitive life stage.<br />
Van der Westhuisen and Pretorius (1995) showed that biochemical and physiological changes<br />
are induced in resistant Tugela-DN, containing gene Dnl, by RWA feeding. Resistant plants<br />
were able to retain a steady level of chlorophyll content in contrast to the dramatic reduction<br />
characteristic of infected, susceptible plants. During the time needed for the resistance reaction<br />
to be 'switched on', damage may occur.<br />
<strong>The</strong> yield loss of Gariep associated with insecticide treatment is in direct contrast to the findings<br />
of van der Westhuizen and Lampbrechts (2000). <strong>The</strong>y conducted trials over three years in the<br />
Bethlehem and Reitz districts of the <strong>Eastern</strong> Free State, South Africa with the RWA resistant<br />
cultivar SST 363 (resistance donor PI 294994). An average increase of 521 kg ha- i was reported<br />
when seed-dressing was applied (Table 2) and it was concluded that the use of Gaucho® on this<br />
cultivar was an economically justifiable practice. Tolmay et al. (1997) also found a significant<br />
increase in yield when the resistant cultivar Gamtoos-DN, with the Dnl gene, was treated with<br />
imidacloprid. <strong>The</strong> question that needs to be answered is one of economics and in instances<br />
where insecticide treatment increases yield, is the cost of the insecticide relative to the income<br />
184
Necessary to apply insecticides to Russian wheat aphid resistant cultivars? - Tolmay and Mare<br />
the producer receives per hectare. In addition to fluctuating wheat prices and ever increasing<br />
input costs another variable that influences the yield of resistant cultivars is the RW A infestation<br />
level in the particular field. This is unfortunately a very unpredictable variable and the only way<br />
farmers can determine the level of RWA infestation in their fields is by means of regular field<br />
scouting.<br />
Contradictory findings such as the results presented here make it difficult to give a general<br />
answer to the question of whether it is necessary to apply insecticides to R W A resistant<br />
cultivars. It must be remembered that genetic resistance to a pest is a relative phenomenon and<br />
that the expression of a resistance gene will differ in different genetic backgrounds. <strong>The</strong>refore all<br />
resistant lines cannot and do not possess the same level of resistance. Despite this and the<br />
variable influence of unpredictable RWA infestation levels, the benefit of using resistant<br />
cuItivars to control insect pests such as the Russian wheat aphid is high, as farmers purchase<br />
insect control "inside" the seed they buy. Resistant cultivars offer a dramatic increase in yield<br />
compared to susceptible cuItivars (Maras as et al., 1997). <strong>The</strong> host plant resistance works<br />
throughout the season and therefore complex decisions such as choosing an insecticide,<br />
determining the correct dosage, calibrating sprayers and timing the spray application to<br />
ensure safe and effective control are-not a problem.<br />
Trials to determine the efficacy of genetic resistance compared to insecticide control are both<br />
time consuming and expensive and it is impractical to attempt to collect data for each of the ever<br />
growing number of RW A resistant cuItivars that becomes available in the market. <strong>The</strong> solution<br />
to this dilemma probably lies in the characterization of the level of resistance in the resistant<br />
cuItivars. A field study is presently underway , to rank resistant cultivars by their level of<br />
resistance expression and it is hoped that this data will answer many of the questions being<br />
asked.<br />
'<br />
REFERENCES<br />
Burd, J,D. and R.L. Burton. 1992. Characterization of plant damage caused by Russian wheat aphid<br />
(Homoptera: Aphididae). J Econ. Entomol. 85: 2017-2022.<br />
Du Toit, F. and M.e. Walters, 1984. Damage assessment and economic threshold values for the chemical<br />
control of the Russian wheat aphid Diuraphis noxia (Mordvilko) on winter wheat. In: Progress in<br />
Russian wheat aphid (Diuraphis noxia Mord .) research in the Republic of South Afric:l. Proceedings of<br />
a meeting of the Russian Aphid Task Team held at the University of the Orange Free State,<br />
Bloemfontein 5-6 May 1982. Walters, M.e. (ed.). Technical Communication No 191, Department of<br />
Agriculture, Republic of South Africa.<br />
Du Toit, F. 1992. Russian wheat aphid resistance in a wheat line from the Caspian Sea area. Cer. Res. Comm.<br />
21: 55-6\.<br />
Kruger, G.HJ. and P.H. Hewitt. 1984. <strong>The</strong> effect of Russian wheat aphid (Diuraphis noxia) extract on<br />
photosynthesis of isolated chloroplasts: Preliminary studies. In: Progress in Russian wheat aphid<br />
(Diuraphis noxia Mord.) research in the Republic of South Africa. Proceedings ofa meeting of the<br />
Russian Aphid Task Team held at the University of the Orange Free State, Bloemfontein 5-6 May<br />
1982. Walters, M.e. (ed.). Technical Communication No 191, Department ofAgriculture, Republic of<br />
South Africa.<br />
Marasas, e., Anandajayasekeram, P., Tolmay, V.L., Martella, D., Purchase, J.L. and GJ. Prinsloo. 1997. Socioeconomic<br />
impact of the Russian wheat aphid control research program. SACCARJARC Report,<br />
SACCAR, Gaberone, Botswana. 147 pp.<br />
Tolmay, V.L., van Lill, D. and Smith, M.F. 1997. <strong>The</strong> influence of Demeton-S-MethyI!Parathion and<br />
Imidacloprid on the yield and quality of Russian wheat aphid resistant and susceptible wheat cultivars.<br />
S.A.J Plant & Soil 14(3): 107-111.<br />
Van der Westhuisen, AJ. and Z. Pretorius. 1995. Biochemical and physiological responses of resistant and<br />
susceptible wheat to Russian wheat aphid infestation. Cer. Res. Comm. 23(3): 305-313.<br />
185
Necessary to apply insecticides to Russian wheat aphid resistant cultivars? - Tolmay and Mare<br />
Van der Westhuizen, M.e. and N. Lampbrechts. 2000. Russiese luis op koring- 'n ander perspektief.<br />
Koringfokus 18(3): 18 (in Afrikaans).<br />
Walters, M.e., Penn, F., Du Toit, F. Botha, T.e ., Aalbersberg, YK., Hewitt, P.H. and S.W. Broodryk. 1980.<br />
<strong>The</strong> Russian wheat aphid. Fanning in South Africa, Leaflet Series. <strong>Wheat</strong>, G6.<br />
Questions and Answers:<br />
J.D. <strong>The</strong>unissen: Is there a difference in standard resistance between xylem and phloem as<br />
represented in the EPG graph?<br />
Answer: <strong>The</strong> different waveforms seen in the electro-penetration graph (EPG) are generated<br />
by impedance in the electrical circuit. Xylem and phloem give different wavefonns with<br />
different frequencies, but the frequencies shown in the xylem and phloem are more related to<br />
the ingestion of plant sap by the aphid than to the structure of the vascular tissue, although<br />
this does have an influence.<br />
Colin Wellings: You suggested that you can identify several genes for resistance, based on<br />
phenotype. Have you been able to confirm this by genetic analysis and do you have strategies<br />
for combining genes?<br />
Answer: <strong>The</strong> genes cannot be distinguished phenotypically; the information we have is based<br />
on inheritance of resistance and allelic studies. Combining genes without being able to mark<br />
them is difficult and can only be confirmed by test crossing which is a long and tedious<br />
process. We are combining genes but will only use the test cross method of confirmation on<br />
lines to be released as we do not have the capacity to do test crosses in the breeding process.<br />
Harjit Singh: In the absence of biotypes, molecular markers may be useful to pyramid<br />
different genes for resistance. Have you tried any molecular markers for this purpose?<br />
Answer: Yes, we have tried microsatellite markers + RAPD PCR markers but we face the<br />
problem of background effect while using these in breeding materials. Some preliminary<br />
markers have been identified, but none are as yet being used in our program.<br />
Temam Hussien: What is the source of resistance ofyour materials?<br />
Answer: Resistance originates from Iran, Iraq, Afghanistan, Bulgaria and other countries in<br />
this region. A lot of the resistance is in bread wheat T. aestivum.<br />
Ravi P. Singh: What is the role ofseed treatment using systemic insecticides in RWA<br />
control?<br />
Answer: Seed treatment (Gaucho® and Cruiser®) is very effective for RW A control on<br />
intermediate and spring types of wheat. Both insecticides keep plants (resistant or<br />
susceptible) clean of aphids but input costs are not always recovered on resistant cultivars.<br />
Using seed-dressing on winter wheat, planted early in the season, is also not advisable as the<br />
effect of the insecticide is only for a limited time span and it may be that the aphids only<br />
infest the crop after the seed-dressing has stopped working.<br />
Mohamed Salih Mohamed: Could resistance genes to Russian <strong>Wheat</strong> Aphids be effective<br />
against other aphid species, e.g., green bug or black bug?<br />
186
Necessary to apply insecticides to Russian wheat aphid resistant cultivars? - Tolmay and Mare<br />
Answer: Unfortunately not. <strong>The</strong> R W A resistance only works against RW A. Some resistance<br />
to other aphids particularly S. graminum and to R. padi (i.e., wheat with high hydroxamic<br />
acid) is available.<br />
Hussien Mansoor: Have you observed the effects ofherbicides on the introduced predators?<br />
Answer: No, this is work that still needs to be done, and is probably of importance as weeds<br />
may act as refugia for natural enemies ofthe R W A.<br />
M. Kinyua: Was there a test ofsignificance of differences in yield between treated and<br />
untreated?<br />
Answer: Yes, an ANOYA was done and it was found that there is a significant difference<br />
between the yield of treated and untreated (control) plots; the control giving significantly<br />
higher yield.<br />
M. Kinyua: Why the consideration about the switch-on mechanism, since there was control<br />
of aphids by the chemicals?<br />
Answer: On Gaucho-treated wheat, RWA did infest the wheat later in the season. <strong>The</strong> wheat<br />
was not kept RWA-free for the whole growing season. After infection, Gaucho-treate.d wheat<br />
gave a lower yield than untreated Gariep.<br />
Ravi P. Singh: Does Gaucho have any infl~ence on plant growth in the absence of RWA?<br />
Answer: No, not a negative effect. Gaucho actually stimulates growth and in total absence of<br />
R W A it has a positive effect on yield, not necessarily a significant effect.<br />
M.A. Mahir: Is it possible that Gaucho has no effect on controlling RWA because it has a<br />
short persistence and by the time the RWA appears it was gone?<br />
Answer: Gaucho is effective for around 100 days. During this time, the control treatment (no<br />
chern. control) will be infested by aphids, but plants treated with Gaucho will be clean. After<br />
this protected period, plants treated with Gaucho also become infected with R W A - possibly<br />
too late to switch on the resistance gene.<br />
187
Necessary to apply insecticides to Russian wheat aphid resistant cultivars? - Tolmay and Mare<br />
Table 1. Yield (t/ha), hectoliter mass (kg/hi) and benefit of insecticide control of RWA using an imidacloprid WS seed-dressing<br />
(Gaucho®, 140 g ai per 100 kg seed), a foliar spray of a demeton-S-methyl EC I Parathion EC mixture (125 g ai ha- l + 325<br />
g ai ha- 1 ) at Zadoks GS 30 and a combination of both on the resistant cultivar wheat Gariep.<br />
•<br />
.. .."<br />
'<br />
Difference Benefit of control<br />
..<br />
<strong>Wheat</strong> . '. , . .<br />
~n i~c'ome (difference q\,<br />
/ =><br />
" Yield laM Price # income' compared to income - ·.control<br />
Year Treatment ' (tlha) (kWhI) (ZAR*lton) (ZARJba) . Gariep alone cost) . .<br />
1994 GarieQ 1.681 76.0 837.25 1407.42<br />
Gariep + Gaucho® 1.565 76.7 837.25 1310.30 -97.12 -211.12<br />
Gariep + Spray 1.620 75.7 824,50 1335.69 -71.73 -285.73<br />
Gariep + Gaucho® + Spray 2.026 78.2 837.25 1696.27 288.85 -39.l5<br />
--<br />
1995 Gariep 2.323 72.1 550.00 1277.65<br />
--<br />
Gariep + Gaucho® 2.255 72.3 550.00 . 1240.25 -37.40 -151.4<br />
Gariep + Spray 2.607 71.6 550.00 1433.85 156.20 -57.8<br />
Gariep + Gaucho® + Spray 2.809 72.4 550.00 1544.95 267.30 -60.7<br />
1996 Gariep 2.805 76.2 837.25 2348.49<br />
Gariep + Gaucho® 2.589 75.3 824.50 2134.63 -213.86 -327.86<br />
Gariep + Spray 2.471 74.9 824.50 2037.34 -311.15 -525.15<br />
Gariep + Gaucho® + Spray 2.534 75.2 824.50 2089.28 -259.20 -587.2<br />
1997 Gariep 2.155 74.8 824.50 1776.80 <br />
Gariep + Gaucho® 1.982 74.5 824.50 1634.16 -142.64 -256.64 <br />
Gariep + Spr'!y 2.203 74.7 824.50 1816.37 39.58 -174.42 <br />
Gariep + Gaucho® + Spray 2.351 74.8 824.50 1938.40 161.60 -166.4 <br />
1998 Gariep 2.403 79.1 850.00 2042.55<br />
Gariep + Gaucho® 2.252 79.8 850.00 1914.20 -128.35 -242.35<br />
Gariep + Spray 1.924 79.9 850.00 1635.40 -407.15 -621.15<br />
Gariep + Gaucho® + Spray 2.428 79.7 850.00 2063.80 21.25 -306.75<br />
# <strong>Wheat</strong> price and control costs as for 1998 season.<br />
* One US$ = ± ZAR 6.1 (South African Rand).<br />
188<br />
"
Necessary to apply insecticides to Russian wheat aphid resistant cultivars? - Tolmay and Mare<br />
Table 2.<br />
Yield of RW A resistant SST 363 with and without an imidacloprid WS<br />
seed-dressing (Gaucho®, 140 g ai per 100 kg seed) in Bethlehem and Reitz<br />
from 1996-1998 (from Van der Westhuizen and Lamprechts, 2000.<br />
Reproduced with permission of the authors).<br />
. .' . . r ; " . ';".~ ~; .\' '''." "'Yield,Bethiehem' , YieldRei~<br />
. "'"'' ,t,.,<br />
. ~. , ..: .'"<br />
.:~'<br />
Year' ~ ." ,\. , " , €tIh~) i: " .' ":" .' .,: (f}ti'ir) ,<br />
1996 SST 363 2.882 3.834<br />
SST363 + Gaucho® 3.366 4.333<br />
1997 SST 363 2.250 2.206<br />
SST363 + Gaucho 2.701 2.817<br />
1998 SST 363 2.792 1.628<br />
SST363 + Gaucho 3.466 2.040<br />
189
RUSSIAN WHEAT APHID RESISTANT WHEAT CULTIVARS <br />
AS TREMAIN COMPONENT OF AN INTEGRATED CONTROL PROGRAM <br />
Vicki Tolmay, Goddy Prinsloo and Justin Hatting <br />
Small Grain Institute (ARC), Private Bag X29, Bethlehem, <br />
Free State Province, 9700; South Africa <br />
ABSTRACT<br />
In 1978, when Russian wheat aphid was first recorded on wheat in the Free<br />
State Province of South Africa, little information regarding the control of this<br />
devastating pest was available. Large-scale use of insecticides was the order of<br />
the day for many years, but now, after concerted research efforts, farmers are<br />
planting resistant cultivars to control this pest. <strong>The</strong> question is whether these<br />
cultivars will provide durable control of Russian wheat aphid. This paper<br />
discusses strategies and methods that are being used in breeding for durable<br />
resistance. In addition to host plant resistance, other control options, such as<br />
biological control using natural enemies like parasitoids and predators as well<br />
as entomopathogenic fungi, are being explored in order to integrate them with<br />
resistant cultivars to provide an effective and environmentally sound<br />
integrated control program for this pest.<br />
INTRODUCTION<br />
<strong>The</strong> Russian wheat aphid (RWA), Diuraphis noxia, is the most economically important pest<br />
of wheat produced under dryland conditions in the summer rainfall region of South Africa,<br />
causing extensive damage annually (Du Toit, 1992). <strong>The</strong> RWA, a small grey-green aphid,<br />
feeds on the adaxial surface of young leaves. Salivary toxins injected into the plant as the<br />
aphid feeds cause the degeneration of plant membranes and chloroplasts resulting in<br />
longitudinal yellow and whitish streaks on the leaves. Aphid feeding also causes the leaves to<br />
roll closed providing the aphid with a safe environment, protected from desiccation, natural<br />
enemies and insecticidal contact sprays. Damage to wheat crops can be limited by the use of<br />
systemic insecticides, but the cost can be prohibitive especially where harsh climatic<br />
conditions reduce the efficacy of the insecticides (Du Toit, 1988; 1992). World-wide the use<br />
of insect-resistant cultivars is seen as one of the most desirable alternatives to insecticides<br />
because of their low cost and environmentally friendly action (Burton et at., 1991;<br />
Quisenberry and Schotzko, 1994).<br />
In South Africa, RW A resistant cultivars have been developed through a concerted research<br />
effort and are now a key component of an integrated control strategy against R WAin both<br />
commercial and small-scale production situations. To prevent yield losses, RWA populations<br />
must be maintained under the economic threshold level through manipulation of the agroecosystem<br />
and the use of available pest control options. Resistant cultivars dramatically<br />
reduce the number of aphids present in the field by inhibiting aphid growth and reproduction<br />
(Tolmay and Mare, 2000). <strong>The</strong> presence of natural enemies in the field further contributes to<br />
the control of aphids by preventing the rapid increase of RWA when conditions become<br />
190
Integrated control using Russian wheat aphid resistant wheat cultivars - Tolmay et a1.<br />
favorable. In this way RWA are prevented from reaching economically damaging populations<br />
thereby avoiding the necessity for curative insecticide applications.<br />
MATERIALS AND M.ETHODS<br />
<strong>The</strong> approach to controlling RW A in South Africa is to use host plant resistance in the form<br />
of resistant wheat cultivars to dramatically reduce RWA populations in the field. Natural<br />
enemies including predators, parasitoids and entomopathogenic fungi control the remaining<br />
aphids. In circumstances where RWA populations become very large, insecticidal application<br />
is used as a curative measure. A short description of each component included in the<br />
integrated R W A control program follows.<br />
Russian wheat aphid resistant cuItivars<br />
Resistance to RWA in Triticum aestivum was first identified by Du Toit (1987), and RWA<br />
resistance genes have since been transferred to commercial wheat cultivars through a<br />
backcrossing program at the Small Grain Institute (SGI) (Small Grain Institute Technology<br />
Report, 1996). <strong>The</strong> first RW A resisr.mt wheat cultivar was released in South Africa in 1992.<br />
At present there are 15 RW A resistant cultivars available to control this aphid in the Free<br />
State Province. Different sources of resistance were used during the development of these<br />
cultivars and although no exact data are available it is possible that as many as four or five<br />
different resistance genes may be employed. It is estimated that these cultivars are planted on<br />
more than 70% of the wheat producing area. Acceptable yields have been obtained from<br />
these cultivars (Marasas et al., 1997). A number of different sources of plant resistance to<br />
RW A have been reported in bread wheat (Harvey and Martin, 1990; Quick et al., 1991; Smith<br />
et al., 1991; Souza et al., 1991; Baker et al., 1992; Du Toit, 1992; <strong>For</strong>musoh et al., 1992; Porter<br />
et al., 1993). Initially, five sources of resistance were used by the Small Grain Institute;<br />
namely PI 137739, PI 262660, PI 294994, Aus 22498 and CItr 2401. Backcross breeding was<br />
used to transfer this resistance into eight well adapted South African cultivars; namely<br />
'Tugela', 'Betta', 'Molopo', 'Karee', 'Kariega', 'Letaba', 'Molen' and 'Palmiet'. During the<br />
backcross breeding process, plants were screened for resistance to RWA in a greenhouse<br />
bioassay. Though a tedious method, screening plants using live aphids has proven to be a<br />
reliable technique to identify resistant plants and will be used until such time as reliable<br />
genetic markers become available to assist selection of plants containing the resistance<br />
gene(s). <strong>The</strong> presence of resistance in the cultivars leads to a reduction in both the percentage<br />
of infested tillers and the number of RWA per infested tiller. Furthermore the leaves of the<br />
resistant cultivars do not roll closed, leaving RWA exposed on the leaf surface. This<br />
characteristic makes it possible to use natural enemies of the RW A to support the resistant<br />
cultivars.<br />
Natural enemies<br />
Natural enemies of R W A are used to support the resistant cultivars. <strong>The</strong> small popUlations of<br />
RWA on resistant cultivars seldom cause economic damage but natural enemy control of<br />
these aphids protects the resistance genes in the cultivars by reducing the possibility of a<br />
resistance breaking biotype of the aphid occurring. Seven species of ladybird predators, four<br />
species of parasitic wasps, one species of predatory fly, two species of hemipteran predators<br />
and six species of entomopathogenic fungi are known to be natural enemies of cereal aphids ·<br />
in South Africa (Aalbersberg et al., 1988; Hatting et al., 1999; Hatting et al., 2000; Prinsloo,<br />
unpublished data).<br />
191
Integrated control using Russian wheat aphid resistant wheat cultivars - Tolmay et al.<br />
One parasitic wasp, Aphelinus hordei, was introduced to South Africa from the Ukraine in<br />
1991. <strong>The</strong> adult parasite is approximately Inun in length and black in color with yellow legs.<br />
After mating, the wasp female lays an egg inside an aphid. <strong>The</strong> larva feed on the internal<br />
organs of the aphid resulting in the aphids' death. <strong>The</strong> larvae secrete a substance that hardens<br />
the aphids' skin turning it black in color. This blackened aphid is called a mummy and a few<br />
days after the mummy is fonned, an adult parasitoid emerges from it. Each female wasp is<br />
able to lay in excess of one hundred eggs during her adult life of about ten days. A. hordei<br />
enters a resting stage similar to hibernation from April to August each year.<br />
Of the six entomopathogenic fungal species known to infect cereal aphids under field<br />
conditions in South Africa the entomopathoralean Pandora neoaphidis is considered the most<br />
important. <strong>The</strong> spores of fungal pathogens coming into contact with an aphid will genninate<br />
under favorable conditions, penetrate the aphid and cause disease. Diseased aphids become<br />
sluggish, stop feeding and die within two to five days. Fungal growth covers the aphid<br />
cadaver giving it a puffed brick-brown or white appearance (depending on fungal species).<br />
<strong>The</strong> fungus then produces spores, which may come into contact with other aphids in the<br />
vicinity to again cause infection, disease and ultimately death. <strong>The</strong> spores of certain fungal<br />
species can be mass produced and fonnulated to produce a myco-insecticide. Presently two<br />
indigenous fungal species are being evaluated at the SGI for use as myco-insecticides against<br />
cereal aphids.<br />
Chemical Control<br />
Insecticide application for the control of RWA is predominantly used on susceptible<br />
cultivars. More than 15 insecticides are regIstered for the control of Russian wheat aphid in<br />
South Africa, however, application of these products could influence natural enemies of<br />
R W A and should therefore be undertaken with care.<br />
DISCUSSION AND CONCLUSION<br />
Six of the 15 RW A resistant cultivars presently available ~o producers were developed at the<br />
Small Grain Institute. <strong>The</strong> challenge facing breeders now is to ensure that the resistance<br />
incorporated into these and other new cultivars is durable. <strong>The</strong> use of additional control<br />
methods in the field such as natural enemies, the promotion of non-season hosts to support<br />
natural enemy populations and judicious use of insecticides such as seed treatments on<br />
susceptible cultivars assist in achieving this goal. <strong>The</strong> diverse nature of the South African<br />
wheat production region lends itself to the use of different resistance genes in different<br />
cultivars. With 19 different cultivars to chose from, 15 with RW A resistance and a possible<br />
four to five different RWA resistance genes in use, a patchwork effect is created and it is<br />
unlikely that continuous large tracts of cultivars with the same resistance gene will occur.<br />
This should reduce the potential for the development of a resistance breaking biotype of the<br />
RWA.<br />
Another strategy is the combining of different resistance genes in the same cultivar. This<br />
challenge is more difficult because it is not possible to differentiate between RW A resistance<br />
sources/genes using phenotypic symptoms. Identifying plants with more than one gene is also<br />
very difficult. In order to overcome this problem studies have been undertaken to identify the<br />
mechanisms of resistance in specific donor lines so that they can be used to characterize the<br />
resistance; the assumption being that different mechanisms will be expressed by different<br />
192
Integrated control using Russian wheat aphid resistant wheat cultivars - Tolmay et at.<br />
genes. Contrasting mechanisms include antibiosis (the negative influence of the host plant on<br />
the biology of the pest), antixenosis (the non-preference of the aphid for a particular host<br />
plant) and tolerance (the plants ability to withstand infestation without being damaged). All<br />
three mechanisms have been observed in our gennplasm (Tolmay et al., 1999) but no<br />
correlation has been observed between field observations and greenhouse mechanism trials.<br />
Usually more than one mechanism is present in a resistant genotype, e.g., antibiosis and<br />
antixenosis, and thus the reaction of a gene likely depends on the genetic background.<br />
In the search for an indicator with which to differentiate between resistance genes, feeding<br />
behavior studies of Russian wheat aphids on different resistance lines have been initiated.<br />
With this technique it is possible to identify modifications in feeding behavior caused by<br />
resistant lines. Different genes should be uniquely expressed and it may therefore be possible<br />
to identify lines that contain more than one resistance gene or have a superior resistance<br />
reaction <strong>The</strong>se studies are still in a preliminary stage but seem to show potential, as dramatic<br />
differences occur between lines. Whether these differences will translate into useable<br />
indicators for selection in the breeding program, however, remains to be seen.<br />
<strong>The</strong> influence of host plant resistance on natural enemies is another aspect that is receiving<br />
attention as it is well documented that the efficacy of parasitoids and predators can be<br />
influenced by the host plant of the aphid (Price et at., 1980). During the first experimental<br />
release of A. hordei in commercial wheat fields in 1994, about 50% of the RWA in these<br />
fields were found to be parasitized. In January 1995, parasitoids were found more than 30 km<br />
away from the initial release sites. During 1996, further releases were made in the Bethlehem,<br />
Ficksburg and Ladybrand districts, where parasitism of up to 72% were recorded. To date,<br />
more than three million parasitoids have been released. Surveys in Lesotho during 1999 and<br />
2000 have shown that this parasitoid now occurs on cultivated wheat in the Highlands more<br />
than 200km from the nearest release site (Prinsloo, unpublished data). Data from trials<br />
perfonned at the Small Grain Institute to test A. hordei parasitism levels of RWA on<br />
susceptible 'Betta' and the resistant cultivars 'Betta-ON' and 'SST333' showed that RWA<br />
populations were 50% lower on the resistant cultivars than on the susceptible in the absence<br />
of parasitoids. In the presence of parasitoids and resistant cultivars, the RWA population<br />
declined by a further 50% (Prinsloo et at., 1995) and no ,negative effect of the host plant on<br />
this parasitoid was observed.<br />
<strong>The</strong> future of the integrated control program for RW A in South Africa is dynamic and it will<br />
likely change in the years to come as more natural enemies are imported from the provenance<br />
of the RWA. Cultivars with other resistance genes, higher yields and better quality<br />
characteristics are likely to be released and will be incorporated into the integrated control<br />
program. <strong>The</strong>re is however no doubt that the effective control of this pest with an<br />
environmentally sound and economically viable program will contribute to the sustainable<br />
production of wheat in South Africa, to the benefit of all.<br />
REFERENCES<br />
Aalbersberg, Y.K., van der Westhuizen, M.e. and P.H. Hewitt. 1988. Natural enemies and their impact on<br />
Diuraphis noxia (Mordivilko) (Hemiptera: Aphididae) popUlations. Bull. Ent. Res. 78:111-120.<br />
Baker, C.A., Webster, J.A. and D.R. Porter. 1992. Characterization of Russian wheat aphid resistance in a hard<br />
white spring wheat. Crop Sci. 32(6): 1442-1446.<br />
Burton, R.L., Porter, D.R., Baker, C.A., Webster, J.A., Burd, J.D. and G.J. Puterka. 1991. Development of<br />
aphid-resistant gennplasm. In: <strong>Wheat</strong> for the Non-traditional, Warm Areas. Saunders, D.A. (ed.).<br />
CIMMYT: Mexico, DF.<br />
193
Integrated control using Russian wheat aphid resistant wheat cultivars - Tolmay et al.<br />
Du Toit, F. 1987. Resistance in wheat (Triticum aestivum) to Diuraphis noxia (Hemipwra: Aphididae). Cer.<br />
Res. Comm. 15: 175-179.<br />
Du Toit, F. 1988. Another source of Russian wheat aphid (Diuraphis noxia) resistance in Triticum aestivum.<br />
Cer. Res. Comm. 16:105-106.<br />
Du Toit, F. 1992. Russian wheat aphid resistance in a wheat line from the Caspian Sea area. Cer. Res. Comm.<br />
21 :55-61.<br />
<strong>For</strong>musoh, E.S., Wilde, G.E., Hatchett, lH. and R.D. Collins. 1992. Resistance to Russian wheat aphid<br />
(Homoptera: Aphididae) in Tunisian wheats. Journal ofEconomic Entomology 85(6): 2505-2509.<br />
Harvey, T.L. and TJ. Martin. 1990. Resistance to Russian wheat aphid, Diuraphis noxia, in wheat, (Triticum<br />
aestivum). Cer. Res. Comm. 18(1-2): 127-129.<br />
Hatting, l.L., Humber, R.A., Poprawski, TJ. and R.M. Miller. 1999. A survey of fungal pathogens of aphids<br />
from South Africa, with special reference to cereal aphids. Biological Con lro I 16: 1-12.<br />
Hatting, lL., Poprawski, TJ. and R.M. Miller. 2000. Prevalence of fungal pathogens and other natural enemies<br />
of cereal aphids (Homoptera: Aphididae) in wheat under dry land and irrigated conditions in South<br />
Africa. BiocontroI45(2): 179-199.<br />
Marasas, C., Anandajayasekeram, P., Tolmay, V.L. , Martella, D., Purchase, lL. and GJ. Prinsloo. 1997. Socioeconomic<br />
impact of the Russian wheat aphid control research program. SACCARIARC Report,<br />
SACCAR, Gaberone, Botswana. 147 pp.<br />
Porter, D.R., Webster, l.A. and e.A. Baker. 1993. Detection of resistance to the Russian wheat aphid in<br />
hexaploid wheat. Plant Breeding, 110: 157-160.<br />
Price, P.W., Bouton, e.E., Gross, P., McPheron, B.A., TIlOmpson, J.N. and AJ. Weis. 1980. Interactions among<br />
three trophic levels: influence of phillts on interactions between insect herbivores and natural enemies.<br />
Ann. Rev. Ecology & Systematics 11 : 41-65.<br />
Prinsloo, GJ., Tolmay, V.L. and l.L. Hatting. 1995. Implementation of the integrated control programme<br />
against the Russian wheat aphid. In: Small Grain Institute <strong>Wheat</strong> Farmers Day, 23 November 1995, pp.<br />
45-49. Agricultural Research Council, Small Grain Institute, Bethlehem, South Africa.<br />
Quick, l.S., Nkongolo, K.K., Meyer, W., Peairs, F.B. and B. Weaver. 1991. Russian wheat aphid reaction and<br />
agronomic and quality traits of a resistant wheat. Crop Sci. 31: 50-53.<br />
Quisenberry, S.S. and DJ. Schotzko. 1994. Russian wheat aphid (Homoptera: Aphididae) population<br />
development and plant damage on resistant and susceptible wheat. J. Econ. Entomol. 87: 1761-1768.<br />
Small Grain Institute Technology Report. 1996. Agricultural Research Council, Private Bag X29, Bethlehem,<br />
9700, South Africa. ISBN 1-86849-056-4.<br />
Smith, e.M., Schotzko, D., Zemetra, R.S., Souza, EJ. and S. Schroeder-Teeter. 1991. Identification of Russian<br />
wheat aphid (Homoptera: Aphididae) resistance in wheat. Journal ofEcon. Ento. 84(1): 328-332.<br />
Souza, E., Smith, C.M., Schotzko, DJ. and R.S. Zemetra. 1991. Greenhouse evaluation of red winter wheats for ·<br />
resistance to the Russian wheat aphid (Diuraphis noxia, Mordvilko). Euphytica 57: 221-225.<br />
Tolmay, V.L., van der Westhuizen, M.e. and e.S. van Deventer. 1999. A six-week screening method for<br />
mechanisms of host plant resistance to Diuraphis noxia in wheat accessions. Euphytica 107: 79-89.<br />
Tolmay, V.L. and R. Mare. 2000. Russian wheat aphid (Diuraphis noxia) feeding behaviour studies in<br />
combination with mechanism of resistance studies to elucidate aphid population development on nearisogenic<br />
resistant lines under field conditions. Poster presentation at the 6 1h International <strong>Wheat</strong><br />
Conference, Budapest, Hungary, 4-9 June 2000.<br />
194
DEVELOPMENT 01" LINEAR EQUATIONS <br />
FOR PREDICTING WHEAT RUST EPIDEMICS IN NEW HALFA, SUDAN <br />
M.A. Mahir<br />
New HaIfa Research Station, ARC, Sudan<br />
ABSTRACT<br />
Multiple regression analysis was used to develop equations predictive of the<br />
severity of leaf rust (Puccinia recondita fsp. tritici) and stem rust (P.<br />
graminis f.sp. tritici) of bread wheat ,and to estimate weekly cumulative<br />
urediniospore numbers of both rust species in New HaIfa region. Equations<br />
were generated for three overlapping periods to identify and quantify<br />
biological and meteorological variables which might provide clues of high<br />
predictive value for development of ,disease epidemics. Analysis of the<br />
combined data showed that the derived multiple regression models varied with<br />
prediction period, prediction duration and rust species. On the whole, progress<br />
in time (Xl) invariably significantly contributed to variation observed in rust<br />
severity. Other significant variables were found to be components of<br />
atmospheric humidity: minimum RH (X4), maximum RH (Xs), and hours RH<br />
> 80% (X6), followed by maximum temperature (X3) towards the end of the<br />
growing season but for leaf rust only. Minimum temperature (X2) and wind<br />
speed (X 7 ), generally, did not significantly contribute to variation in rust<br />
severity. Simple linear regression analysis of overall disease severity revealed<br />
that leaf rust and combined rust exhibited highly significant and positive<br />
relationships with progress in time from 15 Jan. to 31 March, whereas stem<br />
rust had a non-significant negative relationship. <strong>The</strong> combined influence of<br />
three biological variables, namely progress in time (T), wheat growth stage<br />
(OS), and weekly trapped rust spore numbers (WSN), accounted for only 53<br />
and 21.4% of the total variation in leaf rust and stem rust severity CDS),<br />
respectively. Studies with mechanical rust spore trapping (MRST) showed that<br />
40 and 53.7% of the total variation in P. recondita, and P. graminis weekly<br />
trapped urediospore numbers (WSN) can be explained by a function<br />
involving: progress in time (T), wind direction (WD), and presence or absence<br />
of wheat crop (C). Wind direction exhibited a significant (5%-1 %) negative<br />
effect on P. graminis, but non-significant influence on P. recondita, WSN.<br />
<strong>The</strong> inclusion of wheat growth stage (OS) in the model did not significantly<br />
improve the explanatory power of the function. Analysis of MRST data<br />
collected over ten weeks, from 15 Jan. to 31 Mar., indicated that 68.4 and<br />
74.7% of the total variation in P. recondita and P. graminis weekly trapped<br />
spore number (WSN), respectively, can be accounted for by a function<br />
involving: progress in time (T), wheat growth stage (OS), and disease severity<br />
(DS). <strong>The</strong> inclusion of wind speed (WS) as a fourth variable in the prediction<br />
model significantly (5%) increased the amount of variation with leaf rust, and<br />
had no effect on stem rust spore counts.<br />
195
Development oflinear equations for predicting wheat rust epidemics - Mahir<br />
INTRODUCTION<br />
Stem rust ofwheat (Triticum aestivum) incited by Pucdnia graminis Per. f. sp. tritid Eriks &<br />
Henn., and leaf rust induced by P. recondita Rob. ex. Desm. f. sp. trifid, are major wheat<br />
production constraints in New HaIfa region, Sudan. Grain losses approaching 72%, and<br />
kernel weight losses of up to 49.6% have been attributed to rust infections (Mohamed, 1995).<br />
Epidemic development of stem rust can occur if disease development occurs early in the<br />
season, around December (Mahir and Mohamed, 1997). It has been suggested that the<br />
location of the Agricultural Production Scheme (15° - 15°15'N, 35°15' - 36° E) at the foot of<br />
the Abyssinian Plateau confers favorable environmental conditions for rust disease<br />
development and epidemiology. Given favorable environmental conditions and compatible<br />
host/pathogen interactions, development and rapid progress of wheat rust epidemics are<br />
dependent in part upon: 1) <strong>The</strong> amount of initial inoculum; 2) <strong>The</strong> effectiveness of factors<br />
influencing size and availability of pathogen inocula (Burleigh et at., 1972). Within a 24-hour<br />
period, concentration of airborne rust spores tended to fluctuate with wind velocity,<br />
turbulence, dew, rain and storm fronts, as well as, periodicity in spore production<br />
(Eversmeyer and Kramer, 1975; Gregory, 1945). Several factors affecting rust development<br />
were studied under controlled environments (Chester, 1946).<br />
From the author's point of view, studies on wheat rust epidemics at New HaIfa were<br />
inadequately investigated and the results insufficiently interpreted (Mahir and Mohamed,<br />
1997). Emphasis within ICARDA's regional programs was placed on following the seasonal<br />
development of wheat rust diseases by the date of first appearance of uredinia in the field,<br />
and by monitoring rust spore incidence in the ·air. Data obtained from volumetric spore<br />
sampler were usually presented as average ,numbers of urediospores per cubic meter of air.<br />
Except for the work reported by Mahir and Mohamed (1997), no attempt was made to<br />
identify and quantify factors affecting urediospore incidence in the atmosphere, and ultimate<br />
development of disease epidemics in New HaIfa.<br />
With these considerations in mind, linear multiple regression models from biological and<br />
meteorological data were developed to determine, if acceptable prediction was possible and,<br />
if so, to select the most appropriate variables for the development of working models.<br />
MATERIALS AND METHODS<br />
<strong>The</strong> Nile Valley and Red Sea <strong>Wheat</strong> Disease Nursery (NVRSWDN98), and the Bread <strong>Wheat</strong><br />
Key Location Disease Nursery (KLDN99), modifications from the late Nile Valley and Red<br />
Sea <strong>Wheat</strong> Rust Trap Nursery (NVRSWRTN), were received from the <strong>Wheat</strong> Rust Program<br />
Coordinator, ICARDAIARC, Egypt. <strong>The</strong> nurseries consisted of newly released varieties and<br />
advanced lines from throughout the region. A second trial representing the Sudanese National<br />
<strong>Wheat</strong> Rust Program was received from the National Coordinator, ARC, Wad Medani,<br />
Sudan. All trials were sown 20 th November, but received a first irrigation five days latter.<br />
Location of trials, plot size, nitrogen fertilizer dose and application, and irrigation regime<br />
were carried out as previously repOlied (Mahir and Mohamed, 1997).<br />
Observations on disease development and severity, and wheat growth stage, in experimental<br />
plots and random farmers' fields, were recorded several times each week during two<br />
consecutive seasons, 1997/98 and 1998/99. <strong>The</strong> 1 to 5 scale wheat crop growth stage was<br />
196
Development oflinear equations for predicting wheat rust epidemics - Mahir<br />
modified from the Burleigh et al. (1972) system. Rust severity estimates were recorded using<br />
the modified Cobb scale (Peterson et al., 1948).<br />
<strong>Wheat</strong> rust spore trapping was conducted using a Burkard 7-day volumetric sampler<br />
(Rickmansworth Herts, England) installed with its 2 mm orifice 4 m above ground level to<br />
sample air for P. recondita and P. graminis urediospores. Spore trapping occurred from 20 th<br />
May until 17th May during seasons 1997/98 and 1998/99. All device operational procedures,<br />
specimen examination, and necessary calculations were performed as previously reported<br />
(Mahir and Mohamed, 1997).<br />
Instruments used to obtain meteorological data were: maximum and minimum temperature<br />
thermometers (Short & Mason Co., London), Oakaton thermohygrograph (Cole-Parmer<br />
Instrument Co., Chicago, lllinois), and wind direction and wind speed recording device<br />
(Swift Instruments International S.A., Tokyo, Japan).<br />
Analysis of the relationships between rust severity/spore intensity in air, and biologicalmeteorological<br />
variables were made using linear simple and multiple regression techniques.<br />
Regression analysis were structured around measures of time, temperature, atmospheric<br />
humidity, and wind components. Regression analysis, with disease severity (dependent<br />
variable, V), was applied to the data using various combinations of the following independent<br />
variables: progress in time (Xl)' minimum temperature (X 2 ), maximum temperature (X 3 ),<br />
minimum RH (Xt), maximum RH (Xs), hours RH > 80% (~), and wind speed (X 7 ).<br />
Data processing for the development of rust severity estimation models, was done for three<br />
overlapping periods, and nine sub-periods to cover the whole wheat growing seasons 1997/98<br />
and 1998/99 (for details, refer to Table 1).<br />
Percent disease severity (DS) data, collected over a period of ten weeks, from 15 January to<br />
31 March, were simultaneously regressed on three biological variables: progress in time (T),<br />
wheat growth stage (OS) expressed as integers on a scale of 1 to 5 (l=seedling, 2=tiller,<br />
3=boot, 4=head, and 5=ripe) as modified from Burleigh et al. (1972), and weekly trapped rust<br />
spore numbers (WSN).<br />
In studies with mechanical rust spore trapping (MRST), the weekly trapped spore number<br />
(WSN) was regressed on various combinations of the following independent variables to<br />
explore associations: progress in time (T), wind direction (WD) rated as: 1= S, SW, SSW; 2=<br />
N, NW, NNW, NE, NNE; wind speed (WS) in mph; absence or presence of wheat crop (C)<br />
rated as: 0 and I, respectively; wheat growth stage (OS) modified from Burleigh et al.<br />
(1972); and rust disease severity (DS) estimated as percentage (Peterson et ai, 1948). MRST<br />
data subject to analysis were obtained from 33 week records (May to May, next season), and<br />
ten week records (15 January to 31 March, same season), for two consecutive seasons,<br />
1997/98 and 1998/99.<br />
RESULTS<br />
In the course of this study, data processing was performed in a series of one hundred linear<br />
simple and multiple regression operations for the development of rust severity prediction and<br />
rust spore estimation models. Following the computational procedure recommended by<br />
Gomez and Gomez (1984), Tables 1 (LR), 2 (SR), and 3 (combined), show independent<br />
197
Development oflinear equations for predicting wheat rust epidemics - Mahir<br />
variables having partial multiple regression coefficients (means for 1997/98 and 1998/99)<br />
with computed t value greater than the tabular t value, up to a 20% level of significance. This<br />
suggestion was made because of the increasingly accepted perception of the interdependence<br />
within and between environmental and biological factors in nature. This assumption<br />
especially holds true in pathological studies where even a slight change in one factor, may<br />
alter the effect of other factors on disease development through interaction.<br />
Experimental findings extracted from the information presented in Table 1, 2, and 3, can be<br />
summarized in the following points:<br />
• <strong>The</strong> partial regression coefficients in our working equations varied with, regression term,<br />
prediction period, prediction interval, as well as rust species.<br />
• One or more ofthe coefficients was significant in each individual case.<br />
• By omitting variables with non-significant (P>20%) coefficients, some variables were<br />
allowed to enter the model as primary disease determinants.<br />
• With few exceptions, particularly for P. recondita, variation in time effectively explained<br />
variation observed in disease severity.<br />
• Of the seven regression terms tested, the significant determinants of rust severity were<br />
variables associated with atmospheric humidity: minimum RH(X4), maximum RH(xs),<br />
and hours RH > 80% (X6).<br />
• A comparison through partial regression coefficients of temperature components<br />
indicated that max. temp.(x3) was often better than min. temp.(x2) in explaining variation<br />
observed in leaf rust (LR) severity. However, with stem rust, and combined rust, max.<br />
temp. was always equal to min. temp.<br />
• Generally, multiple regression equation5 for short and medium term severity predictions,<br />
have relatively higher coefficient ofdetermination (R2) values.<br />
• It is clear from Table 4, that, except for two prediction intervals, 1 51 February to 14<br />
February, and 17 March to 31 March, leaf rust had significantly (P < 5-0.1 %) increased in<br />
severity with progress in time. On the other hand, stem rust had very highly significantly<br />
(P < 0.1) increased in severity between 15 January and 14 February, and significantly (P<br />
< 5-0.1) decreased thereafter.<br />
<strong>The</strong> combined influence of three biological variables (progress in time (T); wheat growth<br />
stage (GS); and weekly rust spore numbers (WSN)) on rust severity was investigated using<br />
multiple regression analysis. <strong>The</strong> estimated mUltiple regression equations simultaneously<br />
relating these three bio-variables to rust severity, are presented below:<br />
DSLR = 121.18 + 23.6 T - 46.65 GS - 1.74 WSN (R 2 = 0.53) (59)<br />
DSsR = 29.97 - 0.39 T - 1.37 GS - 0.19 WSN (R 2 = 0.21) (60)<br />
<strong>The</strong> effect of various combinations of four independent variables, one meteorological and<br />
three biological, on weekly trapped rust spore numbers (WSN) was studied using multiple<br />
regression analysis technique. <strong>The</strong> estimated multiple regression equations simultaneously<br />
relating progress in time (T), wind direction (WD), and presence or absence of wheat crop<br />
(C), to weekly spore numbers (WSN), are given below:<br />
198
Development oflinear equationsfor predicting wheat rust epidemics - Mahir<br />
WSN LR = 5.88 + 0.75** T - 6.87 WD - 1.86 C (R 2 = 0.40) (61)<br />
WSN SR = 29.04 + 2.63*** T - 25.91 * WD - 5.14 C (R 2 = 0.54) (62)<br />
When growth stage (OS) of the crop was added as a 4th variable in the model the following<br />
multiple regression equations were obtained:<br />
= 5.94+0.81 *T - 7.4WD - 1.51C - 0.320S (R 2 = 0.40) (63)<br />
WSN SR = 29.98+3.57**T-33.4**WD-0.21C-4.590S (R 2 = 0.56) (64)<br />
Two of the four variables evaluated in MRST studies were purposely replaced by another two<br />
from the same groups: rust disease severity (DS), and wind speed (WS), instead of (C), and<br />
(WD), respectively. <strong>The</strong> joint effect of three variables, (T), (OS), and (DS), on weekly<br />
trapped rust spore number (WSN), was evaluated. <strong>The</strong> estimated linear multiple regression<br />
equations simultaneously relating these three variables to (WSN), are given below:<br />
WSN LR = 30.73 + 7.13 T - "13.27 OS - 0.13 DS (R 2 = 0.68) (65)<br />
WSN SR = - 35.18 + 2.04 T + 15.63 OS - 0.17 DS (R 2 = 0.75) (66)<br />
When wind speed (WS), was added as a 4th variable in the prediction model the following<br />
multiple regression equations were obtained:<br />
WSN LR = -4.77+3.74 T-6.40S-0.1 DS+8.77* WS (R 2 = 0.87*) (67)<br />
WSN SR = -33.24+2.17 T+15.3 OS-0.18 DS-0.41WS (R2= 0.75) (68)<br />
Figure 1 illustrates rust spore distribution at New HaIfa (values represent May to May weekly<br />
mean cumulative spore counts for seasons 1997/98 and 1998/99).<br />
DISCUSSION<br />
Environment is a complex aggregation that includes many factors which must be beyond a<br />
minimum threshold for disease development to occur (Eversmeyer and Burleigh, 1970).<br />
<strong>The</strong>refore, in developing rust severity estimation models, our primary concern was to identify<br />
and quantify biological and meteorological variables that crucially affect wheat rust<br />
development in New HaIfa area, and to see if they could serve as clues for disease epidemics.<br />
Such information could be of great importance and would augment utility of breeders' and<br />
agronomists' techniques in their attempt to minimize economical crop losses.<br />
In this study, models were developed for partial and entire sets of data. <strong>The</strong> results obtained<br />
suggest that the climatological variables tested appear more useful for short, medium, and<br />
long term prediction of leaf rust rather than stem rust disease. Thus, even though rust disease<br />
development in New HaIfa, is dependent upon primary inoculum from outside, small inputs<br />
of urediospores early in the season are all that are needed for rust epidemics development in<br />
that area.<br />
199
Development oflinear equations for predicting wheat rust epidemics - Mah ir<br />
It seems likely that the meteorological components associated with atmospheric humidity<br />
would have been as effective as the seven variables tested, for mid-season leaf rust<br />
development and severity prediction. From the partial regression coefficients summarized in<br />
Table 1, emerge ten equations based on minimum RH (~), maximum RH (X5), and hours<br />
RH > 80% (X6), that would predict/estimate leaf rust severity between mid-January and late<br />
February with acceptable level of confidence (R 2 > 0.60). <strong>The</strong> working equations 1,2,5,6 and<br />
10, are super for short tenn (two weeks) prediction, whereas equations 3,4,9 and 7,8 are<br />
useful for medium tenn (4 wks), and long tenn (> 6 wks) predictions, respectively (Table 1).<br />
Inspection of the models reported here suggests that mid-season temperature variables (X2<br />
and X3) did not help much in explaining variation observed in rust severity. This may be<br />
because their direct effect on disease development was negated by the cooling effect of<br />
atmospheric humidity. However, as the RH declined, with the advancement of the growing<br />
season, maximum temperature appeared as a major component of rust severity prediction<br />
equations. Equations based on max. temperature plus one or two atmospheric humidity<br />
variables, generated for medium and long term severity prediction toward the end of the<br />
growing season, accounted for 52% to 53% of the variation (equations 12-14, Table 1). This<br />
finding further supports the above findings that factors associated with ambient humidity<br />
offers clues of high predictive value for rust epidemics development in New HaIfa area. This<br />
result is found in agreement with an earlier study reported by Eversmeyer and Burleigh<br />
(1970).<br />
By comparing infonnation presented in Table 2, it could be deduced that, except for the<br />
period 15 January to mid February period, climatological conditions were not conducive for<br />
stem rust development. This presumption, is clearly indicated by the limited number of<br />
independent variables in disease severity estimation equations, as well as by the relatively<br />
low coefficient of determination (R2) values. Of the 17 stem rust estimation models, only four<br />
short tenn and one medium tenn equations gave R2 values> 0.60, compared to 12 equations<br />
for leaf rust, and seven for combined rust estimation.<br />
Moreover, it is clear from Table 4, that both leaf and combined rust significantly increased<br />
with progress in time until 16 March, and decreased, but flot significantly, thereafter. On the<br />
other hand, stem rust significantly increased only until 14 February, and significantly<br />
decreased thereafter.<br />
<strong>The</strong> rationale for using growth stage (GS) of wheat in models for estimating urediospore<br />
incidence in air, is that, as the crop matures more rust occurs (BurJeigh et at., 1972), and<br />
consequently more rust spores are generated. However, studies carried out with MRST at<br />
New HaIfa clearly indicated that for factors like growth stage, or the presence or absence of<br />
wheat crop, do not seem to have clear biological meaning in rust spore incidence prediction<br />
models (equations 61 to 64), yielding R2 values from 40-56. <strong>The</strong> principal difficulty with<br />
relating rust urediospore counts in air to, disease severity, wheat growth stage, and presence /<br />
absence of the crop in the field, is that the spore sampler is indiscriminately exposed to<br />
spores from endogenous and exogenous sources and the vicissitudes of weather might cause<br />
more or fewer spore captures from a given level of infection in the field (Burleigh et at.,<br />
1972).<br />
Multiple regression equations involving (T), (GS) and (OS) accounted for 68% and 75% of<br />
the total variation in leaf rust (LR) and stem rust (SR) urediospore counts, respectively.<br />
200
Development oflinear equations for predicting wheat rust epidemics - Mahir<br />
Nevertheless, the inclusion of wind speed (WS) in urediospore prediction models,<br />
substantially improved the explanatory power of the function with P. recondita by 26.7%<br />
(equations 65 and 67), and had no effect with P. graminis. This contradictory effect of wind<br />
speed on variations in rust species spore counts, could be explained by the fact that, the<br />
exceptionally favorable conditions for leaf rust development experienced in season 1997/98<br />
and 98/99, resulted in subsequent generation of P. recondita urediospores up to the end of<br />
March, that often coincides with high speed wind storms.<br />
It is clear from results obtained that, wind direction significantly (P < 5%-1 %) negatively<br />
affected P. gram inis urediospore counts, and had a non-significant negative effect on P.<br />
recondita spore incidence in the air. This result might suggest that the greater proportion of<br />
stem rust primary inoculum is received at New HaIfa ahead of the wheat growing season.<br />
Consequently, crucial seasonal changes in population dynamics and biology of the initial<br />
inoculum of P. graminis cannot be ruled out. This hypothesis could be supported by the<br />
significant decline in stem rust severity observed early in the season in spite of the fact that<br />
weather deviations after mid-February were not drastic. <strong>The</strong> average environmental data<br />
records taken from NHRS micro-meteorology unit for the periods, 15 January to 28 February,<br />
and 1 March to 31 March 1998 and -1999, are given below:<br />
' ,:Period' .'1 .•<br />
",<br />
' -, ' 0<br />
:max.-T°C' "mir,. T etC" ' max~lMI~,yo ''min. RH'o/O ," .ar'RH;>80% "<br />
15J-28F/98 33.4 14.3 82.8 33.0 2.9 <br />
15J-28F/99 32.5 13.6 87.8 36.4 4.6 <br />
IM-31M98 38.1 18.9 74.8 32.0 2.8 <br />
1M-31M99 35.6 19.2 73.3 32.4 2.7 <br />
CONCLUSIONS<br />
<strong>The</strong> degree of accuracy of the estimated regression equations vary greatly from one data<br />
source to another (Gomez and Gomez, 1984). <strong>The</strong>refore, evidence might be too sketchy to<br />
draw conclusions. Nevertheless, several hypothetical points could arise from the<br />
interpretation of the multiple regression equations derived in this study:<br />
• <strong>The</strong> models presented here are primarily useful in showing the kinds of predictions and<br />
effects of various biological and climatological variables which may affect wheat rust<br />
epidemic development at New HaIfa area, rather than providing working prediction<br />
equations.<br />
• Meteorological factors associated with atmospheric humidity are good clues for<br />
epidemics development.<br />
• <strong>The</strong> climatological variables tested appear more useful for predicting incidence of leaf<br />
rust rather than stem rust prediction.<br />
• <strong>The</strong> numbers of urediospores trapped at New Haifa, although related to disease<br />
development, cannot be correlated with disease severity.<br />
• Wind speed is a crucial determinant of the variation in P. recondita urediospore incidence<br />
III aIr.<br />
• Wind direction accounts for a great proportion of the variation in P. graminis spore<br />
counts.<br />
• <strong>The</strong> greatest proportion ofP. graminis urediospores is received at New HaIfa ahead of the<br />
wheat growing season.<br />
201
Development oflinear equations for predicting wheat rust epidemics - Mahir<br />
• Perceptible levels of initial inoculum of both rust species hover over New HaIfa between<br />
May and November. Since winds, with few exceptions, are predominantly from SW<br />
SSW, during this period every year, therefore, its origin is presumably geographically<br />
located likewise.<br />
• <strong>The</strong>re are two qualifications to the urediospore distribution at New HaIfa:<br />
<strong>The</strong> curves do not exactly follow patterns associated with local and external<br />
production of rust spores.<br />
Notably New HaIfa, has a tri-modal distribution of urediospores, this finding might<br />
suggest the existence of more than one major source of inoculum in the region.<br />
• <strong>The</strong> prediction system presented in this paper is considered as preliminary, nevertheless,<br />
offers a baseline model for future studies in the region.<br />
RECOMMENDATIONS<br />
<strong>The</strong> following innovative research proposals are strongly recommended:<br />
• <strong>The</strong> Rust Trap Nursery should be on farm at New HaIfa, as early as July, to monitor<br />
changes in population dynamics and biology of wheat rust species.<br />
• Future research strategies should Tocus on:<br />
conducting epidemiological studies with the objective of developing methods of<br />
identifying potential disease threats early enough to enable using other disease control<br />
measures e.g. aerial spraying.<br />
support in tenns of equipment and facilities.<br />
upgrade research skills and capabilities scientists and supporting staff.<br />
REFERENCES<br />
Burleigh, l .R., Eversmeyer, M.G. and A.P. Roelfs. 1972. Development of linear equations for predicting wheat<br />
leaf rust. Phytopathology. 62 : 947-953.<br />
Chester, K.S. 1948. <strong>The</strong> Cereal Rusts. Chronica Botanica Co., Waltham, Mass. 269 p.<br />
Eversmeyer, M.G. and c.L. Kram~r. 1975. Air-spora above a Kansas wheat field. Phytopathology. 65: 490-492.<br />
Eversmeyer, M.G. and l.R. Burleigh. 1970. A method of predicting epidemic development of wheat leaf rust.<br />
Phytopathology. 60: 805-811 .<br />
Gomez, K.A. and A.A. Gomez. 1984. Statistical Procedures for Agricultural Research. 2 nd edition. lohn Wiley<br />
& Sons, New York.<br />
Gregory, P.H. 1945. <strong>The</strong> dispersion of airborne spores. Trans. Br. Mycol. Soc. 28: 26-72.<br />
Mahir, M.A. and S.M. Mohamed. 1997. Studies on wheat rust epidemics in New Haifa area, Sudan.<br />
ICARDAlNVRSRPINW-DOC-006,24-33.<br />
Mohamed, S.A. and S.M. Mohamed. 1995. <strong>Wheat</strong> Diseases. pp. 174-195. In: <strong>Wheat</strong> Production and<br />
Improvement in the Sudan. Osman, A.A., Abdalla, B.A., Mahmoud, B.S. and C.S. Mohan (eds.).<br />
Mohamed, S.A. and S.M. Mohamed. 1994. <strong>Wheat</strong> Diseases. Proceedings of NVRSRP, National Coordination<br />
Meeting, Wad Medani, Sudan (1993).<br />
Peterson, R.F. , Campbell, A.B. and A.E. Hannah. 1948. A diagrammatic scale for estimating rust intensity of<br />
leaves and stems of cereals. Can. 1. Res. C. 26: 496-500.<br />
Questions and Answers:<br />
Izzat S.A. Tahir: Wind direction (WD) affects or influences P. graminis but not P.<br />
recondita, while wind speed (WS) influences P. recondita. What does that imply regarding<br />
sources of spores and the time of their appearance?<br />
202
Development oflinear equations for predicting wheat rust epidemics - Mahir<br />
Answer: (1) <strong>The</strong> contradictory effect ofWS on spore counts is that the favorable condition<br />
for LR development resulted in subsequent generation of LR spores up to the end of the<br />
season which often coincides with high speed wind storms. (2) <strong>The</strong> significant effect ofWD<br />
on SR spore counts indicates the existence of a major source of SR primary (initial) inocula<br />
probably geographically located southwest ofNew HaIfa region and needs to be researched.<br />
Also, we can make use of the significant effect of WD on SR spore counts to recommend that<br />
the rust trap nursery should be on-farm from early July and that will enable us to monitor for<br />
population dynamic changes and biological variability among SR strains.<br />
Wolfgang H. Pfeiffer: <strong>For</strong>ecasting rust epidemics will depend on the varieties grown, their<br />
genetic composition in terms of resistance genes, type of resistance and temp~rature<br />
sensitivity of the resistance gene. When and how are you including these host factors into<br />
your model?<br />
Answer: <strong>For</strong>tunately, in the Sudan, we have only two wheat varieties for large-scale<br />
commercial wheat production. But certainly we have to develop the models as the situation<br />
changes concerning genotypes. But how? Will be done in consultation with breeders and<br />
statisticians.<br />
Table 1.<br />
N " Pel-iod<br />
Partial regression coefficients for prediction of leaf rust disease.<br />
Xi<br />
"!, .. '<br />
X2 "<br />
'. X3 :<br />
; "";<br />
',,::.x;;<br />
" "'1; ,"'xs:' "<br />
'<br />
.<br />
"<br />
X6 X7 R~ T<br />
1 15J-311 0.55 0.22 -0.15 0.90 0.79 S<br />
2 0.51 ** 0.11 -0.08 0.40 0.74 S<br />
3 15J-14F 1.20*** ., 0.50* 0.32* 0.61 M<br />
4 1.20*** 0.52* 0.16* 0.58 M<br />
5 1F-14F -6.39 -9.80* 2.29 1.24 -3.69 0.69 S<br />
6 -6.38* -10.20* 2.08* 1.20* -3.82* 0.68 S<br />
7 15J-28F 1.64*** 0.51 * 0.80 L<br />
8 1.69*** 0.47** 0.80 L<br />
9 1F-28F 2.52*** 0.70 M<br />
10 15F-28F 3.09** 1.29* 0.70 S<br />
11 IF-31M 0.40 -0.43 3.78* 0.29 L<br />
12 IF-16M 0.87** 2.61 1.10 -0.66 3.08 0.53 L<br />
13 0.86** 2.86* 1.15* -0.65 3.06* 0.53 L<br />
14 1M-31M -1.42 3.78* 0.52 M<br />
15 -1.56** 4.25** 0.31 M<br />
16 1M-16M 4.22 0.66 S<br />
17 17M-31M -3.48 7.58 2.20* 0.84 S<br />
18 -2.79 4.35* 2.60** 0.73 S<br />
19 15J-31M 0.69*** 1.57 0.53 2.67* -6.04* 0.53 L<br />
20 0.73*** 0.80 0.35 1.27 -5.75 0.51 L<br />
21 0.84*** 1.45* -4.80* 0.50 L<br />
N = Equation no.; Period = 15 January- 31 March.<br />
Xl = progress in time; X2 = min temp; X3 = max temp; X4 = min RH; Xs = max RH;<br />
X6 = hrs RH >80%; X7 = wind speed; T= term; S= short; M= medium; L= long.<br />
*, **, *** Significant at the 5, 1 and 0.1 % levels, respectively.<br />
203
Development oflinear equations for predicting wheat rust epidemics - Mahir<br />
Table 2.<br />
Partial regression coefficients for prediction of stem rust disease.<br />
....... ".", ..'. "',<br />
N .· PeriOd ;":'.' Xl X2 . X3 X4. . ·· Xs ' X'6 X7<br />
R2 . 1<br />
22 15J-31J 3.02*** -4.69 -0.38 0.90 S<br />
23 3.12*** -3.60 -0.08 0.80 S<br />
24 15J-14F 1.42*** -2.95 -0.56 0.64 M<br />
25 1.42*** -1.71 -0.77 0.59 M<br />
26 1F-14F -5.00 0.43 S<br />
27 15J-28F 0.34 0.73* 0.17 L<br />
28 IF-28F -1.15* -3.04 0.40 M<br />
29 -0.92** -2.39* 0.31 M<br />
30 15F-28F -2.48 3.71 0.56 S<br />
31 IF-31M -0.44** 0.39 L<br />
32 IF-16M -0.50** 0.43 L<br />
33 1M-31M 0.91 * -0.40* -4.53 0.52 M<br />
34 . 0.88** -0.33*** -6.33 ** 0.49 M<br />
35 1M-16M 1.22 -0.42 0.70 S<br />
36 1.25** -0.31 ** 0.65 S<br />
37 17M-31M 0.99 0.58 S<br />
38 15J-31M -0.30 1.63 0.14 L<br />
<strong>For</strong> notes: see Table 1.<br />
,<br />
204
Development oflinear equations for predicting wheat rust epidemics - Mahir<br />
Table 3.<br />
Partial regression coefficients for prediction of combined leaf and stem<br />
rust severity.<br />
. ,<br />
.' ' xii , . X7<br />
N , 'Pedo4 Xl '.<br />
'.X2 . ' Xj<br />
.<br />
'\ .". "<br />
,' ~'. ., ;'Xs. ,<br />
"'2·<br />
R T<br />
,"<br />
39 15J-311 3.57** -5.81 * -0.53* 2.69 0.9 S<br />
3<br />
40 3.78** -6.71 ** -0.51 * 2.85** 0.9 S<br />
2<br />
41 15J-14F 2.62*** -3.30 0.7 M<br />
5<br />
42 2.57*** -1.37 0.7 M<br />
0<br />
43 IF-14F -5.92 0.4 S<br />
4<br />
44 15J-28F 2.12*** -0.25 0.7 L<br />
9<br />
45 2.03*** . -0.26 0.7 L<br />
8<br />
46 IF-28F 1.37 0.4 M<br />
. 1<br />
47 15F-28F 0.61 5.00 0.5 S<br />
4<br />
48 IF-31M , 0.88* -0.69 4.47 0.1 L<br />
7<br />
-.<br />
49<br />
0.57 -0.67* 4.45** 0.1 L<br />
4<br />
50 IF-16M 1.02 -0.70 3.61 0.2 L<br />
2<br />
51 -0.76* 4.42* 0.1 L<br />
2<br />
52 1M-31M -1.63* 3.74 0.4 M<br />
1<br />
53 -1.61** 3.55 0.2 M<br />
5<br />
54 1M-16M 4.52 0.4 S<br />
3<br />
55 17-31M 2.99 0.7 S<br />
3<br />
56 15J-31M 0.65** -0.65* 4.41 ** -7.06 0.4 L<br />
2<br />
57 0.58** -0.70* 4.46** -7.67* 0.4 L<br />
1<br />
58 0.60*** -0.62* 4.26** 0.3 L<br />
7<br />
<strong>For</strong> notes: see Table 1.<br />
205
Development oflinear equations for predicting wheat rust epidemics - Mahir<br />
Table 4.<br />
Regression coefficients and coefficients of determination (R2) obtained<br />
from regression of disease severity (y) on progress in time (x).<br />
LR ' .<br />
' R?<br />
., '<br />
. .. Xl<br />
.sit'<br />
; , ' ~ .<br />
' : R2<br />
.<br />
'.<br />
. ,<br />
, .<br />
LR+SR<br />
'. '.<br />
R2 .'<br />
Xl<br />
Period<br />
Xl<br />
15J-311 0.54*** 0.64 2.22*** 0.72 2.76*** 0.78 S<br />
15J-14F 1.11*** 0.51 1.33*** 0.46 2.44*** 0.70 M<br />
IF-14F 0.99 0.08 0.81 0.04 1.80 0.12 S<br />
15J-28F 1.70*** 0.78 0.32 0.08 2.03*** 0.77 L<br />
IF-28F 2.28*** 0.66 -0.72* 0.15 1.56*** 0.37 M<br />
15F-28F 3.14** 0.59 -1.03 * 0.29 2.11 * 0.32 S<br />
IF-31M 0.51 ** 0.14 -0,47*** 0.32 0.05 0.00 L<br />
IF-16M 1.20*** 0.40 -0.64*** 0.32 0.56* 0.11 L<br />
1M-31M -0.16 0.00 -0.29 0.08 -0.44 0.03 M<br />
1M-16M 3.09* 0.35 -J.44** 0,46 1.65 0.12 S<br />
17M-31M -2.18 0.24 0,45 0.05 -1.98 0.16 S<br />
15J-31M 0.82*** 0,45· -0.13 0.04 0.70*** 0.30 L<br />
<strong>For</strong> notes: see Table l.<br />
T<br />
206
Development oflinear equations for predicting wheat rust epidemics - Mahir<br />
I<br />
5000<br />
4500<br />
~<br />
I 4000<br />
I<br />
--------- ----- --- -_•.._- - - -------- -- ---,<br />
i CO<br />
1 C'".l 3500 ~ C---.··· SR • LEJ I: .<br />
: E<br />
1<br />
I ~<br />
I;<br />
c<br />
3000<br />
2500<br />
Q)<br />
--- c<br />
2000<br />
Q) <br />
~<br />
0<br />
n.<br />
(j)<br />
1500 <br />
1000 <br />
500 <br />
0<br />
~ C 0> 0.. > ..c<br />
-, 0 -, «<br />
~<br />
~<br />
::J 1) C ~<br />
CO ::J -, ::J. Q) 0 CO Q) CO 0.. CO<br />
~ « en z u.. ~ ~<br />
Weekly interval I<br />
I<br />
L_______ ____. _____<br />
-"- ----<br />
_.__<br />
___..J<br />
Figure 1. Rust spore distribution, New Haifa.<br />
207 <br />
I<br />
I<br />
II
BREEDING FOR DISEASE RESISTANCE IN WHEAT IN UGANDA<br />
William Wamala Wagoire<br />
Kalengyere Research Station, P.O. Box 722, Kabale, Uganda<br />
ABSTRACT<br />
Yellow and stem rust (caused by Puccinia striifarrnis and P. gramlnlS,<br />
respectively) and Septoria leaf blotches (caused by Septaria spp.) are among<br />
the wide range of wheat diseases that constrain wheat production in the<br />
highlands of Uganda. Screening for resistance to these diseases relies on<br />
natural infection in the field. A study to determine the potential yield losses<br />
due to yellow rust was carried out at Kalengyere, a hot spot for yellow rust.<br />
<strong>The</strong> performance ofFls and F2S derived from a complete 8 x 8 diallel of bread<br />
wheat lines was evaluated in fungicide-treated and untreated plots in 1995 and<br />
for the F2S in 1996. <strong>The</strong> fungicide treatment controlled yellow rust and<br />
Septoria leaf blotches. A yield loss of 83% was attributed to all foliar diseases,<br />
averaged over the F ,s and F2S during the test period. A yield loss of 25% was<br />
attributed specifically to yellow rust. <strong>The</strong> importance of stem rust emphasized<br />
during the 1998A season when 457 and 280 lines, comprising the PCYRfLR<br />
nursery and the 9 th High Rainfall <strong>Wheat</strong> Screening Nursery (HRWSN)<br />
respectively, were screened at Kalengyere Research Station. During this<br />
season, stem rust of wheat was the most important disease. A total of 33 and<br />
21 lines were selected from the PCYRlLR and 9 th HRWSN, respectively, and<br />
had infection scores ranging from 'T' to '5MS' for stem rust. During the same<br />
season, a breakdown of Sr31 was detected. During testing of these selections<br />
in the following season, 1999 A, when the prevalent disease was yellow rust,<br />
80% of the selections had a yellow rust reaction range of 'TR' to '20MS'.<br />
<strong>The</strong>se results indicate that screening for field disease resistance over seasons<br />
can be a useful tool for the identification and development of genotypes with<br />
resistance to a wide range of diseases.<br />
INTRODUCTION<br />
<strong>Wheat</strong> in Uganda is a rain-fed crop grown in the highlands (1800-2400 m a.s.l.) of the<br />
southwest and on the slopes of Mt. Elgon in the east. Low temperatures averaging 16°C and<br />
relatively high bi-modal rainfall characterize these areas. In the southwest, 480 mm and 750<br />
nun of rain are received in the March-August (Season A) and September-March (Season B)<br />
respectively. Likewise in the east, Season A receives 470 mm while season B receives 560<br />
mm of rain. Relative humidity averages 70% over these areas. <strong>The</strong>se environmental<br />
conditions favor the occurrence of many wheat diseases. At the higher altitudes in the<br />
southwest, stripe rust (Puccinia striifarmis Westend) and speckled leaf blotch (Septaria<br />
triticii) are most prevalent. However, in addition, in the recent past, stem rust (Puccinia<br />
graminis) has been observed to occur. Other diseases in the wheat growing areas of Uganda'<br />
include leaf rust caused by P. recandita and Fusarium head blight caused by Fusarium spp.<br />
208
Breeding / or disease resistance in wheat in Uganda - Wagoire<br />
<strong>The</strong> small size of the wheat production areas in Uganda « 5000 ha) does not merit a full<br />
scale breeding program that includes hybridization and the selection of segregating<br />
populations. Our approach is to introduce a wide range of lines from countries and/or regions<br />
(and especially from CIMMYT) with similar growing conditions. <strong>The</strong>se lines are then<br />
screened under local conditions for adaptability and disease resistance. Selection of<br />
promising lines for further testing in yield trials is done during this evaluation. This paper<br />
highlights some of the salient features that have been experienced in the program in the past<br />
few years.<br />
MATERIALS AND METHODS<br />
Assessment of Yield Loss due to Diseases<br />
Genotypes derived from an 8 x 8 diallel crossing scheme of bread wheat genotypes were used<br />
in this study. <strong>The</strong> parents were selected from CIMMYT-derived material according to their<br />
host response to yellow rust at Kalengyere, a location with high incidence of this disease<br />
(Wagoire, 1997). This germplasm has been bred for wide adaptation, including resistance to<br />
pests and diseases (Braun et al., 1997). <strong>The</strong> lines Buri, Kenya Chiriku and ESDAJLIRA were<br />
rated as resistant to yellow rust reaction, while the lines VEE/JUP73/EMU"S"/GJO"S" and<br />
Attila were recorded as moderately resistant and moderately susceptible, respectively. <strong>The</strong><br />
other 3 lines were rated as susceptible to yellow rust. <strong>The</strong> performance of F IS and F2S derived<br />
from a complete 8 x 8 diallel of these lines was evaluated in fungicide-treated (FT) and<br />
untreated (NT) plots at Kalengyere in southwestern Uganda during 1995 season B and, for<br />
the F 2S only in 1996 season A. A split-plot design with 2 replicates was used. Fungicide<br />
treatment was the main plots while the wheat lines were the subplots. <strong>The</strong> experimental plot<br />
(subplot) for the F IS consisted of 2 rows of 1.5 m length and 0.3 m inter-row spacing whereas<br />
for the F2S, the experimental plots consisted of 2 rows of 5 m length and 0.3 minter-row<br />
spacing. In all experiments spacing between plants was 0.15 m and nitrogen was banded at<br />
planting at a rate of 50 kg ha- .<br />
<strong>The</strong> fungicide "FOLICUR 250 EC" [250 g I-I terbuconazole] which the manufacturer<br />
recommends for the control of small grain stem and foliar diseases was used. It was applied<br />
I<br />
as a foliar spray using a knapsack sprayer at a rate of 150 ml ha- of active ingredient.<br />
Application was made at Zadok's growth stage (GS) 37 and also at GS 69 (Roelfs et al.,<br />
1992).<br />
Data taken included yellow rust incidence and severity using the modified Cobb scale<br />
(Peterson et al., 1948), and yield in grams per plot. Analyses of variance were carried out<br />
using sub-plot means (Mead et al., 1993). <strong>The</strong> data were analyzed separately for both the F I<br />
and F2 generations. Further, comparisons were made among the crossing schemes i.e.,<br />
Resistant x Resistant (R x R), Resistant x Susceptible (R x S) and Susceptible x Susceptible<br />
(S x S) crosses.<br />
Screening of <strong>Wheat</strong> Nurseries<br />
Table 1 shows the introductions received from CIMMYT as international nurseries. All<br />
nurseries were planted by hand in 2 row-plots, 30 cm apart at a seed rate of 100 kglha.<br />
Fertilizer was banded at the rate of 50 Nand 50 P205 kg ha- I .<br />
209
Breeding f or disease resistance in wheat in Uganda - Wagoire<br />
Plots were weeded by hand at approximately four and eight weeks after planting and bird<br />
scarers were employed to control bird damage. Harvesting, threshing and winnowing were<br />
carried out by hand.<br />
Selections made in the first season of screening are evaluated further in the following season<br />
and disease selection pressure that exists in that particular season is used in selection.<br />
<strong>The</strong> nurseries were observed periodically throughout each season for disease reaction for<br />
mainly yellow rust and stem rust, spot blotch and yield.<br />
RESULTS AND DISCUSSION<br />
Assessment of Yield Loss due to Diseases<br />
<strong>The</strong> performance of the genotypes and their mean yellow rust scores at Kalengyere for the<br />
F1S and F2S are shown in Table 2. <strong>The</strong>re was a high infection of yellow rust as shown by the<br />
high coefficient of infection (CI) of the S x S group in the control plots. Within the fungicide<br />
treated plots, no yield differences occurred in the F)s. In the F2S, significant differences in<br />
yield existed between the groups in the 1995A season but not in the 1996A season. In the<br />
control plots, significant differences occurred between the groups for yellow rust and, so<br />
were the corresponding yields.<br />
This data can be used to apportion yield losses to the different prevalent diseases (Wagoire et<br />
ai., 1998). <strong>The</strong> difference in mean yield between the fungicide treated and untreated plots of<br />
the susceptible material, that is the S parents and S x S crosses, represents the loss caused by<br />
diseases which can be eliminated by chemical control. In the 1995 B season, this loss was<br />
85% for the F)s and 87% for the F2S, while for the hs in the 1996 season A it was 77%<br />
(Table 4). Yield loss due to foliar diseases other than yellow rust were calculated from the<br />
difference between fungicide treated and control groups for R parents and R x R crosses.<br />
<strong>The</strong>se losses amount to 65, 73, and 37% for the F)s and hs in the 1995 season B and in the<br />
hs in the 1996 season A, respectively. Finally, the yield difference in untreated plots<br />
between R x Sand S x S crosses, which are half-sib families, provides an estimate of the gain<br />
attributable to yellow rust resistance. Averaged over the three trials at Kalengyere (Table 4),<br />
the estimated yield increase due to yellow rust resistance is 138%.<br />
Screening nurseries<br />
During 1998B season, stem rust constituted the major screening criteria. High levels of<br />
infection were scored on material known to carry the IBL-IRS chromosome translocation<br />
containing the Sr31 gene for resistance to stem rust, virulence to Sr31 was suspected.<br />
Accordingly, samples from some of these lines (Table 4) were tested for identification of the<br />
prevailing biotype (Pretorius et ai., 1999). All the lines tested for Sr31 invariably showed a<br />
breakdown in resistance to this gene. This situation is worrying, as it is known that wide<br />
spread resistance to stem rust in wheat is conferred at least in part to the gene Sr31. However,<br />
while many wheat programs such as CIMMYT have been preparing for such a situation, the<br />
evaluation of developed/derived lines across diverse sites is crucial in detection of such<br />
shortfalls. It is also important to note that of the about 30% selections made that showed<br />
adequate levels of resistance to stem rust, 10 lines also showed good resistance to yellow rust<br />
in 1999A season (Table 5). <strong>The</strong>se lines were used to constitute a preliminary yield trial to<br />
210
Breedingfor disease resistance in wheat in Uganda - Wagoire<br />
assess for other attributes such as yield.<br />
From the foregoing, it is evident that stem and yellow rust and Septoria leaf blotches<br />
constitute some of the biotic constraints to wheat production in Uganda. Further, Kalengyere<br />
research station is a hot-spot for the aforesaid diseases. However, the occurrence of these<br />
diseases is unpredictable as evidenced from the seasonal variation in their occurrence.<br />
<strong>The</strong>refore, testing of lines both newly developed and already in production around the world<br />
needs to be carried out continuously in such hot-spots. In this way, researchers will keep<br />
ahead of impeding disasters that arise from development of new disease biotypes.<br />
REFERENCES<br />
Braun, H.J., Rajaram, S. and M. van Ginkel. 1997. CIMMYT's approach to breeding for wide adaptation. pp.<br />
197- 205. In: Tigerstedt, P.M.A. (ed.). Adaptation in plant breeding. Kluwer Academic Publishers,<br />
Dordrecht, <strong>The</strong> Netherlands.<br />
Mead, R., Curnow, R.N. and A.M. Hasted. 1993. Statistical methods in agriculture and experimental biology.<br />
2 nd edition. Chapman and Hall, London, 415 pp.<br />
Peterson, R.F., Campbell, A.B. and A.E. Hannah. 1948. A diagrammatic scale for estimating rust intensity of<br />
leaves and stems of cereals. Can. 1. Res. Sect. C 26: 496-500.<br />
Pretorius, Z.A., Singh, R.P., Wagoire, W.W. and T.S. Payne. 1999. Detection of virulence to wheat stem rust<br />
resistance gene SR 31 in Puccinia graminis.j sp. tritid in Uganda. Plant Disease, 84: 203.<br />
Roelfs, A.P., Singh. R.P. and E.E. Saari . 1992. Rust diseases of wheat: Concepts and Methods of Disease<br />
Management. Mexico, D.F.: CIMMYT. pp. 56-57.<br />
Wagoire, W.W. 1997. Yellow rust resistance of wheat cultivars in Uganda. Ph.D. <strong>The</strong>sis, Department of<br />
Agricultural Science, <strong>The</strong> Royal Veterinary and Agricultural University, Denmark.<br />
Wagoire, W. W., Stolen, 0., Hill, J. and R. Ortiz. 1998. Is there a "cost" for wheat cultivars with genes for<br />
resistance to yellow rust caused by Puccinip. striiformis? Crop Protection, 17: 337-340.<br />
Questions and Answers:<br />
M.A. Mahir: If using fungicide (against other foliar diseases) with R x R crosses and it gives<br />
a CI value as low as 0-13, why don't you go for fungicide against YR itself?<br />
Answer: Most wheat farmers in Uganda are small-scale and recommendation of fungicide<br />
would not be feasible.<br />
Sewalem Amogne: What are the reasons for the change in the importance of stem rust over<br />
time at your research site?<br />
Answer: No definite answer, but could be due to the appearance of a new pathotype of stem<br />
rust.<br />
211
Breedingfor disease resistance in wheat in Uganda - Wagoire<br />
Table 1.<br />
,Site<br />
Nurseries screened in 1998B and 1999A seasons.<br />
-<br />
. Season' I<br />
- , , .<br />
..<br />
~~ -'<br />
":,i<br />
,.,' :: . ~ ,"<br />
. '.,<br />
~. ' or<br />
" No"of<br />
I<br />
.~; ' , ;. -<br />
..<br />
Nur~~ty* ': , ,,' . .' ,en fries .<br />
-<br />
.'\',..<br />
-"",:.<br />
.; '<br />
No. of<br />
°<br />
.<br />
sele~t~~9.cns ,<br />
Kalengyere 1998B PCYRlLRRG 457 34 7.4<br />
Kalengyere 1998B 9 th HRWSN 135 20 14.8<br />
Kalengyere & Buhweju 1998B 19 th ESWYT** 50 21 42.0<br />
Ka1engyere 1999A Selections from PC YRlLR RG 34 5 14.7<br />
Kalengyere 199A Selections from 19 th HR WSN 20 5 25.0<br />
* PC YRlLR RG = Parce/la Chica for Yellow rustlLeafrust material; HRWSN = High rainfall <strong>Wheat</strong><br />
Screening Nursery; ESWYT = Elite Spring <strong>Wheat</strong> Yield Trial.<br />
** <strong>The</strong> selections made from this nursery, were only at Buhweju where there was no disease pressure.<br />
Otherwise, at Kalengyere all the 50 entries were highly susceptible to yellow rust.<br />
%<br />
s~lections<br />
212
,<br />
Breedingfor disease resistance in wheat in Uganda - Wagoire<br />
I<br />
Table 2. Means for yellow rust coefficients of infection and grain yield (g m- 2 ) for F1S and F2S of a complete 8 x 8 diallel at <br />
Kalengyere during 1995B and 1996A. <br />
Yellow rust s'Core"{CI)<br />
Graih yield·(g m- z )<br />
r <br />
PIs F2s . F-ls _ - F2s.<br />
, .~<br />
'. ~~.<br />
~ _-0, I<br />
1995B 1995B 1996A 199'SB ",- ". 1999B 1996A<br />
I Cross N FT NT FT. NT,· FT NT . FT -I' .NT ,..- Fl; NT FT NT<br />
~R-· 16 0.13 1.54 0.15 2.30 0.71 2.29 415.3 146.6 212.2 56.3 215.2 134.8<br />
,<br />
,<br />
RxS 32 1.76 13.67 1.02 16.28 1.48 10.26 403.4 . 128.5 211.4 50.6 201.3 89.1<br />
,<br />
SxS 16 5.51 69.04 2.76 65.62 7.20 59.60 362.2 55.7 174.5 23.3 175.9 40.3<br />
i<br />
, ,<br />
i<br />
L.S.Doo5 10.59 20.41 4.56 15.83 9.92 22.28 195.2 96.4 163.0 70.1 150.5 100.0 !<br />
F-test *** *** *** *** *** *** ns *** *** ***<br />
I<br />
N = Number of means to calculate group means; FT = Fungicide treated; NT = Not treated with fungicide; ns = not significant;<br />
* = p < 0.05; ** = p < 0.01; *** = p < 0.001.<br />
I<br />
213
Breedingfor disease resistance in wheat in Uganda - Wagoire<br />
Table 3.<br />
Yield gains and losses at Kalengyere.<br />
Generationl<br />
% loss due to<br />
% gain from<br />
Season AFD AFD-YR YR YR resistance<br />
F}95B 85 65 20 148<br />
F295B 87 73 14 125<br />
F296A 77 37 40 141<br />
Mean 83 58 25 138<br />
AFD = All foliar diseases.<br />
YR = Yellow rust.<br />
Table 4.<br />
Test lines which were sampled for stem rust biotype identification.<br />
PCYRlLR<br />
Stem rust<br />
No. Cross and Selection H1storr reaction<br />
223 PVNIICAR422/ANN3IKAUZ*2/TRAP//K 60S<br />
CG62-099Y -099 M-3 Y -2M-4 Y -OB<br />
269 PVNIICAR4221ANN5IBOW/CROWIIBU 5MS<br />
CG65-099Y-099M-8Y-6M-4Y-OB<br />
297 PVNIYACO/3IKAUZ*2/TRAPIKAUZ 80S<br />
CG68.:099Y-099M-22Y-2M-3Y-OB<br />
298 PVN/YACO/3IKAUZ*2/TRAPIKAUZ 90S<br />
CG68-099Y -099M-22Y-2M-2Y-OB<br />
359 CAR422/ANNIPBW65/3IKAUZ*2/TRAPIIKAUZ 2S<br />
CG90-099Y -099M-14 Y -4 M -5Y-OB<br />
365 CAR422/ANNIPBW65/3IKAUZ*2/TRAPIIKAUZ 60S<br />
CG90-099Y -099M-39Y-4M-l Y-OB<br />
378 TRAP#llYACOIIBAV92 80S<br />
CG94-099Y-099M-16Y-IM-5Y-OB<br />
214
Breedingfor disease resistance in wheat in Uganda - Wagoire<br />
Table 5. Ten lines with very good resistance to stem and yellow rust during 1999<br />
season B.<br />
No. NamelPedigree<br />
.,' , ~<br />
1 SNIfPBW65/3/KAUZ*2/TRAP//KAUZ<br />
..<br />
"<br />
, Source<br />
PCYRlLR-1 19<br />
Stem rust<br />
score<br />
'<br />
TR<br />
, Yellow<br />
rust score<br />
2MR<br />
CG36-099Y -099M-27Y -3M-5Y -OB<br />
2 SNIIPBW65/3/KAUZ*2/TRAPllKAUZ<br />
CG36-099Y -099M-32Y-3M-5Y-OB<br />
3 HD228I1TRAP# 1/3/KAUZ*2/TRAP//KAUZ<br />
CG50-099Y -099M-22Y-2M-5Y-OB<br />
4 PVN/PBW65/3/KAUZ*2ITRAP/KAUZ<br />
CG74-099Y -099M-20Y-3M-4Y-OB<br />
5 TRAP#1IYACO/3/KAUZ*2/TRAPI/KAUZ<br />
CG96-099Y-099M-39Y-3M-l Y-OB<br />
6 TINAMOU<br />
CM81812-12Y -06PZ-5Y-5M-OY-3AL-OY-8SJ-OY<br />
7 MILAN/SHA7<br />
CM97550-0M-2Y -030H-3Y-3Y-OY-1 M-01 OY<br />
OFU ...<br />
8 NG831911SHA4/LIRA<br />
CMBW90M2302-6M-OIOM-010Y-015M-6Y-OM<br />
9 THB/CEP77801ISHA4/LIRA<br />
CMBW90M2456-9M-010M-010Y-015M-10Y-OM<br />
10 DRL9127<br />
CMI04628-0M-17U-51 Y-3U-OU<br />
PCYRlLR-149<br />
PCYRlLR-185<br />
PCYRlLR-307<br />
PCYRlLR-421<br />
9HRWSN-24<br />
9HRWSN-71<br />
9HRWSN-98<br />
9HRWSN-102<br />
9HRWSN-132<br />
T 5MS<br />
TR 2MR<br />
TR 2MR<br />
TR lOMS<br />
5MS 0<br />
TMR 2MR<br />
TMR TMR<br />
5MR 0<br />
10MR TMR<br />
215
SPATIAL TOOLS FOR WHEAT RESEARCH <br />
IN EASTERN AND SOUTHERl~ AFRICA <br />
D.P. Hodsonl, J.W. White!, lD. Corbett 2 and D.G. Tanner 3<br />
'Natural Resources Group, CIMMYT, Mexico <br />
2CAAG, BlacklandResearch & Extension Center, Temple, Texas <br />
3CIMMYT/CIDA <strong>Eastern</strong> Africa Cereals Program, P.O. Box 5689, Addis Ababa, Ethiopia <br />
ABSTRACT<br />
<strong>The</strong> evaluation of spatial variation in environment is as important for wheat<br />
research and extension as for any other agricultural discipline. In the past,<br />
access to spatial information tools or spatial data sets has been limiting <br />
largely due to reasons of cost and lack of expertise. As a result, geographical<br />
information systems (GIS) have not achieved the expected impact. This paper<br />
describes a new generation of spatial decision support tools, coupled to spatial<br />
data sets, that have been developed by the Characterization Assessment<br />
Applications Group (CAAG) at Blackland Research and Extension Center,<br />
Temple, Texas and the Natural Resources Group, CIMMYT, Mexico. <strong>The</strong>se<br />
tools, namely the Africa Country Almanac and the Africa Maize Research<br />
Atlas, aim to make geography both practical and accessible to researchers at<br />
all levels. Various examples are described for applications of these tools to<br />
wheat-related research within sub-Saharan African. In Ethiopia, the Africa<br />
Country Almanac was used to characterize potential new production areas for<br />
wheat, based on agro-climatological parameters. This study had several<br />
outputs: a refinement of the current distribution of wheat production areas;<br />
identification of possible priorities for breeding programs to permit expansion<br />
into new areas; and an assessment of the representativeness of existing wheat<br />
research stations. At the regional level, the Africa Maize Research Atlas<br />
permitted the identification of potential areas for the transfer of materials,<br />
technologies, or information from an existing important wheat research<br />
station. <strong>The</strong> tools described represent entry-level GIS systems that permit non<br />
GIS experts to analyze and interpret spatial data. <strong>The</strong>y are also intended to<br />
improve spatial awareness amongst researchers, permitting more efficient use<br />
of higher level GIS resources.<br />
INTRODUCTION<br />
Geographical information systems (GIS) - that is computerized systems for displaying,<br />
analyzing and managing spatial data - offer great potential to improve resource efficiency<br />
within agriculture. Spatial variation in environment is as important to wheat research and<br />
extension as for any other agricultural discipline. Despite this importance, widespread use of<br />
spatial tools and data sets amongst wheat researchers is limited. Factors that have historically<br />
restricted the application of GIS include: the high cost of computer hardware and software,<br />
limited availability of digital spatial data, and the need for highly trained personnel to operate<br />
the GIS. Advances in computer hardware and software technology have permitted the<br />
development of accessible, user-friendly spatial decision support tools that aim to minimize<br />
216
Spatial tools/or wheat research - Hodson et al.<br />
these barriers to the effective use of GIS. This paper describes two user-friendly spatial<br />
decision support tools that have been developed specifically to assist researchers within the<br />
sub-Saharan Africa region.<br />
Collaboration between CIMMYT's Natural Resources Group and the Characterization,<br />
Assessment and Applications Group (CAAG) at the Blackland Research and Extension<br />
Center (Temple, Texas) has resulted i.n advanced spatial tools being developed, and made<br />
accessible, to researchers in the African region. <strong>The</strong> first of these tools, namely the Africa<br />
Country Almanac (Corbett et at., 1999), represents one of the most advanced stand-alone<br />
spatial decision support tools available in the world. <strong>The</strong> second tool, the Africa Maize<br />
Research Atlas (Hodson et at., 1999; 2000), relies on freely available but commercially<br />
produced software (ArcExplorer, from Environmental Systems Research Institute, Inc.) to<br />
provide access to digital spatial data. A key concept behind both the Africa Country Almanac<br />
and the Africa Maize Research Atlas is that they should represent much more than simple<br />
software packages. In this context, both systems come pre-loaded with data sets that are<br />
targeted particularly to the needs of researchers in agriculture and natural resource<br />
management.<br />
Accessibility is a key factor in the successful adoption of any new technology. A<br />
considerable amount of effort has been made to make the spatial tools described here as<br />
accessible as possible to researchers and decision-makers who are not GIS-experts. Simple<br />
intuitive user interfaces, incorporating a familiar "Microsoft Windows point and click<br />
approach", have been utilized (Fig. 1) with the aim of making these systems as accessible as<br />
spreadsheets. Experience has shown that even with a minimal amount of training - in the<br />
order of two days - complete novices to the area of GIS can grasp the fundamentals of these<br />
systems and start applying them. Prohibitive costs are another barrier to widespread<br />
accessibility, but the tools described here are currently being made available at minimum cost<br />
to bona fida researchers for non-profit uses.<br />
As for any technology, unless practical applications are found, a GIS tool will be of limited<br />
value. <strong>The</strong> GIS tools described in this paper are no exception. Several real world examples of<br />
the application of these systems to agricultural problems, particUlarly related to wheat<br />
systems, are described. <strong>The</strong>se include the investigation of potential areas for the expansion of<br />
wheat production within Ethiopia, facilitating the transfer and exchange of material,<br />
technology, and/or information from existing wheat research stations, and assisting in the<br />
efficient use of resources through effective targeting.<br />
<strong>The</strong> tools described here represent "entry-level" GIS applications, and as such have an<br />
important role to play in GIS capacity building or raising spatial awareness. Many institutions<br />
now have access to advanced GIS systems that are managed by GIS specialists. However, for<br />
a GIS laboratory to provide effective support, it must have access to collaborators who are<br />
aware of the potential applications of GIS to their work. In addition, having simple low-cost<br />
systems through which the outputs of advanced spatial analysis can be widely distributed is<br />
also vital. "Entry-level" applications, such as the Africa Country Almanac and the Africa<br />
Maize Research Atlas, therefore, have an additional role to play in awareness building that<br />
goes beyond being gateways to spatial information.<br />
217
Spatial tools for wheat research - Hodson et al.<br />
DESCRIPTION OF THE TOOLS<br />
Africa Country Almanac<br />
<strong>The</strong> Africa Country Almanac represents one of the most advanced examples of a new<br />
generation of spatial decision support tools. It has been developed by the Characterization,<br />
Assessment and Applications Group (CAAG) at the Blackland Research and Extension<br />
Center, Temple, Texas (part of the Texas A&M University System) in collaboration with the<br />
Natural Resources Group at CIMMYT. <strong>The</strong> Almanac is a stand-alone CD-ROM-based spatial<br />
decision support tool that provides decision-makers with an integrated set of spatial tools,<br />
data, and documents for a particular geographical region.<br />
a: D~ CuRUfoi<br />
tt: rJ§Z) Inhaslr\JCtlMe<br />
~ ~0 Political<br />
. r~ 'D ~ Provnce 801.«'ld0lies <br />
~"LJ ImI O;,trict 8ound.Yie, <br />
i!J &iJ!:ID IiI!II'I<br />
ffi {l5'il Sma! cooslol islands<br />
, !j} D llliJ Politico! BoondaJY (ino)<br />
m0llliJ Politicol Bound.oIy (po~)<br />
!tl DB DemoglopRc<br />
[;j CI6J Edaphic<br />
[ij 0 0 Ecolooicol<br />
(tj 0 151 Nc5tura! ResoUfces<br />
:B D O Hydlog'",,"c<br />
ill 0 8 Data QUdkty<br />
~ [Jrra Ag,icult..o!<br />
iii J "10 T opog.aphic<br />
~ D8J C~""tic<br />
",DriB 0'"<br />
Figure 1. Africa Country Almanac Graphic User Interface.<br />
<strong>The</strong> software development team, at the Blackland Research and Extension Center, built the<br />
Almanac using a combination of Map Objects (ESRI) and Visual Basic (Microsoft). This<br />
permits a wide range of functionality and flexibility to be incorporated into the Almanac,<br />
giving users a tremendously powerful but simple spatial decision support tool. <strong>The</strong> Almanac<br />
has been designed to be essentially an open system, and for this reason standard file formats<br />
have been used throughout. All geographical data are stored in ESRI shapefile format<br />
(probably the most common GIS file format), all databases are in Microsoft Access format (a<br />
widely used database file format), and all documents are in PDF format. This use of common<br />
formats greatly facilitates the exchange of images, graphs, and tables between the Almanac<br />
218
Spatial tools for wheat research - Hodson et al.<br />
and external software. It also makes the importation of additional data by the user relatively<br />
simple.<br />
<strong>The</strong> main areas of functionality that have been built into the Almanac include:<br />
Spatial Data Display<br />
A map can be created from any spatial data within the Almanac. <strong>The</strong> system is extremely<br />
flexible in terms of how data are displayed. Users may select colors, line styles, and fill<br />
patterns to create a fully customized map. <strong>The</strong>re is no limit to how many different data layers<br />
can be displayed so it is possible to visually explore spatial interactions between different<br />
data sets. Any map created in the Almanac is easily exported into external software packages,<br />
including word processing or imaging software, for use in a report or presentation.<br />
Spatial Data Query<br />
As the Almanac is a true GIS and not merely an image processor, complete attribute<br />
databases are linked to the data themes. This means that any existing data for a point or<br />
polygon can be retrieved or queried. This information can be displayed in tabular or graph<br />
format and exported into external software packages.<br />
Characterization<br />
Characterization is a core function of the Almanac. It can be used to describe areas based<br />
upon their biophysical, social, and econo~ic characteristics, or to search for areas that f
Spatial tools for wheat research - Hodson et al.<br />
Additional Modules<br />
Due to the underlying object-orientated programming used to construct the Almanac, the<br />
addition of extra functionality in modular fonn is possible. Currently, the Almanac contains<br />
two such additional modules that expand the basic functionality.<br />
(i) Database Query<br />
<strong>The</strong> Crops Database module incorporates powerful database query tools into the Almanac.<br />
<strong>The</strong>se facilitate the rapid and easy retrieval of information from Microsoft Access databases.<br />
As an example, all of the CIMMYT elite maize variety trial data for Africa have been<br />
incorporated into the Almanac, and these data may be queried in several different ways.<br />
(ii) Access to Meteorological Station Data<br />
<strong>The</strong> Weather Reporter module pennits access to daily meteorological station data. As an<br />
example, all of the data from World Meteorological Organization (WMO) stations throughout<br />
Africa have been incorporated into the Almanac. <strong>For</strong> a particular station, and any specified<br />
time period, precipitation and temperature data can be accessed in graphical or tabular<br />
fonnat. <strong>The</strong> Weather Reporter is a useful tool with which to assess climate variability within<br />
different regions.<br />
Africa Maize Research AtlaslEast and Central Africa Maize Research Atlas<br />
<strong>The</strong> Africa Maize Research Atlases, developed by the Natural Resources Group and the<br />
Maize Program at CIMMYT, represent digital atlases of spatial data complete with a simple<br />
GIS data exploration tool. <strong>The</strong> original Atlas covered the whole of sub-Saharan Africa<br />
(everything south of 15° N latitude), including a special focus on the SADC region of<br />
southern Africa. <strong>The</strong> same concept was used to produce the East and Central Africa version,<br />
but this version is focused on nine countries within the east and central Africa region.<br />
<strong>The</strong> GIS data exploration tool incorporated into the Atlases is ArcExplorer. This software<br />
was developed by ESRI, but is freely available over the' internet [www.esri.com] with no<br />
restrictions on distribution. <strong>The</strong>se factors, coupled with functionality and ease of use, made<br />
ArcExplorer an ideal tool to incorporate into these entry-level GIS packages. <strong>The</strong> use of<br />
ArcExplorer pennits the inclusion of ready-made digital maps, tenned "projects", which<br />
allow users to view important data sets in a clear and meaningful way. Numerous examples<br />
of these "projects" are included, which can be used in either a stand-alone manner or as the<br />
starting point for further investigation.<br />
<strong>The</strong> overall aim of these packages was to make as much useful spatial infonnation as possible<br />
available to researchers in an accessible fonn. <strong>The</strong> data content has focused on themes<br />
relevant to agriCUlture or natural resources management, so infonnation on climate, soils,<br />
elevation, land use, and population have been included. Although both products have been<br />
named Maize Research Atlases, this is something of a misnomer as in fact they represent very<br />
generic tools aimed at fostering a better understanding of environments (i.e., the naming is<br />
more closely linked to resourcing than functionality). Climate similarity maps for important<br />
maize and wheat research stations throughout sub-Saharan Africa are a major component of<br />
the Atlases (see Fig. 6 for an example). Over one hundred research stations have been<br />
included. <strong>The</strong> similarity maps identify potential areas where efficient transfer of materials,<br />
220
Spatial tools Jor wheat research - Hodson et at.<br />
technology and information within the region may be possible. <strong>The</strong>se maps are particularly<br />
suited for use within projects that have a regional focus.<br />
Overall, the Atlases aim to provide a wealth of easily accessible spatial data compiled within<br />
a single source. This should enable researchers to explore and characterize the environments<br />
in which they are working in a much simpler and faster way than was previously possible.<br />
APPLICATIONS OF THE SPATIAL TOOLS<br />
Numerous applications of the spatial tools outlined in this paper already exist, but the focus in<br />
this section will be on those related to areas of wheat research. In each of the examples<br />
described below, it should be stressed that researcher input was by far the most important<br />
factor. It is the wheat researcher who knows the climatic parameters that make the most sense<br />
for a particular region, not the GIS expert!<br />
Example One: Characterization of Potential <strong>Wheat</strong> Expansion Zones in Ethiopia<br />
A detailed account of this work can De found in White et al. (in preparation), and only a brief<br />
overview of the study and the major findings will be presented here.<br />
This study was conducted almost exclusively by utilizing the tools and data sets contained<br />
within the Ethiopian Country Almanac. <strong>The</strong> overall objective was to respond to a request<br />
from the Directorate of EARO to explore the possibilities for expanding the wheat production<br />
zone within Ethiopia into new areas. <strong>The</strong> underlying rationale behind this is that Ethiopia<br />
falls short of being self-sufficient in wheat production, and is currently a net importer of<br />
wheat grain. Although there is significant"' scope for yield improvement within traditional<br />
wheat production areas, interest has been expressed in the possibility of expanding wheat<br />
production into non-traditional areas. Obviously, from a planning and resource mobilization<br />
viewpoint, such a strategy raises numerous questions. If potential new areas do exist, then<br />
what are their characteristics? Where are they located? What problems are likely to be<br />
encountered? What are the likely breeding strategies that will have to be employed? What are<br />
the likely gains in area? <strong>The</strong> tools and data offered by the.Africa Country Almanac, although<br />
not a "cure-all", can greatly assist in this decision-making process.<br />
Climatic characterization of the existing wheat zone indicated that preCipitation and<br />
minimum temperature during the wettest quarter (i.e., the three consecutive wettest months)<br />
were the key determinants of potential wheat areas. Using a lower limit of 350 mm for<br />
precipitation and a minimum temperature range between 6 and 11°C, coupled to a season<br />
length of no more than 9 months, resulted in a distribution that matched closely published<br />
sources of traditional wheat areas (as depicted in Belay et al., 1999) and local expert<br />
knowledge (Fig. 2). Further independent confirmation of the accuracy of this zone was<br />
obtained from the distribution of bread wheat germplasm collection sites in Ethiopia derived<br />
from the USDA GRIN online database (USDA-ARS-NGRP, 2000) - nearly all locations fell<br />
within this derived zone.<br />
Having determined the climatic factors that accurately described the current wheat production<br />
areas of Ethiopia, it was then possible to explore options for potential areas for expansion.<br />
Considering that water deficits and warm night temperatures appeared to be key factors<br />
delimiting bread wheat production in Ethiopia, potential new areas for bread wheat<br />
production were identified by assuming that technologies could be developed to allow wheat<br />
221
Spatial tools for wheat research - Hodson et al.<br />
to be grown in drier or warmer environments. Lowering the minimum rainfall limit to 300<br />
mm within the wettest quarter resulted in a very small expansion to the wheat production<br />
zone (Fig. 3). Conversely, raising the minimum temperature limit by 2 °C resulted in a virtual<br />
doubling of the potential wheat area on the periphery of the highlands (Fig. 4). <strong>The</strong>se "new"<br />
areas fall roughly in the 1900-2100 m altitudinal range - lower than the traditional wheat<br />
areas.<br />
, . ""' ,<br />
"<br />
.,, 0.,,9 •<br />
~<br />
Figure 2. Current major wheat production area in Ethiopia based on the map depicted<br />
in Belay et ai. (1999), and predicted wheat distribution area based on climatic factors<br />
(Le., wettest quarter precipitation> 350 mm, minimum temperature from 6-11 °C, from<br />
White et ai. (in preparation)).<br />
<strong>The</strong>se results may seem counter-intuItIve given the popular conception of Ethiopia as a<br />
drought-prone, arid environment. <strong>The</strong> princi pal explanation is that in terms of wheat cropping<br />
- and ignoring year to year variation - the highlands of Ethiopia, to which the wheat crop is<br />
so well-adapted, represent a relatively humid environment. Precipitation during the wettest<br />
three months is usually well in excess of Potential Evapotranspiration.<br />
It is important to note that this study relied solely on climatic variables. Other factors (e.g.,<br />
soils, topography, socio-economic, and existing crop distribution) will further restrict the area<br />
where wheat can be grown. However, the results do provide useful input to the decisionmaking<br />
process. If a large expansion in the geographical area of wheat production is desired,<br />
222
Spatial tools for wheat research - Hodson et al.<br />
then focussing breeding efforts on developing wheat lines with improved tolerance of heat<br />
and/or the diseases associated with wanner conditions (e.g., Helminthosporium sativum)<br />
appears to make more sense than targeting the development of drought tolerant gennplasm.<br />
Figure 3. Potential wheat expansion zone resulting from lowering the wettest quarter<br />
precipitation value to 300 mm.<br />
Example Two: How Representative are Existing Experimental Stations<br />
of the Current Ethiopian <strong>Wheat</strong> Production Areas?<br />
This was another facet examined by the White et al. (in preparation) study described above in<br />
example one. Climate similarity maps were generated for eight key wheat research sites used<br />
by the National <strong>Wheat</strong> Research Program of Ethiopia. To generate these maps, climatic data<br />
from the experimental sites were used as inputs and zones were generated to represent a<br />
range based on the site values (+/- 50 mm for precipitation and evaporation, +/- 1 °C for<br />
maximum and minimum temperature). <strong>The</strong>se similarity zones were then compared to the<br />
wheat production area. Once again, the Ethiopia Country Almanac was used to carry out this<br />
work.<br />
<strong>The</strong> results showed that existing research centers represent most of the Ethiopian wheat<br />
production zone and exhibited little overlap between stations, i.e., no two stations covered the<br />
223
Spatial toolsjor wheat research - Hodson et at.<br />
same specific climatic conditions (Fig. 5). <strong>The</strong> implication of these results was that the<br />
existing wheat research stations in Ethiopia are well located - being both representative and<br />
exhibiting little duplication of environments.<br />
Figure 4. Potential wheat expansion zone resulting from raising the upper limit of<br />
minimum temperature during the wettest quarter to 13· 0c.<br />
Example Three: Identification of Potential Transfer Zones for Technology<br />
from the Kulumsa Experimental Station, Ethiopia<br />
<strong>The</strong> Kulumsa research station is widely recognized as a center of excellence for bread wheat<br />
research within the region. This station already actively collaborates in regional networks, but<br />
the question was asked: Are there other areas where the transfer of materials, technologies or<br />
information to and from Kulumsa may be appropriate? <strong>The</strong> climate similarity maps contained<br />
within the Africa Maize Research Atlas were used to address this question at the regional<br />
level.<br />
<strong>The</strong> results highlighted the climatic similarity of Kulumsa to most of the major wheat<br />
producing regions in eastern Africa (Fig. 6), and support the pivotal role in regional networks<br />
that Kulumsa is providing. One surprise finding was that a significant area in eastern South<br />
Africa exhibited climatic similarity to Kulumsa, yet this was not a wheat producing region.<br />
This prompted an investigation into what additional factors were involved in this particular<br />
224
Spatial tools for wheat research - Hodson et al.<br />
region. It was discovered that several factors were involved, including difficult terrain, wheat<br />
not being a crop of choice for traditional small-holders, and high levels of commercial<br />
production in south-western areas. This example highlights the fact that factors, including<br />
socio-economic issues, must also be considered when examining crop distributions .<br />
••<br />
dekelle<br />
. •<br />
;.<br />
•<br />
••<br />
.. <br />
• Weldiya<br />
--.<br />
.<br />
:'.' :. i<br />
"<br />
.', .<br />
f<br />
. . "r-•• ... _ --,.<br />
~ ..<br />
, _ .....~<br />
~.~.. ~-.<br />
'~" :.r<br />
,&~~.:<br />
I,.. <br />
.'<br />
~?~~~:.~. ..ebreZe~tl<br />
.. , r' Kulum~ ...'7<br />
,:1' '" r ,,1' "..-:: f<br />
" ! ...~',Be:t..'l"'~ r<br />
- , ~ "- , .. :'"_. - r<br />
~ I·.t ..,......<br />
• . I. . }<br />
.'<br />
-<br />
,<br />
. - .-.. Sin ana<br />
I<br />
. ..-1 r ••<br />
'. ..- :::- ..<br />
. -.<br />
Figure 5. Climatic similarity zones for existing wheat research centers in Ethiopia.<br />
.'<br />
.'<br />
Example Four: Effective Targeting of Marketing Activities<br />
by a Private Seed Company in Zimbabwe<br />
<strong>The</strong> final example of an application of the spatial tools is not a wheat example, but the<br />
principle it outlines is certainly applicable to wheat.<br />
SeedCo, one of the largest private seed companies in Zimbabwe, applied the tools and data<br />
sets of the Zimbabwe version of the Africa Country Almanac in order to target marketing<br />
activities for a newly released groundnut variety. By generating similarity zones to testing<br />
locations, SeedCo was able to effectively determine the adaptation zones within Zimbabwe<br />
for the new variety. Marketing activities were then focused on these regions. Utilization of<br />
225
Spatial tools for wheat research - Hodson et af.<br />
such a strategy obviously makes sense in economic terms, representing significant cost<br />
savings for the company, and more effective marketing is a likely outcome .<br />
•<br />
Climate similarity zone for i
Spatial tools for wheat research - Hodson et al.<br />
laboratory to provide effectl ve support, it must have access to collaborators who are aware of<br />
the potential application of GIS to their work.<br />
Examples of the types of more advanced analyses that have been undertaken by the GIS<br />
laboratory at CIMMYT have included:<br />
• Modeling the risk of drought within' the SADC region, both spatially and quantitatively,<br />
during different maize development stages.<br />
• Selecting survey locations - based on homogeneous agro-ecological zones (generated by<br />
cluster analysis) with random points assigned within these zones. Such an approach<br />
resulted in truly representative survey locations, making survey results valid for larger<br />
defined regions. Due to the ability of GIS to handle exact map projections and scales, it<br />
was simple to transfer locations from "screen to field" by printing onto commercial<br />
topographic maps that could then be used in the field (Hodson et at., in preparation).<br />
• Hydrological modeling of a new experimental station to assist the planning and design<br />
process.<br />
None of these applications would have been possible without collaborators who had some<br />
awareness of what a GIS could do. In all cases, it has been possible to incorporate the results<br />
of these more advanced analyses into simple stand-alone systems as described in this paper.<br />
<strong>The</strong> results are then available and can be distributed amongst a wide range of researchers.<br />
CONCLUSION<br />
<strong>The</strong> spatial tools described in this paper represent a new generation of spatial decision<br />
support systems. <strong>The</strong> old barriers to effective use of GIS by agricultural scientists, namely<br />
cost, complexity and data availability, are now being broken down with tools such as the<br />
Africa Country Almanac and the Africa Maize Research Atlas. <strong>The</strong>se tools provide<br />
researchers with powerful, yet simple to use, spatial tools and data sets, making access to<br />
digital spatial data relatively simple.<br />
Several examples are described of how these tools have already been applied to address<br />
wheat-related research questions within eastern and ~outhern Africa. <strong>The</strong>se examples<br />
illustrate how a better understanding and characterization of the geographic environment can<br />
lead to improved input into decision-making processes, and, ultimately, to more efficient use<br />
of resources.<br />
<strong>The</strong> importance of these tools to develop an improved spatial awareness amongst researchers<br />
was also highlighted. <strong>The</strong> stand-alone spatial tools described in this paper, although very<br />
powerful, will not permit every possible type of spatial analysis. However, once researchers<br />
have been exposed to spatial data and tools, they should then be in a much better position to<br />
exploit more advanced GIS services. <strong>The</strong> tools described in this paper also provide ideal<br />
vehicles by which the results of complex analyses can be distributed widely amongst<br />
researchers.<br />
ACKNOWLEDGMENTS<br />
<strong>The</strong> authors gratefully acknowledge Environmental Systems Research Institute, Inc. for<br />
software support.<br />
227
Spatial tools for wheat research - Hodson et al. <br />
REFERENCES <br />
Belay Simane, D.G. Tanner, Amsal Tarekegene and Asefa Taa. 1999. Agro-ecological decision support systems<br />
for wheat improvement in Ethiopia: climatic characteristics and clustering of wheat growing regions.<br />
African Crop Science Journal 7: 9-19.<br />
Corbett, J.D., S.N. Collis, B.R. Bush, E.!. Muchugu, R.Q. Jeske, R.A. BUlton, R.E. Martinez, lW. White and<br />
D.P. Hodson. 1999. Almanac Characterization Tool. A Resource Base <strong>For</strong> Characterizing <strong>The</strong><br />
Agricultural, Natural, And Human Environments <strong>For</strong> Select African Countries. Texas Agricultural<br />
Experiment Station, Texas A&M University System, BRC Report No. 99-06.<br />
Hodson, D.P., D. Jourdain, B. Triomphe, lW. White and H. Garcia Nieto. In preparation. Application ofGIS to<br />
the Design ofSampling Strategies for Surveys - A Case Study for Farming Practice Surveys in<br />
Guanajuato, Mexico.<br />
Hodson, D.P., A. Rodriguez, lW. White, J.D. Corbett, R.F. O'Brien, and M. Banziger. 1999. Africa Maize<br />
Research Atlas (v.2.0). Mexico, D.F.: CIMMYT.<br />
Hodson, D.P., A. Rodriguez, lW. White, lD. Corbett, A.O. Diallo, and S.N. Mugo. 2000. East and Central<br />
Africa Maize Research Atlas - Africa Maize Stress Project (v.l.O). Mexico, D.F.: CIMMYT.<br />
USDA-ARS-NGRP. 2000. USDA, ARS, National Genetic Resources Program. Germplasm Resources<br />
Information Network (GRIN) {Online Database]. National Gennplasm Resources Laboratory,<br />
Beltsville, Maryland. www.ars-grin.gov/usr/loca1/apache/cgi-binlnpgslhtml/obs.pl?1164702 (07 June<br />
2000).<br />
White, l W., D.G. Tanner and lD. Corbett. In preparation. An Agro-Climatological Characterization ofBread<br />
<strong>Wheat</strong> Production Areas in Ethiopia.<br />
Questions and Answers:<br />
Mamoun Ie Dawelbeit: 1) Does the infonnation cover all the countries in the Region? 2)<br />
What size of computer is required to run this software?<br />
Answer: 1) <strong>The</strong> Country Almanac covers Ethiopia, Kenya, Tanzania, Uganda, Zambia, and<br />
Zimbabwe. <strong>The</strong> Africa Maize Research Atlas covers the whole region from Ethiopia<br />
extending South. <strong>The</strong> East Africa Maize Atlas covers: Sudan, Ethiopia, Kenya, D.R. Congo,<br />
Rwanda, Burundi, Tanzania and Madagascar.<br />
2) Any machine that runs Windows 95, 98 or NT will run either the Almanac or the Atlas.<br />
Recommend Pentium 32 MB RAM as minimum - faster· is better for large countries like<br />
Ethiopia.<br />
228
RESPONSE OF SOME DURUM WHEAT LANDRACES <br />
TO NITROGEN APPLICATION ON ETHIOPIAN VERTISOLS <br />
Teklu Erkossa, Tekalign Mamo, Selamyihun Kidane and Mesfin Abebe<br />
Debre Zeit Agricultural Research Center, P.O. Box 32, Debre Zeit, Ethiopia<br />
ABSTRACT<br />
Landrace durum wheat constitutes one of the major cereals grown on Vertisols<br />
in the central highlands of Ethiopia. <strong>The</strong>ir productivity is limited, among other<br />
factors, by low soil fertility, including nitrogen deficiency. Consequently,<br />
inorganic N fertilization is recorrunended at a rate of 60 to 90 kg N/ha for<br />
improved durum wheat varieties under different cropping systems. However,<br />
little information is available on the differential response of landraces to<br />
applied N. This led to the initiation of a field experiment at two representative<br />
Vertisol locations, Akaki and Cheffe Donsa, in the central highlands. <strong>The</strong><br />
experiment was conducted for three years (1993-1995) on three promising<br />
durum land race genotypes (A2-138, EI-9 and Bl-9 for Akaki, and A2-187<br />
and Bl-9 for Cheffe Donsa). Kilinto and DZ04-118 for Akaki, and DZ0320<br />
and DZ04-118 for Cheffe Donsa were used as local and standard checks,<br />
respectively. Six levels of N (0, 15, 30, ,60, 90 and 115 kglha) were used in<br />
factorial combination with the lanQraces and checks. <strong>The</strong> results showed that<br />
the effects of N rate were significant on both grain and straw yields at both<br />
locations. Differences among the landraces were significant for both grain and<br />
straw yields at Akaki, but only for grain yield at Cheffe Donsa. <strong>The</strong> interaction<br />
effects of landraces by N rates were significant in two out of the three years on<br />
grain and only one out of the three years on straw yield at both locations.<br />
Generally, grain and straw yields increased with N level while the biological<br />
optimum for each was different. <strong>The</strong> landraces tended to have an advantage<br />
over the local and the standard checks in their specific areas of adaptation,<br />
paIiicularly with respect to straw yields. Hence, emphasis should be directed<br />
towards determining the economic optimum rate of N application on Vertisols<br />
for optimum wheat grain and straw production.<br />
INTRODUCTION<br />
On Veliisols of the central highlands, a mixture of several tetraploid wheats which are<br />
suitable for making unleavened bread and pasta products are predominant. <strong>The</strong>y cover about<br />
60% of the total area devoted to wheat production (Hailu, 1991) with mean GY s estimated at<br />
around 1 t ha- I , and hence contribute roughly 10% to the annual cereal production in Ethiopia<br />
(Tesfaye and Getachew, 1991). In recent years, study for the identification of genotypes with<br />
good yield is underway. <strong>The</strong>ir release at their respective original collection sites is hoped to<br />
improve the current poor yields.<br />
With fertilizers becoming impOliant inputs to maximize crop yield and nitrogen fertilizer<br />
being determinant in durum wheat, several N fertilizer trials have been undertaken to<br />
229
Response ofsome durum wheat landraces to nitrogen application - Teklu et al.<br />
determine the optimum levels for economically profitable yields (DZARC, 1988; 1989).<br />
Results indicate that N rates had significant effect on yield up to 230 kg ha- l (Samuel, 1981;<br />
Desta, 1988; Miressa, 1992; Lemma et al., 1992). On the whole, the new high yielding<br />
cultivars have a higher nutrient requirement because of their increased yield potential.<br />
In spite of this, there is as yet little information on the differential fertilizer responses of high<br />
yielding durum wheat lines selected from the Ethiopian landrace population to increasing<br />
rates of N on Vertisols in the central highlands. <strong>The</strong>refore, this study was launched to partly<br />
supply this information.<br />
MATERIALS AND METHODS<br />
A factorial experiment in a randomized complete block design with three replications was<br />
conducted at Akaki and Cheffe Donsa on pellic Vertisols for three main cropping seasons<br />
(1993/94-1995/96). <strong>The</strong> experiment was conducted on flat seedbed of 4 by 4 m using three<br />
promising landrace durum wheat genotypes selected from their respective location.<br />
Consequently, A2-138, EI-9 and BI-9 were selected from Akaki, with Kilinto and DZ04-118<br />
as the local and standard checks, respectively. At Cheffe Donsa, A2-187, AI-138 and BI-9<br />
were the landraces while DZ-320 and DZ04-118, in that order, were the local and standard<br />
checks. <strong>The</strong>se were broadcast at seeding rates recommended for each landrace variety.<br />
Nitrogen levels were 0, 23, 46, 69, 92 and 115 kg N ha- l as urea applied in split; half at<br />
sowing and the other half at full tillering. Fifteen kg P ha- I was uniformly broadcast and<br />
incorporated into the soil at sowing. Grain and straw yield responses were recorded.<br />
RESULTS AND DISCUSSION<br />
Akaki: <strong>The</strong>re were significant differences in both grain and straw yields throughout the three<br />
years due to varieties as well as nitrogen application rates (Tables 1 and 2). <strong>The</strong> interaction<br />
effect between the varieties and N rates, however, was significant in two and one out of the<br />
three years for grain and SY, respectively. <strong>The</strong> results conform to the findings of Miressa et<br />
al. (1992) who reported varietal effect on nitrogen uptake in durum wheat. During the first<br />
year (1993/94), EI-9 gave the highest GY 3504 kg/ha followed by BI-9 and A2-138,<br />
respectively, while the standard check DZ04-118 gave the least GY (2993 kglha). <strong>For</strong><br />
reasons not clear, the highest GY (3662 kg/ha) due to 92 kg N/ha was not significantly<br />
different from 3318 kglha obtained with the application of 23 kg N/ha. Similarly, the GY<br />
obtained with no N fertilizer application was not significantly different from the amount<br />
obtained due to 46 kg N/ha. Further application of N above 92 kg N/ha resulted in slightly<br />
reduced GY. Similar to the GY, EI-9 gave the highest SY followed by BI-9 and A2-138. <strong>The</strong><br />
highest mean SY (5350 kg/ha) was obtained with the application of the highest N (115 kg/ha)<br />
followed by 5338 and 5102 kg/ha obtained with 69 and 92 kg N/ha, respectively, against the<br />
least which was obtained from the no N fertilizer treatment. As opposed to the GY, the<br />
highest N rate did not result in reduced SY. Generally, there was a consistent increase in SY<br />
with increase in N application rates as expected due to the positive role of N on vegetative<br />
growth.<br />
In 1994/95, unlike the previous year, the interaction effect of the varieties and the nitrogen<br />
application rates was significant for both grain and SY. DZ04-118 gave the highest grain and<br />
SY while A2-138 gave the least. <strong>The</strong> highest GY of 2386 kg/ha and SY of 3207 kglha were<br />
obtained with N application rate of 92 kg N/ha, but the GY was not statistically greater than<br />
230
Response ofsome durum wheat landraces to nitrogen application - Teklu et al.<br />
the yields obtained due to 69 kg N/ha. <strong>The</strong>re was a general grain and SY increase with<br />
increase in N application rates up to 92 kg N/ha for all the varieties, confirming the previous<br />
findings (DZARC, 1988, 1990; Miressa et al., 1992). However, the yield of A2-13 8 increased<br />
only up to the maximum of 69 kg N/ha and decreased with further increase in N rates. This<br />
shows the difference in N requirement of the varieties under the same environmental<br />
conditions (Miressa et al., 1992).<br />
During the last year (1995/96), the effects of the landraces and the nitrogen rates in terms of<br />
grain and SY and their interaction on GY were significant. Kilinto, as in the first year, gave<br />
the highest grain and SY but followed by B 1-9 for grain and DZ04-118 for SY. <strong>The</strong>re was<br />
grain and SY increase up to the maximum N application rate except a slight decrease in GY<br />
of A2-138 at the highest rate. Significantly highest grain and SY (2468 and 3403kg/ha,<br />
respectively) were obtained with the application of 115 kg N/ha. All the landraces had a<br />
similar pattern of response to increasing levels ofN.<br />
During the first two years (1993/94 and 1994/95), the landraces, E 1-9 and B 1-9, showed<br />
better performance in terms of SY compared to the local check Kilinto and the other landrace<br />
(A2-138). On the other hand, Kilinto has shown best performance in terms of GY during the<br />
first and the last years. This performance is quite logical since Kilinto is the variety released<br />
for the area. This could also be due to the highest seasonal rainfall of 1993/94 and 1995/96<br />
(Table 5) with its better distribution as compared to the other year. This situation particularly<br />
favored the local check Kilinto, which responded best during the year. Consequently, since<br />
yield is the result of multiple variables, it can be inferred that it is not only N fertilization and<br />
variety that determine crop yield, but also ,the prevailing weather, soil and other<br />
environmental conditions. Crops therefore .. respond to N fertilization best under favorable<br />
environments.<br />
Cheffe DORsa: <strong>The</strong> effect of N application rates was significant on GY (Table 3) and SY<br />
(Table 4) throughout the period of the three years. However, the difference between the<br />
landrace varieties was significant only in GY and not in SY. <strong>The</strong> interaction effect between<br />
the N application rates and the landrace varieties was significant in 1994/95 for grain and SY<br />
but only for GY in 1995/96.<br />
In 1993/94, Al-138 gave the highest GY (2337 kglha) followed by DZ04-118 and Bl-9,<br />
respectively, while DZ-320 gave the least. In Table 3 it is shown that there was no significant<br />
GY increase beyond 69 kg N/ha application and the yield started to slightly drop beyond<br />
92kg N/ha. However, the SY increased from 2010 kglha to 3293 kglha in response to the<br />
increase of N fertilization from 0 to 115 kg N/ha even though there was no significant<br />
difference between the last three higher rates in terms of both grain and SY.<br />
In the second year, there was a significant difference in GY due to the landraces, nitrogen<br />
rates and their interaction while the effect of the landraces on SY was not significant. B 1-9<br />
gave the highest GY followed by DZ 04-118 and A1-I87, respectively. <strong>The</strong>re was a steady<br />
increase in G Y from 783 kglha to 2113 kglha in response to the corresponding increase of N<br />
from 0 to 115 kg. Similarly, the SY increase was from 1140 to 2372 kglha. This confirms the<br />
previous findings Samuel (1981) who reported grain and SY increases of durum wheat grown<br />
on Vertisols. <strong>The</strong> difference in GY due to the varieties, nitrogen application rates and their<br />
interaction was statistically significant in 1995/96. In Table 3 it is shown that B 1-9 gave the<br />
highest GY followed by Al-138 and A2-187, respectively.<br />
231
Response a/some durum wheat landraces to nitrogen application - Teklu et al.<br />
<strong>The</strong>re was a general increase in GY with an increase in N application rates up to the highest<br />
rate for all the varieties except for DZ 04-118, which decreased beyond 92 kg N/ha<br />
application. <strong>The</strong> landraces did not significantly differ in GY among themselves, but were<br />
significantly higher than the local as well as the standard checks, which were in turn not<br />
statistically different from each other. B r-9 gave the highest GY (2350 kg/ha) while DZ 04<br />
118 gave the lowest (2003 kg/ha).<br />
In contrast to the GY, there was no difference in SY among the varieties and their interaction<br />
with N rates. However, there was a significant difference between the SY due to increasing N<br />
application rates. <strong>The</strong> highest SY (4455 kg/ha) was obtained with application of 115 kg N/ha<br />
while the lowest was with no N fertilization.<br />
SUMMARY AND CONCLUSIONS<br />
<strong>The</strong> landrace varieties responded to N application rates differently at both locations.<br />
Considering both grain and SY, they generally increased in response to N application rates of<br />
69 and 115 kg N/ha at Akaki (Fig. 1) and Cheffe Donsa, respectively. Generally, the<br />
landraces tended to have advantage over the local as well as the standard checks in their<br />
specific area of adaptation. This is particularly true with respect to SY.<br />
At Akaki, the landrace variety A2-138 gave its highest possible grain and SY with N<br />
application rate of 69 kg/ha. <strong>The</strong>refore, farmers of the locality may not need to apply beyond<br />
this rate. <strong>For</strong> the other varieties, generally the GY increase was up 92 kg N/ha while the SY<br />
increased with further increase ofN rate. He.flce, when GY is the major economic interest, 92<br />
kg N/ha may be optimum provided it is economically paying. In general, reference should be<br />
made to the performance of each variety under specific environmental conditions.<br />
At Cheffe Donsa, both grain and SY increased significantly up to the maximum N<br />
fertilization rate (115 kg/ha). This is particularly significant for the landraces. <strong>The</strong>refore,<br />
provided it is economical, higher grain and SY can be obtained with higher N rates,<br />
regardless of the variety.<br />
At both locations, generally the yield was low due to the prevailing heavy waterlogging as a<br />
result of the heavy rainfall and low permeability of the nearly saturated Vertisols. <strong>The</strong> use of<br />
improved drainage could increase yield by 50-100% (Abate et al., 1993) under such<br />
conditions. Hence, N fertilization should be combined with surface drainage to achieve<br />
economically and ecologically attainable yield. Since the response to N fertilization can be<br />
affected by the availability of other nutrients such as P, factorial experiments should be<br />
carried out to fine-tune the recommendation.<br />
REFERENCES<br />
Abate Tedla, M.A. Mohamed-Saleem, Tekalign Mamo, Alemu Tadesse and Miressa Duffera. 1993. In:<br />
Tekalign Mamo, Abiye Astatke, K.L. Srivastava and Asgelil Dibabe (eds.). pp. 103-137. Improved<br />
management of Vertisols for sustainable crop-livestock production in the Ethiopian highlands:<br />
Synthesis Report 1986-92. Technical Committee of the Joint Vertisols Project, Addis Ababa, Ethiopia.<br />
Desta Beyene. 1988. Soil fertilizer research on some Ethiopian Vertisols. In: S.C. Jutzi, Haque, r. McIntire, J.<br />
and J.E. Stares (eds.). pp. 223-231. Management of Vertisols in sub-Saharan Africa. Proceedings of a<br />
Conference held at ILCA, 31 Aug. - Sept., 1987. Addis Ababa, Ethiopia.<br />
232
Response ofsome duntm wheat landraces to nitrogen application - Teklu et al.<br />
Debre Zeit Agricultural Research Center (DZARC). 1988. Annual Research Report 1987/88: Debre Zeit,<br />
Ethiopia.<br />
Debre Zeit Agricultural Research Center (DZARC). 1989. Annual Research Report, 1989. Debre Zeit, Ethiopia.<br />
pp.64-69.<br />
Hailu Gebre Mariam. 1991. Bread wheat breeding and genetics research in Ethiopia. In : Hailu Gebre Mariam,<br />
Tanner, D.G. and Mengistu Hulluka (eds.). <strong>Wheat</strong> research in Ethiopia: A historical perspective.<br />
IARICIMMYT.<br />
Lemma Zewdie, Zewdu Yilma, D.G. Tanner and Eyasu Elias. 1992. <strong>The</strong> effects of nitrogen fertilizer rates and<br />
application timing on bread wheat in Bale region ofEthiopia. In: Tanner, D.G. and W. Mwangi (eds.).<br />
pp. 495-502. Seventh <strong>Regional</strong> <strong>Wheat</strong> <strong>Workshop</strong> for <strong>Eastern</strong>, Central and Southern Africa. Nakuru,<br />
Kenya: CIMMYT.<br />
Miressa Duffera, Tekalign Mamo, Mesfin Abebe and Samuel Geleta. 1992. Response of four wheat varieties to<br />
N on highland peJlic Vertisols in Ethiopia. In : Tanner, D.G. and W. Mwangi (eds.). pp. 480-488.<br />
Seventh <strong>Regional</strong> <strong>Wheat</strong> <strong>Workshop</strong> for <strong>Eastern</strong>, Central and Southern Africa. Nakuru, Kenya.<br />
CIMMYT.<br />
Samuel Geleta. 1981. Uptake and response of durum wheat (Triticum durum L.) to nitrogen and phosphorus<br />
fertilization on Koticha and Gonbore soils of Ada plains. M.Sc. <strong>The</strong>sis. Addis Ababa University,<br />
Ethiopia.<br />
Tesfaye Tesemma, Getachew Belay and Demissie Mitiku. 1992. Evaluation of durum wheat genotypes for<br />
naturally waterlogged highland Vertisols of Ethiopia. In: Tanner, D.G. and W. Mwangi (eds.). pp. 96<br />
102. Seventh <strong>Regional</strong> <strong>Wheat</strong> <strong>Workshop</strong> for <strong>Eastern</strong>, Central and Southern Africa. Nakuru, Kenya:<br />
CIMMYT.<br />
Tesfaye Tesemma and Getachew Belay. 1991. Aspects of Ethiopian tetraploid wheat with emphasis on durum<br />
wheat genetics and breeding research. In: Hailu Gebre Mariam, Tanner, D.G. and Mengistu HuJluka<br />
(eds.). <strong>Wheat</strong> Research in Ethiopia: A historical perspective. Proceedings of a workshop held in Addis<br />
Ababa, Ethiopia, lAiCIMMYT.<br />
Questions and Answers:<br />
Wolfgang H. Pfeiffer: <strong>For</strong> many production constraints, we have genetic solutions and<br />
agronomic solutions. You mentioned waterlogging as a major problem. Since many traits<br />
have to be considered in plant improvement, will it be possible to attack the problem through<br />
agronomic measures?<br />
Answer: <strong>The</strong>re are three types of waterlogging problems associated with Ethiopian highland<br />
Vertisols. Out of these, water ponding on the surface can be easily managed by agronomic<br />
measures. <strong>The</strong> other two, high water label and rise in ground water level need more<br />
machinery and area-wide drainage schemes that cannot be handled by individual farmers.<br />
Temam Hussien: You said that as the materials are planted in high altitude areas, stem rust<br />
and leaf rust were not a problem. How about yellow rust?<br />
Answer: <strong>The</strong> disease is there but not at an intensity that limits the yield.<br />
233
Response ofsome durum wheat landraces to nitrogen application - Teklu et ai.<br />
Table 1.<br />
Grain yield of landrace durum wheat as affected by N rates (Akaki).<br />
Nitrogen rates (~g.ha-l)<br />
Year Variety 0 23, 46" . I:' .69 92 115 Mean *<br />
1993/94 A2-138 2799 2830 3173 3455 3653 3043 3159 AB<br />
El-9 3079 3846 2948 3826 3968 3359 3504 A<br />
Bl-9 2836 3510 3369 3875 3585 3637 3469 A<br />
Kilinto 3054 2817 3124 3163 2862 3506 3088 AB<br />
DZ04-118 2484 2817 3124 3163 2862 3506 2993 8<br />
Mean 28S0 c 3318 AB 3220 BC 3S6S AB 3662 A 3410 AB<br />
C.V.(%) = 13.6; LSD(5%) (kg ha- I ) N = 430; V = 420; NxV = NS<br />
1994/95 A2-138 423 864 1979 2243 1933 1633 1512l:l<br />
El-9 894 1321 2210 2162 2472 1953 1835 AB<br />
Bl-9 1003 1641 1229 2174 2189 2516 1792 AB<br />
Kilinto 636 1010 1522 1984 2715 2036 1650 AB<br />
DZ04-118 1051 1507 1631 2294 2621 2459 1927 A<br />
Mean 801 0 1269 c 1714B 2171A 2386 A 2119 A<br />
C.V.(%) = 20.6; LSD(5%) (kg ha'l) N= 367; V= 332; NxV = 611<br />
1995/96 A2-138 1136 1437 1702 2206 2092 2078 1775l:l<br />
El-9 1304 1691<br />
-.<br />
1790 1863 2003 2165 1803 B<br />
Bl-9 1314 1392 1809 2243 2096 2480 1889 B<br />
Kilinto 1289 2090 2043 2687 2805 3072 2331 A<br />
DZ04-118 1044 1545 1832 1936 2035 2545 1823 B<br />
Mean 1217E 1631 D 183S c 2187 B 2206 B 2468 A<br />
C.V.(%) = 10; LSD(5%) (kg ha'l) N = 180; V= 17.5; NxV = 327<br />
* Mean values within the same factor followed by the same letter are not statistically different at 95% <br />
confidence interval. <br />
234
Response ofsome durum wheat iandraces to nitrogen application - Tekiu et ai.<br />
Table 2.<br />
SY of durum landrace varieties as affected by N (Akaki).<br />
- . - .. A ;'., 46 ;." 69~" 92'" '. ,-,11.5- M'e:alt~"<br />
J't,"'"<br />
1993/94 A2-138 3885 3652 4003 5434 5236 5105 4518 AB<br />
E1-9 4144 5043 4830 5619 6032 5052 5120 A<br />
B1-9 3831 5009 4409 5570 5374 6181 5062 A<br />
Kilinto 3206 3452 3537 4087 5317 4843 4074 B<br />
DZ04-118 3627 3294 4283 4800 4730 5568 4384 AB<br />
Mean 3698 B 4090 B 4212 8 5102 A 5338 A 5350 A<br />
C.V.(%) = 13.63; LSD(5%) kg ha" N = 790; V= 781; NxV = NS<br />
1994/95 A2-138 874 1173 2657 3128 2511 2367 2118 B<br />
E1-9 1329 1827 2790 3024 3454 2677 2517 A<br />
B1-9 1589 . 2433 2104 3196 3367 3224 2652 A<br />
Kilinto 1031 1397 1626 2461 3211 2409 2022 B<br />
DZ04-118 1727 2019 2258 3409 3490 3838 2790 A<br />
Mean 1308° 1770 c 2287 B 3044 A 3044 A 2903 A<br />
C.V.(%) = 18.5; LSD(5%) kg ha" N = 421; V = 326; NxV = 764<br />
1995/96 A2-138 1811 2044 2594 3350 3056 3229 2697 AB<br />
E1-9 2104 2234- 2617 2618 2998 3243 2636 B<br />
B1-9 2205 1904 2413 2979 3051 3505 2676 AB<br />
Kilinto 2009 2761 2513 3480 3195 3558 2919 A<br />
DZ04-118 1751 2270 2871 3138 3076 3381 2748 AB<br />
Mean 1976° 2243° 2602 c 3113 8 3075 8 3403 A<br />
C.V.(%) = 10.5; LSD(5%) kg ha" N= 271; V ~ 267; NxV = NS<br />
* Mean values within the same factor followed by the same letter are not statistically different at 95%<br />
confidence interval.<br />
235
Response ofsome durum wheat landraces to nitrogen application - Teklu et al.<br />
Table 3.<br />
Grain yield of durum landrace varieties as affected by N (Cheffe Donsa).<br />
. ' NitfogeD'rates .<br />
(kg ha'l)<br />
. . . , .<br />
Year . 23 · \. '.<br />
.,. Variety 0 ; ~~ 69 92 115 Mean·<br />
1993/94 A2-187 1749 1820 1800 2182 2327 2216 2015 8<br />
A1-138 1883 2257 2039 2795 2580 2468 2337 A<br />
BI-9 1620 2168 2296 2147 2420 2590 2207 A8<br />
DZ-320 1350 1534 1209 1869 2180 2145 1714 c<br />
DZ04-118 1499 1925 2109 2487 2510 2391 2154 8<br />
Mean 1620 c 1941 B 1890 B 2296 A 2403 A 2362 A<br />
C.V.(%) = 12.8; LSD(5%) (kg ha'I); N = 252; V = 248; NxV = NS<br />
1994/95 A2-187 679 1080 1470 1603 1380 2155 1394 A<br />
AI-138 654 1285 1207 1774 2155 2360 1573 A<br />
BI-9 883 864 1310 1593 1734 1941 1386 AB<br />
DZ-320 769 1125 . 1136 1500 1847 1949 1388 8<br />
DZ04-118 933 1099 1257 1216 1775 2158 1406 8<br />
Mean 783 F 1091 E 1276 0 1537 c 1778 B 2113 A<br />
C.V.(%) = 13.7; LSD(5%) (kg ha·I);<br />
N = 242; V = 182; NxV = 535<br />
1995/96 A2-187 2180 1216 1795 2173 2364 3170 2206 A<br />
AI-138 2599 1478 1929 2364 2547 3109 2338 A<br />
BI-9 1847 1791 2050 2525 2867 3021 2350 A<br />
DZ-320 1234 1444 1699 2204 2558 2900 2006 8<br />
DZ04-118 1174 1505 1780 2220 2700 2637 2003 8<br />
Mean 1806 D 1487 B 1851 0 2297 c 2674 8 2967 A<br />
C.V.(%) = 7.6; LSD(5%) (kg ha'I); N = 167; V = 162; NxV = 774;<br />
. ..<br />
Mean values wlthm the same factor followed by the same letter are not statistically different at 95%<br />
confidence interval.<br />
236
Response ofsome durum wheat landraces to nitrogen application - Teklu et al.<br />
Table 4.<br />
SY of durum wheats landrace varieties as affected by N (Cheffe Donsa).<br />
, '. Ne I ' ': d·.';~ ·J'. ~· .:. 1<br />
. ltr.oge~ , rates)(
Response ofsome durum wheat landraces to nitrogen application - Teklu et al.<br />
4500<br />
4000<br />
3500 .<br />
3000<br />
..<br />
.
-AGRONOMIC AND ECONOMIC EVALUATION <br />
OF THE ON-FARM NAND P RESPONSE OF BREAD WHEAT <br />
GROWN ON TWO CONTRASTING SOIL TYPES IN CENTRAL ETHIOPIA <br />
Amsal Tarekegne 1 , D.G. Tanner2; Taye Tessema 3 and Chanyallew Mandefro 1<br />
1Holetta Research Center (EARO), P.O. Box 2003, Addis Ababa, Ethiopia<br />
2CIMMYT/CIDA <strong>Eastern</strong> Africa Cereals Program, P.O. Box 5689, Addis Ababa, Ethiopia<br />
3Ambo Research Center (EARO), P.O. Box 2003, Addis Ababa, Ethiopia<br />
ABSTRACT<br />
Nutrient deficiency is one of the major constraints to wheat (Triticum spp.)<br />
production in Ethiopia. A multi-location on-farm Nand P fertilizer trial was<br />
conducted during the 1995 and 1996 cropping seasons in a poorly drained<br />
Vertisol zone, using an improved drainage technique, and in a highlyweathered<br />
reddish-brown Nitisol zone in the central highland of Ethiopia. <strong>The</strong><br />
objectives were to determine yield and yield component response of a<br />
recently-released, high-yielding bread wheat (T aestivum) cultivar to applied<br />
nitrogen (N) and phosphorus (P) rates, and to generate zone-specific,<br />
economically-optimal Nand P recommendations for wheat production in<br />
central Ethiopia. <strong>The</strong> results from the combined analyses for each zone<br />
indicated a highly significant yield response to fertilizer application. <strong>Wheat</strong><br />
grain yield responded significantly to both Nand P in each soil zone, although<br />
the response to N was more pronounced. N by P interaction was nonsignificant<br />
for virtually all crop parameters studied in both zones. Optimum N<br />
and P20S nutrient rates were established for each zone using discrete and<br />
continuous economic analyses under three cost/price scenarios. Optimum<br />
nutrient rates were presented in a user-friendly tabular format for ease of<br />
interpretation by extension staff and policy-makers. Such a tabular format<br />
provides a dynamic template for extension staff to' use when determining rates<br />
of Nand P20S to recommend, facilitates interpolation of cost/price levels, and<br />
can provide insights for policy-makers when estimating the potential impact of<br />
policy interventions affecting grain and nutrient price levels.<br />
INTRODUCTION<br />
<strong>Wheat</strong> is a principal traditional cereal crop in the highlands of Ethiopia and is produced<br />
exclusively under rainfed conditions at altitudes ranging from 1500 to 3000 m a.s.l. (Hailu,<br />
1991). <strong>The</strong> central highland of Ethiopia is historically an important wheat-growing region. In<br />
this region, wheat ranks second in total area coverage, production and market demand after<br />
tef (Eragrostis te!) (CSA, 1997a), and is produced across a range of soil conditions,<br />
particularly on well-drained highly-weathered reddish-brown soils (Nitisols) and poorlydrained<br />
heavy dark clay soils (Vertisols) (Asnakew et al., 1991; Hailu, 1991). Of the total<br />
current wheat production in the country, 33% comes from the central highland region (CSA,<br />
1997a).<br />
239
Agronomic and economic evaluation ofon-farm Nand P response - Amsal et al.<br />
As in many other tropical and subtropical regions (Sanchez, 1976), soils in the highlands of<br />
Ethiopia, particularly in the central region, exhibit low levels of essential plant nutrients and<br />
organic matter content (Asnakew et at., 1991; Tekalign et at., 1988). Poor soil fertility<br />
(Amsal et at., 1997a), especially low availability of Nand P (Asnakew et at., 1991; Tekalign<br />
et at., 1988), has been demonstrated to be a major constraint to wheat production in Ethiopia.<br />
This is largely a consequence of the cereal-dominated cropping history of most fields and<br />
continuous nutrient mining by crop removal (Amsal et at., 1997b; Amanuel et at., 1991),<br />
which eventually lead to depletion of soil nutrients (Asnakew et at., 1991; Tanner et at.,<br />
1993). Soil nutrient depletion has been exacerbated by low levels of chemical fertilizer usage<br />
(Asnakew et at., 1991; CSA, 1997b) due to both high cost and constraints to timely<br />
availability of the fertilizer input (Gezahegn and Tekalign, 1995).<br />
In the central highland region, wheat production utilizes 27% of the total annual fertilizer<br />
consumption by wheat in the country (Asnakew et at., 1991). In this region, poor soil fertility<br />
is aggravated by the loss of plant nutrients from the crop root zone due to intense leaching<br />
and runoff on Nitisols; denitrification is common on frequently waterlogged Vertisols<br />
particularly during the heavy rains from June to September. Consequently, nutrient<br />
deficiency, especially for Nand P, is often encountered in wheat crops growing in cool, wet<br />
areas, including the poorly drained Vertisols (Asnakew et at., 1991; Tekalign et at., 1988,<br />
Tanner et at., 1993; Tilahun et at., 1996).<br />
<strong>The</strong> quantity of fertilizer nutrients required to optimize crop production depends on the<br />
inherent capacity of the soil to supply adequate levels of nutrients to growing plants (Sanchez<br />
1976; Baligar and Bennett, 1986), the yield potential of the crop v:ariety grown (Amsal et at.,<br />
1995, 1997a; Tilahun et at., 1996), the availability and cost of fertilizers (Gezahegn and<br />
Tekalign, 1995), and climatic conditions prevailing during the crop growing season (Baligar<br />
and Bennett, 1986). Due to the recent release of improved high-yielding bread wheat varieties<br />
adapted to heterogeneous environmental conditions in Ethiopia (Hailu, 1991; Payne et at.,<br />
1996), wheat grain yield potential has significantly increased in Ethiopia (Amsal et at., 1995)<br />
and area coverage has substantially expanded (Payne et at., 1996) mainly by replacing<br />
unimproved, input non-responsive traditional cereal crops such as tef, durum wheat (T.<br />
durum) and barley (Hordeum vutgare) (Getachew et at., 1993; CSA, 1997a). Recently<br />
released cultivars are highly responsive to improved crop management systems (Amsal et at.,<br />
1999) and require higher rates of nutrient applications (Tanner et at., 1993; Amsal et at.,<br />
1997a). <strong>The</strong> Broad Bed and Furrow (BBF) system introduced in the mid 1980s (ILCA, 1989)<br />
to improve surface drainage has substantially increased bread wheat production and<br />
productivity on poorly-drained Vertisols (Mesfin et at., 1994) where crop production has<br />
been historically restricted to low-yielding traditional crops (Getachew et at., 1993).<br />
Studies elsewhere (Greenwood, 1981; Baligar and Bennett, 1986) have demonstrated that<br />
application of fertilizer greatly increases crop yields, facilitates the adoption of high-yielding<br />
improved varieties, and provides a high amount of crop residue which can be used to improve<br />
soil fertility and prevent soil degradation. Greater usage of chemical fertilizers has been<br />
hailed by many workers (Asnakew et at., 1991; Tanner et at., 1993; Amsal et at., 1997a,<br />
1999) as a primary means of increasing wheat grain yields in Ethiopia. Accordingly, the<br />
demand for DAP (di-arnmonium phosphate) and urea, the two most commonly used fertilizer<br />
sources in Ethiopia, was projected to increase annually by 16 and 11 %, respectively, between<br />
1998 and 2001 (FEWSILFSU, 1998).<br />
240
Agronomic and economic evaluation ofon-farm Nand P response - Amsal et al.<br />
Currently, extension personnel disseminate a fertilizer rate equivalent to 60 kg Nand 60 kg<br />
P 2 0 S ha-' for wheat production in central Ethiopia. This recommendation was derived in the<br />
early 1970s and was based on results generated from on-station trials, unrepresentative of<br />
current peasant farmers' wheat fields; tall, low-yielding and input non-responsive old<br />
cultivars were used in these trials with no intervention to improve soil drainage for frequently<br />
waterlogged wheat in the Vertisol zones. To date, however, wheat production in central<br />
Ethiopia has exhibited a significant change in cropping practices mainly due to the increased<br />
availability of chemical fertilizers at a fair price (GMRP, 1997), a wide range of inputresponsive<br />
high-yielding semi-dwarf cultivars (Hailu, 1991; Payne et at., 1996; Amsal et al.,<br />
1999) and the introduction of improved drainage technologies (lLCA, 1989) to enhance<br />
productivity in Vertisol areas (Mesfin et al., 1994). It is, therefore, imperative to revise the<br />
current fertilizer recommendation and generate new zone-specific, economically optimal N<br />
and P fertilizer rates for the wheat production systems in the central highland region.<br />
Recently, researchers in the south-eastern and north-western wheat growing regions of the<br />
country have conducted a series of on-farm fertilizer response trials and generated new zonespecific<br />
economically optimum Nand P rates for wheat production (Amanuel et al., 1991;<br />
Tanner et al., 1999). <strong>The</strong> results from those trials indicated not only an increase in wheat<br />
yields and net return to the farmer~ but also demonstrated the advantages of zone-specific<br />
fertilizer recommendations in sustaining wheat production in the highlands of Ethiopia.<br />
This paper summarizes the results of 14 on-farm Nand P fertilizer trials conducted on two<br />
contrasting soil types (i.e., well-drained highly-weathered Nitisols and frequently<br />
waterlogged Vertisols) in the central highlands of Ethiopia. <strong>The</strong> objectives were to examine<br />
yield and yield component response of a recently, released high-y,ielding bread wheat variety<br />
to applied Nand P fertilizer rates, and to generate economically optimal Nand P fertilizer<br />
rates for bread wheat production in specific·'agro-ecological zones in central Ethiopia.<br />
MATERIALS AND METHODS<br />
Locations and climatic conditions. <strong>The</strong> experiment was conducted during the 1995 and<br />
1996 main cropping seasons on farmers' fields in well-drained highly-weathered reddishbrown<br />
soil (eutric Nitisol) and in poorly-drained heavy dark clay soil (pellic Vertisol) zones<br />
of west Shewa in the central highland of Ethiopia. In each zone, seven trials were conducted<br />
on representative farm sites selected annually in conjunction with local extension agents.<br />
Details of the trial sites and soil characteristics are presented in Table 1. All soil<br />
characteristics were determined at the Holetta Research Center analytical laboratory using<br />
soils sampled at 0-30 and 31-60 cm depths from each site prior to trial planting in late June.<br />
Climatic data during each trial season were obtained from the closest weather station (i.e.,<br />
from Holetta R.C. in the Nitisol zone and the Ginchi R.c. in the Vertisol zone). Accordingly,<br />
mean annual rainfall was 649.0 and 787.6 mm at Holetta and 648.5 and 725.4 mm at Ginchi<br />
during the 1995 and 1996 cropping seasons, respectively. <strong>The</strong> corresponding mean minimum<br />
and maximum temperatures were 5.9 and 6.3°C and 20.9 and 21.5°C at Holetta and 7.8 and<br />
7.1°C and 23.6 and 23.0°C at Ginchi, respectively.<br />
Treatments and experimental design. This experiment examined the response of bread<br />
wheat to treatments consisting of the 12 factorial combinations of four N rates (i.e., 20.5,41,<br />
82 and 164 kg ha-') from urea and three P 2 0 S rates (i.e., 23, 46 and 92 kg ha-') from triple<br />
super phosphate, plus a control with no fertilizer application. <strong>The</strong> treatments were laid out in<br />
a randomized complete block design with three replications at each site. <strong>The</strong> trials were<br />
241
Agronomic and economic evaluation ofon-farm Nand P response - Amsal et at.<br />
planted with a gross plot size of 4.8 x 5 m (= 24 m 2 ) in the Vertisol zone and 4 x 5 m (= 20<br />
m 2 ) in the Nitisol zone.<br />
Host fanners, according to their customary practices and using the traditional ox-plow<br />
system, prepared the trial seedbeds. <strong>The</strong> BBF drainage system, using a 0.8 m wide raised bed<br />
and a 0.4 m wide furrow, was superimposed at planting for all trials in the Vertisol zone to<br />
facilitate drainage of excess surface water during the crop growing season. All P fertilizer<br />
was applied at planting, while N fertilizer was split applied (Tilahun et al., 1996): one-third<br />
ofN was applied at planting and the remainder was top-dressed at mid-tillering.<br />
Host fanners selected sowing dates: all trials were sown from the latter half of June to the<br />
first week of July across the two years. Immediately after surface broadcast application of the<br />
basal N portion and all P fertilizer, a pre-weighed quantity of seeds of the bread wheat variety<br />
"Kubsa" was broadcast sown at the rate of 150 kg ha- l , then soil-incorporated by constructing<br />
BBFs in the Vertisol zone and by one pass of the local ox-plow in the Nitisol zone (i.e., as per<br />
farmers' practice). <strong>The</strong> bread wheat variety "Kubsa". a semi-dwarf high-yielding variety<br />
selected from CIMMYT gennplasm (= "Atilla"), was released in 1993 on a national scale.<br />
Weeds were controlled by post-emer.gence spraying of 2,4-D at the rate of 1.5 I product ha- l<br />
at 25 DAB and Puma S at the rate of 1.0 I product ha- l at 55 DAE in all trials.<br />
Plant height and the number of productive spikes m- 2 were detennined for each treatment<br />
prior to plot harvest. Numbers of kernels spike- l were detennined from 20 spikes sampled at<br />
random from each plot. At physiological maturity, plants from a net plot size of 3 x 4 m were<br />
hand-harvested close to the ground surface using sickles. <strong>The</strong> haryests were sun-dried in the<br />
open air, weighed to detennine the above-ground biomass yield, then threshed and grain<br />
yields were weighed for each treatment. Harvest index was detennined as the ratio of grain<br />
yield to above-ground biomass yield and expressed as a percentage. Thousand-kernel weight<br />
was detennined by weighing 1000 seeds randomly sampled from each plot yield. <strong>The</strong> number<br />
of grains m- 2 was detennined as the product of the number of productive spikes m- 2 and seeds<br />
spike-I.<br />
Statistical and economic analysis. All data were subjected to combined analysis of variance<br />
(ANOV A) using MSTATC microcomputer software. .<br />
<strong>The</strong> 13 N by P interaction means for grain yield (GY) for both trial sets were fitted to the<br />
following response surface by multiple regression analysis:<br />
<strong>The</strong> coefficients thus derived were used to detennine economic optimum Nand P20S rates<br />
according to the methodology of Jauregui and Sain (1992) for continuous economic analysis<br />
of crop response to fertilizer. Specifically, for each nutrient an "r" value was calculated; the<br />
economic optimum nutrient level was found by equating the partial derivatives of the<br />
response surface to the respective "r" value, and solving for nutrient rate. <strong>For</strong> each nutrient,<br />
"r" was detennined from the equation:<br />
r = P F (1 + R)/(Pos - Cy)(1 - a)<br />
where PF fertilizer price per kg of nutrient<br />
R the minimum acceptable rate ofreturn (MARR): set at 1.0 (=100%)<br />
242
Agronomic and economic evaluation ofon-farm Nand P response - Amsal et al.<br />
in this analysis<br />
Pos = farmer price per kg of grain<br />
C y = cost of harvest, threshing and transport; set at 0.22 Ethiopian Birr kg'l<br />
in this analysis<br />
a = adjustment of experimental grain yields to minimize bias: set at 0.10<br />
(=10%) in this analysis<br />
<strong>The</strong> 13 mean grain yields for the N by P treatment combinations for each trial set were also<br />
subjected to discrete economic analysis using partial budget methodology (CIMMYT, 1988).<br />
<strong>The</strong> partial budget analysis utilized the same assumptions regarding adjustments, costs/prices,<br />
and the MARR as described for the continuous economic analysis.<br />
To compare the two methods of economic analysis, three cost/price scenarios were used for<br />
each trial set as shown in the following table:<br />
.<br />
T'<br />
,".<br />
;;!'" ': .<br />
• C'<br />
Sceil'arto<br />
'<br />
.'-Sc~,li~rio '" C "_. '< . '. S~enatio<br />
. ; 2<br />
LoW FeJftiJ~er: '<br />
:i<br />
j'~<br />
:Mod.<br />
..' ~ ~ ........;.0 ,<br />
U~gh Grain, :rfiCt~ : ,<br />
;.. ~ .<br />
. Fertiliier:<br />
, Moder~te<br />
3<br />
Big~<br />
Fertilizer: Low<br />
Grain Price<br />
Grahl<br />
<strong>Wheat</strong> grain<br />
price (EB/k~) 1.50 1.20 0.90<br />
N cose (EB/kg N) 3.6 4.1. 5.1<br />
P20S cost b (EB/kg P 2 OS) 3.0 3.4 4.2<br />
aDerived from the cost ofurea (i.e., cost ofN per kg = cost of urea per kgl0.46).<br />
bDerived from the cost ofDAP (i.e., cost ofP20s per kg = cost ofDAP per kg/0.64).<br />
<strong>The</strong> value of wheat straw was ignored in the current economic analysis as per the approach of<br />
Amanuel et al. (1991). <strong>Wheat</strong> straw has a significant market value in relatively few locations<br />
throughout Ethiopia. Thus, the exclusion of this produ~t from the economic analysis is<br />
justifiable, and represents an additional element of conservatism in the derived economic<br />
optimum nutrient rates.<br />
RESULTS AND DISCUSSION<br />
Agronomic analysis. <strong>The</strong> results of the combined analysis of the N by P trials (i.e., seven<br />
site-year combinations within each soil zone) are presented in Table 2 for the Vertisol and<br />
Table 3 for the Nitisol. <strong>The</strong> two soil zones were markedly different in grain yield (OY)<br />
potential as reflected in the trial means of 1.89 tlha on the Vertisol and 3.08 t1ha on the<br />
Nitisol. Mean OY of the control (i.e., no fertilizer applied) was also lower on the Vertisol<br />
(0.72 tlha) cf. the Nitisol (1.75 tlha).<br />
Application of Nand P significantly increased all crop parameters studied in both soil zones<br />
relative to the control treatment (Tables 2 and 3) except HI on the Nitisol. <strong>The</strong> mean OY<br />
response to fertilizer application was 163% on the Vertisol and 76% on the Nitisol cf. the<br />
unfertilized control. Mean wheat biomass yield (BY) increased by 149% on the Vertisol and<br />
77% on the Nitisol cf. the control treatment. On both soil types, fetiilizer application<br />
243
Agronomic and economic evaluation ofon-farm Nand P response - Amsal et al.<br />
produced taller plants, a larger number of spikes m- 2 (SPM), heavier thousand grain weight<br />
(TGW), and more grains m- 2 (GPM) cf. unfertilized wheat.<br />
In the Vertisol zone, all measured wheat crop parameters exhibited a positive but quadratic<br />
(i.e., diminishing) response to applied N fertilizer except SPM (Table 2); SPM did not exhibit<br />
either a linear or quadratic response to N. <strong>Wheat</strong> GYs increased by 83, 156,233 and 288% in<br />
response to the application of 20.5, 41, 82 and 164 kg N ha- I , respectively; grain conversion<br />
ratios for the respective rates of applied N were 29.3, 27.3, 20.4 and 12.6 kg grain per kg N<br />
applied.<br />
In the Nitisol zone, all measured wheat crop parameters exhibited a positive and linear (i.e.,<br />
constant rate) response to applied N fertilizer except HI and BY (Table 3); HI did not exhibit<br />
either a linear or quadratic response to N, while BY exhibited a positive but quadratic<br />
response to N. <strong>Wheat</strong> GY s increased by 45, 62, 98 and 150% in response to the application of<br />
20.5, 41, 82 and 164 kg N ha- I , respectively; grain conversion ratios for the respective rates of<br />
applied N were 38.5, 26.3, 20.9 and 16.0 kg grain per kg N applied.<br />
<strong>The</strong> application of P20 Sresulted in·a positive but quadratic response for SPM, GPM, BY and<br />
GY in the Vertisol zone (Table 2). Plant height (PH) and TGW exhibited a positive and linear<br />
response to P20S, while HI showed no response to P20 S. Application of 23, 46 and 92 kg<br />
P20 S ha- I resulted in a GY increment of 171, 196 and 203%, respectively; grain conversion<br />
ratios for the respective rates of applied P20 S were 53, 31 and 16 kg grain per kg P20S<br />
applied.<br />
In the Nitisol zone, only TGW exhibited a positive but quadratic response to the application<br />
of P20 S (Table 3). PH, BY and GY exhibited a positive and linear response to P20 S, while<br />
SPM, GPM and HI showed no response to P20 S. Application of 23, 46 and 92 kg P20 S ha- I<br />
resulted in a GY increment of 71, 90 and 104%, respectively; grain conversion ratios for the<br />
respective rates ofapplied P20 Swere 54, 34 and 20 kg grain per kg P20s applied.<br />
Across both zones, all N by P 2 0 S interaction terms were non-significant for the crop<br />
parameters studied except the N quadratic by P20s quadratic interaction term (P
Agronomic and economic evaluation ofon-farm Nand P response - Amsal et al.<br />
Tabular presentation of optimal nutrient rates for the various grain and nutrient price<br />
permutations (Tables 5 and 6) presents three distinct potential benefits for wheat producers in<br />
Ethiopia. First, and perhaps most importantly, such tables provide a dynamic template for<br />
extension staff to use when detennining rates of Nand P 2 0 S to recommend: recommended<br />
nutrient rates should be based on nutrient prices immediately prior to planting and on<br />
projected grain prices for fanners. Soch price-sensitive flexibility represents a marked<br />
contrast to previous fertilizer recommendations which were based on fixed prices at a given<br />
point in time, and were often issued on a national scale, neglecting zone-specific<br />
environmental heterogeneity. As an example, recent national nutrient recommendations for<br />
"wheat" (i.e., not even specifically targeted for bread or durum wheat) consisted of 36 kg N<br />
and 31 kg P 2 0 siha for "red and brown soils" and 56 kg Nand 6 kg P 2 0siha for "black and<br />
grey soils" (NFIU, 1989). Even where sensitivity analysis has been included in the economic<br />
analyses, the range of prices has tended to be limited in magnitude (Amanuel et al., 1991).<br />
<strong>The</strong> second potential benefit of such a tabular presentation of optimum nutrient rates is that it<br />
facilitates interpolation for grain and nutrient prices intennediate to the intervals used to<br />
generate the tables. Such interpolation by extension staff should, in theory, maximize the<br />
economic efficiency of fertilizer usage in wheat production in Ethiopia.<br />
Thirdly, such tables can provide valuable insights for policy-makers when estimating the<br />
potential impact of policy interventions affecting grain and nutrient price levels, such as the<br />
removal of s'ubsidies: policy and resultant price changes will alter fertilizer profitability,<br />
recommended nutrient rates, national grain production levels, and the requirements for<br />
imported grain andlor fertilizer.<br />
<strong>The</strong> major limitation to the modeling approach employed to generate optimum nutrient rate<br />
tables is that the validity of the outputs can occasionally be critically affected by the<br />
coefficients of the estimated response surfaces even when there is no apparent violation of the<br />
prerequisite conditions for continuous economic analysis (Tanner et ai., 1999).<br />
<strong>The</strong> "goodness-of-fit" of the economic optimum nutrient rates derived from the response<br />
surface coefficients cf. the rates detennined to be optima~ by discrete economic analysis are<br />
presented for the three specific price scenarios described in the Materials and Methods: low<br />
fertilizer and high grain prices, moderate prices for both, high fertilizer and low grain prices<br />
(Table 7). It should be emphasized that the optimal rates detennined by using the two<br />
methods will seldom be equal since discrete analysis is based on the actual GY response<br />
points while continuous analysis is based on response surfaces "smoothed" by regression<br />
analysis. As per the recommendations of Tanner et al. (1999), fertilizer response GY data<br />
should be subjected simultaneously to discrete and continuous economic analysis to increase<br />
the level of confidence in recommendations arising from the analysis.<br />
ACKNOWLEDGMENTS<br />
This experiment was financially supported by the Ethiopian Agricultural Research<br />
Organization (EARO) of Ethiopia in co-operation with the CIMMYT/CIDA <strong>Eastern</strong> Africa<br />
Cereals Program.<br />
245
Agronomic and economic evaluation ofon-farm Nand P response - Amsal et al.<br />
REFERENCES<br />
Amanuel G9rfu, Asefa Taa, Tanner, D.G. and W. Mwangi. 1991. On-Farm Research To Derive Fertilizer<br />
Recommendations <strong>For</strong> Small-Scale Bread <strong>Wheat</strong> Production: Methodological Issues And Technical<br />
Results. Research Report No. 14. IAR, Addis Ababa, Ethiopia. 37 p.<br />
Amsal Tarekegne, Tanner, D.G. and Getinet Gebeyehu. 1995. Improvement in yield of bread wheat cuItivars<br />
released in Ethiopia from 1949 to 1987. A.frican Crop Science Journal 3: 41-49.<br />
Amsal Tarekegne, Tanner, D.G., Amanuel Gorfu, Tilahun Geleto and Zewdu Yilma. 1997a. <strong>The</strong> effect of<br />
several crop management factors on bread wheat yields in the Ethiopian highlands. African Crop<br />
Science Journal 5: 161-174.<br />
Amsal Tarekegne, Tanner, D.G. and Chanyalew Mandefro. I 997b. Effect of cropping sequence and nutrient<br />
application on crop parameters during the first three seasons of a wheat-based long-term trial in central<br />
Ethiopia. African Crop Science Conference Proceedings 3:685-693.<br />
Amsal Tarekegne, Tanner, D.G., Taye Tessema and Chanyalew Mandefro. 1999. A study of variety by<br />
management interaction in bread wheat varieties released in Ethiopia. pp. 196-212. In: <strong>The</strong> Tenth<br />
<strong>Regional</strong> <strong>Wheat</strong> <strong>Workshop</strong> for <strong>Eastern</strong>, Central and Southern Africa. Addis Ababa, Ethiopia:<br />
CIMMYT.<br />
Asnakew Woldeab, Tekalign Mamo, Mengesha Bekele and Tefera Ajema. 1991 . Soil fertility management<br />
studies on wheat in Ethiopia. pp. 112-144. In: Hailu Gebre-Mariam, Tanner, D.G. and Mengistu<br />
Hulluka (eds.). <strong>Wheat</strong> Research in Ethiopia: A Historical Perspective. IARICIMMYT, Addis Ababa.<br />
Baligar, V.c. and O.L. Bennett. 1986. Outlook on fertilizer use efficiency in the tropics. Fertilizer Research<br />
10:83-96.<br />
CIMMYT. 1988. From Agronomic Data To Farmer Recommendations. An Economics Training Manual.<br />
Completely Revised Edition. CIMMYT, Mexico, D.F., Mexico. 79 p.<br />
CSA (Central Statistical Authority). 1997a. Agricultural Sample Survey 1996/97. I. Report On Area And<br />
Production <strong>For</strong> Major Crops. Statistical Bulletin 171. Addis Ababa, Ethiopia.<br />
CSA (Central Statistical Authority). 1997b. Agricultural Sample Survey 1996/97. Ill. Report On Farm<br />
Management Practices. Statistical Bulletin 171. Addis Ababa, Ethiopia.<br />
FEWSILFSU (Famine Early Warning SystemILocal Food Security Unit). 1998. Monthly Food Security Bulletin,<br />
April 1998. USAID Famine Early Warning ~ystemlEC Local Food Security Unit, Addis Ababa,<br />
Ethiopia. 8 p.<br />
Getachew Asamenew, Hailu Beyene, Workneh Negatu and Gezahegn Ayele. 1993. A survey of the farming<br />
systems ofVertisol areas of the Ethiopian highlands. pp. 29-49. In: Tekalign Mamo, Abiye Astatke,<br />
Srivastava, K.L. and Asgelil Dibabe (eds.).Improved Management Of Vertisols <strong>For</strong> Sustainable Crop<br />
Livestock Production In <strong>The</strong> Ethiopian Highlands: Synthesis Report 1986-92. Technical Committee of<br />
the Joint Vertisol Project, Addis Ababa, Ethiopia.<br />
Gezahegn Ayele and Tekalign Mamo. 1995. Determinants ofdemand for fertilizer in a Vertisol cropping system<br />
in Ethiopia. Tropical Agriculture (Trinidad) 72: 165-169.<br />
GMRP (Grain Market Research Project). 1997. Fertilizer Profitability in Ethiopia: Deregulation OfPrice And<br />
It's Impact. Market Analysis Note No.3. Grain Market Research Project, Ministry ofEconomic<br />
Development and Co-operation, Addis Ababa, Ethiopia. 7 p.<br />
Greenwood, DJ. 1981. Fertilizer use and food production: world scene. Fertilizer Research 2: 33-51.<br />
Hailu Gebre-Mariam. 1991. <strong>Wheat</strong> production and research in Ethiopia. pp. 1-15. In: Hailu Gebre-Mariam,<br />
Tanner, D.G. and Mengistti Hulluka (eds.). <strong>Wheat</strong> Research in Ethiopia: A Historical Perspective.<br />
IARICIMMYT, Addis Ababa.<br />
ILCA (International Livestock Center for Africa). 1989. Animal Power <strong>For</strong> Improved Management Of Vertisols<br />
In High Rainfall Areas In Highland Ethiopia. Joint ILCAf[CRISA Tf[BSRAMIGOE Ethiopia Vertisol<br />
Project, Addis Ababa, Ethiopia.<br />
Jauregui, M.A. and G.E. Sain. 1992. Continuous Economic Analysis OfCrop Response To Fertilizer In On<br />
Farm Research. CIMMYT Economics Paper No.3. Mexico, D.F.: CIMMYT.<br />
Mesfin Abebe, Tekalign Mamo, Miressa Duffera and Selamyehun Kidanu. 1994. Crop response to improved<br />
drainage of Vertisols in the Ethiopian highlands. Journal ofAgronomy and Crop Science 172:217-222.<br />
NFru. 1989. <strong>Wheat</strong>: Results Of<strong>The</strong> FTS, ITS And DSFT Fertilizer Trials Conducted By ADDINFlU In 1988.<br />
Joint Working Paper No. 28. National Fertilizer and Inputs Unit, Ministry of Agriculture, Addis Ababa,<br />
Ethiopia. 61 p.<br />
Payne, T.S., Tanner, D.G. and O.S. Abdalla. 1996. Current issues in wheat research and production in <strong>Eastern</strong>,<br />
Central and Southern Africa: Changes and challenges. pp. 1-27. In: Tanner, D.G., Payne, T.S. and O.S.<br />
Abdalla (eds.). <strong>The</strong> Ninth <strong>Regional</strong> <strong>Wheat</strong> <strong>Workshop</strong> for <strong>Eastern</strong>, Central and Southern Africa. Addis<br />
Ababa, Ethiopia: CIMMYT.<br />
Sanchez, P.A. 1976. Properties And Management OfSoils In <strong>The</strong> Tropics. John Wiley and Sons, New York.<br />
246
Agronomic and economic evaluation ofon-farm Nand P response - Amsal et at.<br />
Tanner, D.G., Amanuel Gorfu and Asefa Taa. 1993 . Fertiliser effects on sustainability in the wheat-based smaIlholder<br />
farming systems of southeastern Ethiopia. Field Crops Research 33:235-248 .<br />
Tanner, D.G., Asefa Taa and Kefyalew Girma. 1999. Detennination of economic optimum fertilizer levels using<br />
discrete and continuous analytical methods. pp. 273-297. In: <strong>The</strong> Tenth <strong>Regional</strong> <strong>Wheat</strong> <strong>Workshop</strong> for<br />
<strong>Eastern</strong>, Central and Southern Africa. Addis Ababa, Ethiopia: CIMMYT.<br />
Tekalign Mamo, Haque, I. and C.S. Kamara. 1988. Phosphorus status of some Ethiopian highland Vertisols. pp.<br />
232-249. In: Jutzi, S.C., Haque, I., McIntire, 1. and J.E.S. Stares (eds.). Management of Vertisols in<br />
Sub-Saharan Africa. ILCA, Addis Ababa, Ethiopia.<br />
Tilahun Geleto, Tanner, D.G., Tekalign Mamo and Getinet Gebeyehu. 1996. Response of rain fed bread and<br />
durum wheat to source, level and timing of nitrogen fertilizer on two Ethiopian Vertisols: II. N uptake,<br />
recovery and efficiency. Fertilizer Research 44: 195-204.<br />
Questions and Answers:<br />
Colin Wellings: A general question to those undertaking nutrition and fertilizer response<br />
studies: Has there been any value in using soil testing as a diagnostic predictor of fertilizer<br />
response?<br />
Answer (D.G. Tanner): <strong>The</strong>re are significant correlations between soil nitrate and available<br />
P and Nand P response, respectively. However, the predictive values are low. Also, soil lab<br />
capacity is too low to make diagnostics practical.<br />
247
Agronomic and economic evaluation ofon-fann Nand P response - Amsal et al.<br />
Table 1. Characteristics and results of soil analysis of 14 experimental sites.<br />
Soil Soil particle size Organic . Exchan~eable cations .<br />
Sowing Altitude Previous depth Sand Silt Clay Carbon . pH . P < '. N0 3 · NH4. .Na . . . ·.il{ i Ca I ' l\!g . ' eEe"<br />
Location date . (m) · crop (em) . (%) (%) (1:1) H2O Jppm) . (meqllOOg)<br />
peIIic Vertisol<br />
Amaro A 15/0611995 2400 <strong>Wheat</strong> 00-30 10.00 16.25 73.25 1.36 7.29 3.98 7.00 7.00 0.21 2.35 36.32 5.52 35.80<br />
31-60 7.5 20.00 72.50 1.17 7.41 2.98 5.60 14.00 0.30 2.33 51.15 5.62 54.60<br />
Amaro B 15/06/1995 2400 Fenugreek 00-30 7.5 18.75 73.75 1.21 7.19 4.68 2.80 4.20 0.24 2.37 65.60 5.44 57.40<br />
31-60 10.00 16.25 73.73 1.21 7.40 5.10 2.80 7.00 0.26 2.37 34.90 5.53 57.60<br />
Amaro B 18/061996 2410 Fenugreek 00-30 17.50 15.00 67.50 1.09 7.35 5.80 32.20 22.40 0.44 2.46 76.35 5.96 63.80<br />
31-60 17.50 13.75 68.75 1.05 7.60 3.80 14.00 18.20 0.36 2.01 78.47 6.44 63.00<br />
Boche 20106/1995 2150 Noug 00-30 7.50 21.25 71.25 1.21 6.41 7.66 5.60 11.20 0.50 2.23 42.23 5.88 34.80<br />
31-60 7.50 22.50 70.00 1.32 6.54 8.08 2.80 7.00 0.69 2.17 41.84 5.83 44.00<br />
Boche 02/0711995 2150 <strong>Wheat</strong> 00-30 16.25 16.25 67.50 1.13 7.00 12.80 9.80 9.80 0.80 2.30 52.09 7.78 60.40<br />
31-60 15.00 17.50 67.50 1.01 7.25 . 9.80 9.80 18.20 0.80 1.79 51.42 8.28 62.40<br />
Borodo 2010611995 2175 Chickpea 00-30 10.00 18.75 71.25 1.21 6.06 2.26 5.60 4.20 0.60 1.93 40.13 5.63 49.00<br />
31-60 15.00 13.75 71.25 1.17 6.09 2.12 Trace Trace 0.80 1.82 42.23 5.66 47.00<br />
Borodo 02/07/1996 2200 Tef 00-30 16.25 21.25 62.50 1.32 7.03 7.40 18.20 22.40 0.48 1.76 31.89 6.43 53.80<br />
31-60 18.75 15.00 66.25 0.90 6.52 6.40 14.00 28.00 0.66 1.70 37.89 6.44 56.80<br />
NitisQI<br />
Negade- 21/06/1995 2225 Sorghum 00-30 12.50 28.75 58.75 1.91 5.87 3.68 4.20 47.60 0.13 1.24 24.58 5.40 27.60<br />
Sororo 31-60 15.00 23.75 61.25 1.56 6.00 3.26 8.40 33.60 0.18 1.33 22.65 5.38 27.00<br />
Negade- 22/06/1996 2200 Sorghum 00-30 21.25 23.75 55.00 1.87 5.08 2.40 28.00 14.00 0.46 1.45 21.54 5.13 33.60<br />
Sororo 31-60 12.50 17.50 70.00 1.17 5.20 2.00 22.40 9.80 0.45 0.85 19.91 6.27 31.60<br />
Menag- 22/0611995 2525 Fallow 00-30 12.50 28.75 58.75 2.18 5.22 3.40 4.20 18.20 0.08 1.39 10.89 3.88 16.20<br />
esha 31-60 10.00 26.25 63.75 1.52 4.95 2.84 5.60 9.80 0.11 1.08 10.82 3.96 20.20<br />
Menag- 21/06/1996 2580 Fallow 00-30 25.00 26.25 48.75 1.87 4.50 3.00 26.60 23.80 0.35 1.35 11.83 2.13 25.50<br />
esha 31-60 22.50 17.50 60.00 0.97 4.63 3.00 14.00 14.00 0.35 1.05 10.75 2.02 23.80<br />
Wolmera 21106/1996 2350 <strong>Wheat</strong> 00-30 27.50 25.00 47.50 1.44 4.95 6.20 22.40 21.00 0.32 1.29 15.93 3.37 25.60<br />
31-60 22.50 21.25 56.25 1.32 5.15 5.00 28.00 11.20 0.28 1.35 17.26 3.19 28.80<br />
Chiri 22/0611996 2400 Tef 00-30 20.00 22.50 57.50 1.60 5.05 14.00 32.20 22.40 0.36 2.63 15.09 3.31 27.00<br />
31-60 12.S0 20.00 67.S0 0.94 S.80 3.60 9.80 4.20 0.42 2.93 IS.20 4.06 2S.60<br />
G. Kuyu 22/0611996 2475 Barley 00-30 22.50 27.50 50.00 1.52 4.45 6.80 18.20 4.20 0.39 1.07 10.16 1.98 26.00<br />
31-61 20.20 1~ 62.50 1.09 4.60 9.40 18.20 9.80 0.34 0.74 8.18 1.86 26.00<br />
- '-----<br />
248 <br />
I
Agronomic and economic evaluation ofon-farm Nand P response - Amsal et al.<br />
Table 2.<br />
<strong>The</strong> effects of fertilizer Nand P application rates on selected agronomic<br />
parameters of wheat grown on a Vertisol.<br />
. " '<br />
"<br />
"PH ····S'P:M 'T6W , ' ·· · ~MIi ' · ." - HI<br />
"" . B;Y; G'Y<br />
(em) '(llo;'m- 2 ) . ' :;(2}' ··>; ~'b'O. :.n{~1) ",: . , : (~;:j .,·:(fh'a3'1 (tii~~l) .<br />
" .<br />
20.5 72 430 32.1 7.86 37.6 3.54 1.32<br />
41 77 468 33 .5 9.92 39.0 4.73 1.84<br />
82 81 441 35.4 11.0 41.0 5.88 2.40<br />
164 82 467 35.9 12.6 42.1 6.72 2.79<br />
kg P20S ha- I<br />
23 76 407 33.9 8.96 39.9 4.85 1.95<br />
46 78 467 34.1 11.0 40.0 5.34 2.13<br />
92 80 481 34.6 11.1 39.8 5.47 2.18<br />
Control 57 316 30.2 3.82 38.3 1.91 0.72<br />
Mean 75 432 33.6 9.42 39.7 4.75 1.89<br />
C.V.(%) 4.4 22.1 4.9 26.0 9.3 12.6 12.8<br />
Control vs. fertilizer b *** *** *** *** * *** ***<br />
N'inear *** NS *** *** *** *** ***<br />
Nquadratic *** NS *** * * *** ***<br />
P'inear *** *** * *** NS *** ***<br />
Pquadratic NS * NS ** NS * *<br />
N'inear X P'inear NS NS NS NS NS NS NS<br />
N'inear X Pquadratic NS NS NS NS NS NS NS<br />
.',<br />
Nquadratic X P'inear NS NS NS NS NS NS NS<br />
Nquadratic X Pquadratic NS NS NS NS NS NS NS<br />
I<br />
a<br />
Value scaled by 10 -j .<br />
b Single degree of freedom orthogonal contrast.<br />
*, **, *** Significant at the 5,1 and 0.1% level, respectively.<br />
249
Agronomic and economic evaluation ofon-farm Nand P response - Amsal et al.<br />
Table 3.<br />
<strong>The</strong> effects of fertilizer Nand P application rates on selected agronomic<br />
parameters of wheat grown on a Nitisol.<br />
kg N ha- I<br />
20.5<br />
41<br />
82<br />
164<br />
kg P20S ha- I<br />
23<br />
46<br />
92<br />
..<br />
' ,"<br />
PH<br />
(em)<br />
78<br />
80<br />
82<br />
86<br />
80<br />
82<br />
83<br />
'. .,<br />
. ' , sP'M '<br />
,{~o.~"ij ....<br />
.<br />
524<br />
532<br />
546<br />
634<br />
564<br />
556<br />
557<br />
TOW<br />
" (g). ..<br />
36.0<br />
36.2<br />
37.0<br />
37.1<br />
35.7<br />
36.8<br />
37.2<br />
.<br />
"GPl\r ' .<br />
(~o.l11-i) .<br />
14.2<br />
15.4<br />
16.0<br />
20.3<br />
16.5<br />
15.8<br />
17.1<br />
-III<br />
(%)<br />
46.6<br />
42.5<br />
42.4<br />
42.4<br />
42.7<br />
45.1<br />
42.6<br />
BY<br />
(t ha"l)<br />
5.55<br />
6.54<br />
8.13<br />
10.28<br />
6.99<br />
7.58<br />
8.30<br />
GY<br />
(tha-~)<br />
2.54<br />
2.83<br />
3.46<br />
4.37<br />
3.00<br />
3.32<br />
3.57<br />
Control 69 508 33.2 11.2 42.6 4.01 1.75<br />
Mean<br />
C.V.(%)<br />
80<br />
3.3<br />
552<br />
16.5<br />
36.1<br />
4.6<br />
15.7<br />
20.4<br />
43.4<br />
25.0<br />
7.11<br />
11.9<br />
3.08<br />
16.0<br />
Control vs. fertilizer b<br />
Nlinear<br />
Nquadratic<br />
P'inear<br />
Pquadratic<br />
N'inear X P'inear<br />
N'inear X Pquadratic<br />
Nquadratic X P'inear<br />
Nquadralic X Pquadratic<br />
***<br />
**'"<br />
NS<br />
***<br />
NS<br />
NS<br />
NS<br />
NS<br />
**<br />
*<br />
***<br />
NS<br />
NS<br />
NS<br />
NS<br />
NS<br />
NS<br />
NS<br />
..<br />
***<br />
**<br />
NS<br />
"'**<br />
t<br />
NS<br />
NS<br />
NS<br />
NS<br />
***<br />
***<br />
NS<br />
NS<br />
NS<br />
NS<br />
NS<br />
NS<br />
NS<br />
NS<br />
NS<br />
NS<br />
NS<br />
NS<br />
NS<br />
NS<br />
NS<br />
NS<br />
***<br />
***<br />
**<br />
***<br />
NS<br />
NS<br />
NS<br />
NS<br />
NS<br />
***<br />
***<br />
NS<br />
***<br />
NS<br />
NS<br />
NS<br />
NS<br />
NS<br />
a -,5<br />
Value scaled by 10 .<br />
b Single degree of freedom orthogonal contrast.<br />
t, *, **, *** Significant at the 10,5,1 and 0.1% level, respectively.<br />
}<br />
250
Agronomic and economic evaluation ofon-farm Nand P response - Amsal et at.<br />
Table 4. Parameters of Nand P response surfaces a generated from bread wheat grain yields in OFFTs conducted during 1995-96.<br />
Zone Site~ Years n a bi b 2 ' J>3 b4 bs Sig. R2' I<br />
Nitisol 7 1995-96 13 1358 18.03 11.27 -0.042 -0.0452 0.0138 *** 97.3 <br />
*** *** t * <br />
'vertisol 7 1995-96 13 763 22.14 8.051 -0.0811 -0.06 0.0375 *** 98.3<br />
I *** *** t *** *<br />
t, *> *** Indicate significance at the 10, 5, and 0.1 % level, respectively. <br />
a Grain yield data fitted to following surface: Grain yield (kg ha- I ) = a + bl(N) + b2(P20S) + b3(Ni + b4(P20S)2 + bs(N)(P20 s) <br />
.<br />
Table 5. Economic optimum Nand P 20 S rates (kg ha- 1 ) determined for Kubsa bread wheat cultivar in the Nitisol zone based on the<br />
response surface generated from grain yields in OFFTs (7 sites, 1995-96).<br />
, ":--< " ", -~,' .•, Price~er kg N:; " ".:-~
Agronomic and economic evaluation ofon-farm Nand P response - Amsal et al. <br />
Table 6. Economic optimum Nand P20 S rates (kg ha- 1 ) determined for Kubsa bread wheat cultivar in the Vertisol zone based on <br />
--- - - --r - --- - - -- - - - - - ~- - - - - - - - - --- 0- - ----- - - -- - - - - - - ,- -- -- - -- ~<br />
- <br />
Price per kg N<br />
I<br />
3.6 4.1 4.6 5.1 !<br />
Price<br />
per kg 3.0 3.4 3.8 4.2 3.0 3.4 3.8 4.2 3.0 3.4 3.8 4.2 3.0 3.4 3.8 4.2<br />
P20 S I<br />
1.5<br />
112-59 110-52 109-46 107-40 106-57 104-51 103-44 101-38 100-55 99-49 97-42 96-36 94-53 93-47 91-41 90-34<br />
= .-t": 107-53 106-47 104-40 102-33 101-52 99-45 98-38 96-31 95-50 93-43 91-36 90-29 88-48 87-41 85-34 84-27<br />
~<br />
bIJ<br />
1.4<br />
bIJ 1.3 102-47 100-40 98-33 97-25 95-45 93-38 92-31 90-23 88-43 86-36 85-28 83-21 81-41 80-34 78-26 76-19<br />
.!:Ii:<br />
~<br />
~ 96-40 94-32 92-24 90-16 88-38 86-30 84-22 82-13 80-36 79-27 77-19 75-11 73-33 71-25 69-17 67-9<br />
c..<br />
1.2<br />
.... 1.1<br />
~<br />
~ 88-31 86-22 84-13 81-4 79-29 77-20 75-11 73-2 71-26 69-17 67-8 65-0 63-24 60-.14 58-5 56-0<br />
~<br />
~<br />
1.0 78-20 76-10 73-0 73-0 68-17 66-7 64-0 64-0 59-14 57-4 54-0 54-0 50-11 47-1 45-0 45-0<br />
0.9<br />
65-6 63-0 63-0 63-0 54-2 52-0 52-0 52-0 44-0 44-0 44-0 44-0 33-0 33-0 33-0 33-0<br />
-<br />
All grain and nutrient prices expressed in Ethiopian Birr (EB) per kg. 1 US$ = 8.2 EB (May, 2000).<br />
Table 7. A comparison of the economic optimum Nand P20 S rates (kg ha- 1 ) determined by discrete and continuous economic<br />
lysis of the OFFTs conducted durin£! 1995-96 under three cost! .<br />
Technical optimum Scenario 1 Sceriario 2 ~cenario ' 3 .<br />
Cont. Discrete Cont. Discrete . Cont. Discrete.<br />
N-P GY N-P N-P N-P N-P N-P N-P<br />
Zone Sites Years Cv. (kglha) (kglha) (kglha) (kglba) (kglha) (kglha) (kglh~) (kglha)<br />
Nitisol 7 1995-96 Kubsa 241-162 4000 155-91 164-46 113-57 82-92 16-0 0-0 <br />
VertisoL_ 7 1995-96 Kubsa 164-118 2748 112-59 82-46 86-30 82-46 34-0 0-0<br />
I ---------<br />
252<br />
--<br />
,<br />
I<br />
I<br />
i
EFFECTS OF SOIL WATERLOGGING ON <br />
THE CONCENTRATION AND UPTAKE OF SELECTED NUTRIENTS <br />
BY WHEAT GENOTYPES DIFFERING IN TOLERANCE <br />
Amsal Tarekegne 1 , A.T.P. Bennie z and M.T. Labuschagne l<br />
lPlant Breeding and zSoil Science Departments, University of the Orange Free State,<br />
P.O. Box 339, Bloemfontein 9300, South Africa<br />
ABSTRACT<br />
Waterlogging of soil may restrict crop performance by altering soil mineral<br />
nutrient availability to and uptake by roots. A greenhouse experiment was<br />
conducted in 1998/99 using a soil high in clay content (Vertisol), at the<br />
University of the Orange Free State, South Africa, to determine the effects of<br />
soil waterlogging on Cu, Zn; P and K nutrient concentration and uptake by<br />
wheat genotypes that differ in tolerance to waterlogging. Differential response<br />
of wheat genotypes to waterlogging treatments was observed on vegetative dry<br />
biomass, straw and grain yields. Root zone oxygenation was significantly<br />
depressed by the waterlogging treatments as indicated by significantly reduced<br />
soil redox potentials. Both waterlogging and genotype treatments significantly<br />
affected the uptake and concentration of most of the nutrients in the vegetative<br />
biomass at anthesis or in the straw and grain at maturity. A significant<br />
differential response of wheat genotypes to waterlogging treatments was<br />
detected for most nutrient concentrations and uptake parameters. Compared to<br />
waterlogging tolerant genotypes, sensitive genotypes appeared to accumulate<br />
less Cu, Zn, P and K. <strong>The</strong>re was a considerable difference between<br />
waterlogging-sensitive and tolerant wheat genotypes reflected in the<br />
accumulation and uptake of these nutrients under waterlogging stress; the<br />
damaging effects of waterlogging were therefo.re attributed to decreased<br />
nutrient uptake due to Oz deficiency in the root zone, in particular resulting in<br />
P and Zn deficiency. Selection of genotypes with enhanced ability to<br />
overcome waterlogging-induced nutrient deficiency, particularly P and Zn<br />
deficiency, should improve wheat productivity in waterlogged soils.<br />
INTRODUCTION<br />
Soil waterlogging adversely affects the growth of terrestrial plants (Kozlowski; 1990),<br />
primarily due to reduced oxygen (Oz) supply to the roots (Grable, 1966; Armstrong 1982).<br />
Mineral nutrition of waterlogged crop plants may be largely affected by the initial nutrient<br />
status of the soil, changes in soil physicochemical properties and tolerance capabilities of the<br />
crop varieties (Kozlowski, 1990). In waterlogged soils, the pore spaces that usually allow free<br />
gas exchange between the rhizosphere and atmosphere are filled with water, which severely<br />
reduce the diffusion of Oz into the soil (Grable, 1966). Water covering the soil slows Oz<br />
diffusion from the atmosphere by a factor of 10. 4 (Armstrong, 1979). Respiration by roots and<br />
soil microorganisms may deplete Oz dissolved in the soil solution within a day of<br />
waterlogging (Drew and Lynch, 1980; Ponnamperuma, 1984).<br />
253
Effects ofsoil waterlogging on concentration and uptake ofnutrients - Amsal et al.<br />
Due to the restriction of gas exchange and subsequent depletion of O 2 , some soil<br />
microorganisms make use of electron acceptors other than O 2 for their respiratory oxidation<br />
(Ponnamperuma, 1984; Armstrong, 1982) thereby promoting a series of chemical and<br />
microbiological changes in the soil (Armstrong 1982). <strong>The</strong>se changes result in the<br />
accumulation ofCO 2 and several organic compounds to levels toxic to plant roots (Drew and<br />
Stolzy, 1996; Armstrong, 1982) and reduction of N0 3 -N, Fe, Mn, and sulfate, and changes in<br />
pH and redox potential of the soil (Armstrong, 1982; Ponnamperuma, 1984; Krizek, 1990;<br />
Laanbroek, 1990).<br />
<strong>The</strong> mineral composition of cultivated plants under waterlogged conditions depends largely<br />
on soil O 2 availability. It has been indicated that soil waterlogging results in reduced foliage<br />
concentrations of P and K in wheat (Drew and Sisworo, 1979). Stieger and Feller (1994)<br />
reported that waterlogging during grain filling reduced grain yield as well as K, P and Zn<br />
concentrations in the shoots and grains of wheat. Leyshon and Sheard (1974) obtained a<br />
reduction in P and K concentration of 61 and 58%, respectively, in barley seedlings following<br />
short-term waterlogging. Waterlogging of barley for 10 days decreased the P and K<br />
concentrations in grains (Stepniewski and Labuda, 1984). In a field study using wheat and<br />
pearl millet, Sharma and Swarup (1989) reported that short-term waterlogging decreased P, K<br />
and Zn uptake by the grain and straw. Huang et al. (1995) reported a reduction in P, K and Zn<br />
concentrations in the shoots and an increase of these nutrients in the roots of winter wheat.<br />
Waterlogging-induced O 2 deficiency may inhibit nutrient uptake and transport in<br />
waterlogging-sensitive crop varieties (Kozlowski, 1990) by altering root function due to the<br />
death of root system (Drew and Lynch, 1980; Stepniewski and Przywar, 1992; Trought and<br />
Drew, 1980a and b), causing nutrient leakage due Jo loss of integrity in root cell membranes<br />
(Resen and Carlson, 1984), or providing sub-optimal energy for active ion uptake due to<br />
inefficient anaerobic metabolism (Barrett-Leimard et al., 1990; Setter and Belfod, 1990).<br />
Waterlogging is a serious environmental constraint to wheat production on poorly drained<br />
soils (Kozlowski, 1984). Vertisols with a high montmorillonite clay content are important<br />
agricultural soils in cool and wet wheat growing agro-ecologies of the central and eastern<br />
African highlands (Jutzi and Abebe, 1986). <strong>Wheat</strong> genotypes differ in their tolerance to<br />
waterlogging stress (van Ginkel et al., 1992). <strong>Wheat</strong> pro~uction on frequently waterlogged<br />
Vertisols such as these of the eastern African highlands could likely be improved when<br />
planted to waterlogging tolerant genotypes. Little is known about the nutrient uptake and<br />
accumulation by wheat genotypes differing in waterlogging tolerance (Huang et al., 1995).<br />
Hence, research is needed to determine whether a genotypic difference in waterlogging<br />
tolerance in wheat can be related to differences in nutrient acquisition and uptake. This study<br />
was therefore conducted to determine the effects of soil waterlogging on the Cu, Zn, P and K<br />
nutrient concentrations and uptakes by wheat genotypes identified under field and greenhouse<br />
conditions to differ in waterlogging tolerance.<br />
MATERIALS AND METHODS<br />
A vIrgm Vertisol (ca. 46% clay) was used in the greenhouse to fill three liter size<br />
polyethylene pots perforated at the bottom. Sufficient soil from the top 0-20 cm depth layer<br />
was collected from Glen · Agricultural College campus, located about 30 km north of<br />
Bloemfontein, South Africa. <strong>The</strong> soil was pulverized and sieved to remove clogs and fibrous<br />
root materials, thoroughly mixed with Nand P nutrient solution at the rate of 70 mg N as<br />
KN0 3 and 35 mg P as K 2 HP0 4 kg"1 soil. Before filling the pots with 3 kg soil, 150 g gravel<br />
was placed at the bottom to facilitate drainage of the pots.<br />
254
Effects ofsoil waterlogging on concentration and uptake ofnutrients - Amsal et al.<br />
Five bread wheat genotypes consisting of two waterlogging-sensitive, "Et-13" and "K6290<br />
Bulk", and three waterlogging-tolerant, "PRLISara", "Vee/Myna", and "Ducula"), were<br />
selected based on their perfonnance in an on-going genotype screening experiment for<br />
waterlogging tolerance. <strong>The</strong> latter three genotypes were previously identified in field trials as<br />
tolerant to waterlogging stress (van Ginkel et at., 1992) and were kindly provided by<br />
CIMMYTIEU <strong>Eastern</strong> Africa <strong>Wheat</strong> Program. Ten seeds of each genotype were planted to<br />
two pots in each replication on the i h September 1998, covered slightly with thin-layer of<br />
loose soil and thinned to four seedlings after full emergence.<br />
All genotypes were exposed to three waterlogging treatments: 1) a control without<br />
waterlogging or free drainage (FD) where seedlings were grown in the pots allowed to drain<br />
freely; 2) transient waterlogging (TW), seedlings were waterlogged for seven days followed<br />
by seven days free drainage in 2-wk cycles for a total of seven weeks; and 3) continuous<br />
waterlogging (CW), seedlings were kept pennanently waterlogged for seven weeks. When<br />
the seedlings reached the 3-4 leaf stage (i.e., 14-day old seedlings), the pots of the<br />
waterlogging treatments were placed into a larger six liter non-perforated polyethylene pots.<br />
Waterlogging with tap water was then initiated and the level was maintained at 2-3 cm above<br />
the soil surface by watering daily throughout the treatment period.<br />
<strong>The</strong> experiment was designed with four replications as a split plot with waterlogging<br />
treatments as main plots and genotypes as subplots. <strong>For</strong> the duration of the experiment, N<br />
solution was applied to every pot at a rate of 0.5-mg N nutrient as NH4N0 3 at 2-wk intervals<br />
to avoid leaf chlorosis, which might be induced by N-deficiency. Greenhouse temperatures<br />
were maintained at 15 °c minimum and 25 °c maximum. At flowering, all the plants from<br />
one pot from each treatment were cut at soil surface, thoroughly washed in distilled water,<br />
oven-dried at 60°C for 72 hrs, the dry biomass was weighed and then ground to pass through<br />
a 1-mm sieve for nutrient analysis. At maturity, all the plants from another pot were cut at 20<br />
cm above the soil surface to avoid possibly contaminated lower plant parts, oven-dried at 60<br />
°c for 48 hrs, the dry biomass was hand-threshed and then separated into straw and grain.<br />
Both straw and grain were ground to pass through a 1-mm sieve for nutrient analysis.<br />
Determination ofsoil pH and redox potential:<br />
Soil pH and redox potential readings were detennined after 3-and 6-wk of waterlogging. An<br />
average of four readings from replicate pots was taken for each of the three waterlogging<br />
treatments using an appropriate platinum electrode. Measurements were made by inserting<br />
the electrode directly into the soil to a depth of 10 cm below the soil surface.<br />
Plant analyses:<br />
Plant mineral nutrient concentrations were detennined for the whole-plant biomass at<br />
anthesis, and straw and grain at maturity for each genotype. Sub-samples of 2-g were dryashed<br />
at 550 °C, digested in nitric acid on a hot sand-bath, dissolved in diluted RN0 3 , filtered<br />
into a volumetric flask and made to volume. <strong>The</strong> concentration of Cu, Zn and K were<br />
detennined after proper dilution by Atomic Absorption Spectrometry. P was detennined<br />
colorimetrically using the ammonium vanadate-molybdate method. Nutrient-uptake was<br />
calculated by multiplying each nutrient concentration value with their respective biomass,<br />
straw or grain masses.<br />
255
Effects ofsoil waterlogging on concentration and uptake ofnutrients - Amsal et al.<br />
Statistical analyses:<br />
All measured parameters were subjected to appropriate analysis of variance using MSTAT-C<br />
micro-software. <strong>The</strong> data on soil redox potential and pH values as well as plant response<br />
measurements in the foliar application trial were analyzed as a randomized complete block<br />
design while all other data were analyzed as a split plot design. Differences among significant<br />
treatment means were separated using least significant differences (LSD) at P :::; O.OS.<br />
RESULTS AND DISSCUSSION<br />
Soil redox potential (Eh) and pH:<br />
<strong>The</strong> effects of waterlogging on the soil Eh and pH readings after 3- and 6-wk ofwaterlogging<br />
are shown in Table 1. Soil Eh was greatly lowered by waterlogging. <strong>For</strong> both readings, CW<br />
gave significantly lower Eh-values than TW, which in turn gave significantly lower values<br />
than FD soils. <strong>The</strong> drop in Eh was much higher after 6-wk compared to 3-wk. It is generally<br />
accepted that an adequate O 2 supply to the root zone environment is essential for optimum<br />
plant growth and nutrient uptake. Oxygen is generally considered deficit around 3S0 mV at<br />
pH 7 on the Eh scale (Armstrong, 1979, 1982; Krizek, 1982; Laanbroek, 1990;<br />
Ponnamperuma, 1984). In our study, the Eh-values of the waterlogged soils, especially in<br />
CW soils, remained much lower than 3S0 m V (Table 1), suggesting that root zone<br />
oxygenation was significantly depressed by waterlogging which is in agreement with results<br />
reported by Davies and Chillman (1988), Musgrave (1992) and Thomson et al. (1992).<br />
Waterlogging reduced soil pH values at both readings in a similar manner as for Eh.<br />
Compared to the FD-treatment, pH values were reduced respectively by 0.23 and 0.S9 units<br />
under TW- and. CW- treatments after 3-wk and by 0.23 and 0.49 units after 6-wk. Increased<br />
concentrations of CO 2 , an anaerobic metabolic product, and reduced mineral nutrients in<br />
waterlogged soil (Grable, 1966; Laanbroek, 1990) could probably contribute towards<br />
reducing pH-values under waterlogging.<br />
Grain yield and biomass:<br />
Soil waterlogging markedly reduced the growth of all 'the wheat genotypes (Table 2). <strong>Wheat</strong><br />
genotypes obviously differed in their response to the waterlogging treatments and there was a<br />
significant waterlogging x genotype interaction for all pl
Effects ofsoil waterlogging on concentration and uptake ofnutrients - Amsal et aI.<br />
all the Zn concentration and uptake parameters (Tables 3 and 4). Concentration and uptake<br />
values were the highest for FD, intermediate for TW and lowest for the CW treatments for all<br />
parameters. Decreasing Zn concentrations due to waterlogging was reported in wheat<br />
(Sharma and Swarup, 1988) and sorghum (Maranville et ai., 1986). Cu concentration in grain<br />
and uptake by both whole plant and grain were significantly decreased by waterlogging<br />
(Tables 3 and 4). Maranville et ai. (l98~) also reported a reduction in Cu concentration in<br />
sorghum at booting stage by more than SO% in response to waterlogging for several<br />
genotypes studied. Bjen'e and Schierup (198S) reported significantly reduced plant Cu and Zn<br />
uptakes in waterlogged oats. A significant difference among genotypes was detected in grain<br />
Cu concentration and its uptake by the whole plant. <strong>The</strong> Zn concentration in the whole plant,<br />
straw and grains and its uptake by grain differed significantly among genotypes (Tables 3 and<br />
4). Tolerant genotypes had significantly higher concentrations and uptake of Zn. Significant<br />
variations among genotypes in Cu- and Zn concentrations were reported in waterlogged<br />
sorghum (Maranville et ai. 1986). In comparison with the nutrient sufficiency values<br />
previously published (Bergmann, 1992; Melsted et ai., 1969), the average concentrations of<br />
both Zn and Cu in waterlogged plants dropped below the 'critical' level of O.SO and I.S0%,<br />
respectively, indicating that the Zn and Cu nutrient deficiencies were high in waterlogged<br />
plants. Uptake and metabolism of Zn is disturbed by high concentrations of P in the soil,<br />
especially when accompanied by high pH values and high clay and organic matter contents of<br />
the soil (Bergmann, 1992). <strong>The</strong> experimental soil used in this study had high organic matter<br />
(3.12%) and clay (46%) content; the pH values (Table 1) during experimental period<br />
remained well within the range (6.S-8.0) reported to cause Zn deficiency (Bergmann, 1992).<br />
<strong>The</strong> low Zn concentrations and uptake observed under waterlogging in this experiment<br />
(Tables 3 and 4) could partly also be attributed to an increase in P-concentration in soil<br />
(Phillips, 1998) which exacerbates soil Zn deficiency by enhancing bonding of Zn to oxides<br />
and hydroxides of Fe (Loneragan et ai., 1979) and to free organic oxides and bicarbonates<br />
(<strong>For</strong>nco et ai., 1975) in waterlogged soils.<br />
Phosphorus concentration and uptake:<br />
<strong>The</strong> effect of waterlogging on grain P concentration and whole plant P uptake depended on<br />
wheat genotypes (Table 6 and 7). Grain P concentration significantly decreased in Et-13,<br />
K6290-bulk and PRLISara than in other genotypes in response to waterlogging, especially for<br />
the CW treatment. Whole plant P uptake significantly decreased for all genotypes as severity<br />
in waterlogging increased. <strong>The</strong> reduction was greater for ET-13, K6290-bulk and PRLISara<br />
than for the other genotypes. Huang et af. (l99S) reported significant differences in shoot and<br />
root P concentration between sensitive and tolerant wheat genotypes in response to<br />
waterlogging. Whole plant, straw and grain P-concentrations as well as straw P uptake were<br />
significantly different among the wheat genotypes studied (Tables 3 and 4). P uptake by and<br />
concentration in the whole plant, straw or grain were greater for one or more of the tolerant<br />
genotypes than for the more sensitive ET -13 or K6290-bulk. <strong>The</strong> P-concentrations in the<br />
whole plant, straw, grain, and uptake by the whole plant and grain were significantly affected<br />
by waterlogging (Tables 3 and 4). Concentration and uptake parameters of P significantly<br />
decreased with increased waterlogging stress. When compared with 'critical' and sufficiency<br />
P nutrient levels on wheat, P concentration fell well below the 'critical' value of 0.30%<br />
reported by Melsted et ai. (1969), indicating that waterlogged plants were P deficient. Similar<br />
results were also reported for waterlogged wheat (Sharma and Swarup, 1988; Steiger and<br />
Feller, 1994), barley (Leyshon and Sheard, 1974) and sorghum (Maranville et ai., 1986). <strong>The</strong><br />
decline of P concentration observed in the waterlogged whole plants and grains (Table 3)<br />
could suggest that P absorption and transportation under waterlogging condition were<br />
257
Effects a/soil waterlogging on concentration and uptake a/nutrients - Amsal et al.<br />
significantly suppressed by an O 2 deficiency due to impaired root functioning (Trought and<br />
Drew, 1980a and b) and lack of energy for ion uptake (Barrett-Lennard etal., 1990).<br />
Potassium concentrations and uptake:<br />
<strong>The</strong> effect of waterlogging· on the uptake and concentration parameters of K (Tables 5 and 6)<br />
depended on the wheat genotypes studied. Straw K concentration declined progressively with<br />
increased waterlogging severity for all genotypes except for PRLfSara and Ducula for which<br />
the concentration was slightly increased for the TW treatment. Increasing severity in<br />
waterlogging led to lower K uptake for the sensitive ET -13 and K6290-bulk than for other<br />
genotypes. Huang et al. (1995) also reported lower stem K concentration for sensitive than<br />
for tolerant genotypes in response to waterlogging. Trought and Drew (l980a and b) ascribed<br />
low nutrient uptake and transportation through waterlogged roots as the cause for reduced K<br />
accumulation in plants. All parameters of K concentration and -uptake (except whole plant K<br />
concentration and straw K uptake) were significantly different among wheat genotypes<br />
(Tables 3 and 4). Waterlogging significantly affected all uptake and concentration parameters<br />
of K (Tables 3 and 4). K concentration and uptake were significantly decreased as<br />
waterlogging severity increased. Whole plant K concentration, measured at anthesis for<br />
waterlogged plants, were also lower than the 'critical' value of 1.80% reported on wheat<br />
(Melsted et al., 1969). Hence, waterlogged plants in this study were deficient in K, which is<br />
in agreement with previous reports on wheat (Huang et al., 1995; Sharma and Swarup, 1988;<br />
Stieger and Feller, 1994; Trought and Drew, 1980a and b), barley (Drew and Sisworo, 1979;<br />
Leyshon and Sheard, 1974), and on sorghum (Maranville et al., 1986).<br />
CONCLUSIONS<br />
Waterlogging treatments significantly reduced vegetative dry biomass, straw and grain yields<br />
for all genotypes, but to a greater extent for the sensitive ET -13 and K6290-bulk. Root zone<br />
oxygenation was significantly depressed by the waterlogging treatments as indicated by<br />
lower redox potentials. Nutrient concentration and uptake of wheat under different<br />
waterlogging regimes differed among genotypes. <strong>The</strong> "sensitive genotypes accumulated less<br />
Cu, Zn, K and P than the tolerant genotypes under waterlogged soil conditions.<br />
Concentrations of all nutrients except Cu appeared to be lower than the 'critical' values<br />
previously reported for wheat. <strong>The</strong> results indicated that the damaging effects of<br />
waterlogging on wheat could be attributed to the decreasing nutrient uptakes due to O 2<br />
deficiency in the root zone, particularly P and Zn deficiencies. Zn deficiency is most common<br />
in cool and wet highland Vertisols with high montmorillonite clay, pH values, and phosphate<br />
and organic matter content. In a breeding program aimed at improving waterlogging<br />
tolerance in wheat, selection of genotypes with greater ability to overcome the waterlogginginduced<br />
nutrient deficiency, particularly P and Zn deficiency could improve wheat<br />
productivity in waterlogged soils.<br />
ACKNOWLEDGMENTS<br />
This experiment was financially supported by the CIMMYT fCIDA <strong>Eastern</strong> Africa Cereals<br />
Program and the CIMMYTIEU <strong>Wheat</strong> BreedinglPathology Project in collaboration with the<br />
Ethiopian Agricultural Research Organization (EARO) and the Department of Soil Science,<br />
Orange Free State University, RSA.<br />
258
Effects ofsoil waterlogging on concentration and uptake ofnutrients - Amsal et al.<br />
REFERENCES <br />
Armstrong, W. 1979. Aeration in higher plants. Adv. Bot. Res,. 7: 225-331.<br />
Armstrong, W. 1982. Waterlogged soils. In: Environment and Plant Ecology. Ed. J R Etherington. pp 180-218.<br />
John Wiley and Sons Publishers, Chichester, UK.<br />
Barrett-Lennard, E.D., Davidson, N. and Galloway, R. 1990 Plant growth and survival in saline, waterlogged<br />
soils. W.A. 1. Agric., 31 : 56-57.<br />
Bjerre, G.K. and Schierup, H.H. 1985. Influence of waterlogging on availability and uptake of heavy metals by<br />
oat grown in different soils. Plant and Soil, 88: 45-56.<br />
Bergmann, W. 1992. Nutritional disorders ofplants: development, visual and analytical diagnosis. Gustav<br />
Fischer, New York. 741p.<br />
Drew, M.e. and Sisworo, E.J. 1979. <strong>The</strong> development ofwaterlogging damage in young barley plants in relation<br />
to plant nutrient status and changes in soil properties. New PhytoL, 82:301-314.<br />
Drew, M.C. and Lynch, J.M. 1980. Soil anaerobiosis, microorganisms and root function. Ann. Rev. Phyt., 18:37<br />
66.<br />
<strong>For</strong>no, D A., Yoshida, S. and Asher, e.T. 1975. Zinc deficiency in rice. 1. Soil factors associated with the<br />
deficiency. Plant and Soil 42: 537-550.<br />
Grable, A.R. 1966. Soil aeration and plant growth. Adv. Agron., 18: 57-106.<br />
Huang, B., Johnson, 1.W., NeSmith, D.S. and Bridges, D.e. 1995. Nutrient accumulation and distribution of<br />
wheat genotypes in response to waterlogging and nutrient supply. Plant and Soil, 173: 47-54.<br />
Jutzi, S. and Abebe, M. 1986. Improved agPicultural utilization of Vertisols in Ethiopian highlands - an<br />
international approach. In : <strong>The</strong> First IBSRAM Net workshop in African Improved Management of<br />
Vertisols. pp 173-183 .Nairobi, Kenya.<br />
Kozlowski, T.T. 1990. Plant responses to flooding of soil. Bioscience, 34: 162-167.<br />
Krizek, D.T. 1982. Plant response to atmospheric stress caused by waterlogging. In: Breeding Plants for less<br />
favorable environments. Eds. M.N. Christiansen, and e.F. Lewis. pp. 293-334. John Wiley and Sons,<br />
Inc. New York.<br />
Laanbroek, H.1. 1990. Bacterial cycling of minerals that affect plant growth in waterlogged soils: a review.<br />
Aquatic Botany, 38: 109-125.<br />
'<br />
Leyshon, A.J. and Sheard, R. W. 1974. Influence of short-tenn flooding on the growth and plant nutrient<br />
composition of barley. Can. 1. Soil Sci., 54: 463-473.<br />
Loneragan, 1.F., Grave, T.S., Robson, A.D., and Snowball, K. 1979. Phosphorus toxicity as a factor in zincphosphorus<br />
interactions in plant. Soil Sci. Soc. Am. 1.,43: 966-972.<br />
Maranville. J.W., del Rosario, D.A., Dalmacio, S.A. and Clark, R.B. 1986. Variability in growth and nutrient<br />
accumulation in sorghum grown in waterlogged soil. Corrimun. Soil Sci. Plant AnaL, 17: 1089-) 108.<br />
Melsted, S.W., Motto, H.L. and Peck, T.R. 1969. Critical plant nutrient composition values useful in interpreting<br />
plant analysis data. Agron., 1., 61; 17-20.<br />
Phillips, I.R. 1998. Phosphorus availability and sorption under altema.ting waterlogging and drying conditions.<br />
Commun. Soil Sci. Plant AnaL, 29:3045-3059.<br />
Ponnamperuma, F.N. 1984. Effects of flooding on soil. In: Flooding and Plant growth. Ed. T.T. Kozlowski. pp.<br />
9-45. Academic Press, London, UK.<br />
Resen, e.J. and Carlson, R.M. 1984. Influence ofroot zones oxygen stress on potassium and ammonium<br />
absorption by Myrobalan plum rootstock. Plant and Soil, 80:345-353.<br />
Setter, T. and Belford, B. 1990. Waterlogging: how it reduces plant growth and how plants can overcome its<br />
effect. W.A. J. Agric., 31 :51-55.<br />
Sharma, D.P. and Swarup, A. 1989. Effect of short-tenn waterlogging on growth, yield and nutrient composition<br />
ofwheat in alkaline soils. J. Agric. Sci., Camb., 112: 191-197.<br />
Stepniewski, W. and Przywara, G. 1992. <strong>The</strong> influence ofsoil oxygen availability on yield and nutrient uptake<br />
(N, P, K, Ca, Mg, Na) by winter rye (Secale cereale). Plant and Soil, 143: 267-274.<br />
Stepniewski, W. and Labuda, S. 1989. <strong>The</strong> influence of 10 days' flooding in seven development stages of spring<br />
barley on its growth, yield, and N, P, and K. Polish 1. Soil ScL, XXII: 101-109.<br />
Stieger, P.A. and Feller, U. 1994. Nutrient accumulation and translocation in maturing wheat plants grown on<br />
waterlogged soil. Plant and Soil, 160: 87-95.<br />
Trought, M.e.T. and Drew, M.e. 1980a. <strong>The</strong> development ofwaterlogging damage in wheat seedlings (Triticum<br />
aestivum L.) 1. Shoot and root growth in relation to changes in the concentrations ofdissolved gases and<br />
solutes in the soil solution. Plant and Soil, 54:77-94.<br />
Trought, M.C.T. and Drew, M.e. 1980b. <strong>The</strong> development of waterlogging damage in wheat seedlings (Triticum<br />
aestivum L.) II. Accumulation and redistribution of nutrients by the shoot. Plant and Soil, 56:187-199.<br />
259
Effects ofsoil waterlogging on concentration and uptake ofnutrients - Amsal et al.<br />
van Ginkel, M., Rajaram, S. and Thijsen, M. 1992. Waterlogging in wheat: germplasm evaluation and<br />
methodology development. In: Seventh <strong>Regional</strong> <strong>Wheat</strong> <strong>Workshop</strong> for <strong>Eastern</strong>, Central and Southern<br />
Africa. Eds. D.G. Tanner and W. Mwangi., pp, 115-121. Nakuru, Kenya: CIMMYT.<br />
Table 1. Mean effects of waterlogging on soil pH and redox potential, 1998/99.<br />
Redox potential (mY)<br />
,', SoilpH<br />
WaterloggIng ·3:'wk 6-wk. ·J~Wk 6.;.;wk ,<br />
Free drainage 394a+ 410a 7.15a 7.20a<br />
Transient 271b 163b 6.92b 6.92b<br />
Continuous 135c 10c 6.61c 6.71b<br />
Prob. *** . *** *** ***<br />
LSD(0.05) 21 37 0.11 0.25<br />
Mean 266.67 194.33 6.89 6.94<br />
C.V.[%) 7.58 17.73 1.45 3.27<br />
..<br />
**, *** Represent slgmficance at 0.01 and 0.001 probablhty level. <br />
+Means followed by the same latter are not significantly different at 0.05 probability level. <br />
Table 2.<br />
Mean effects of waterlogging x genotype interaction on whole plant dry<br />
biomass at anthesis, and final straw and grain yield of wheat, 1998/99.<br />
Genotype<br />
Whole plant Dry<br />
' biomass<br />
TW<br />
" .<br />
Grain yield<br />
' . ' FD ' TW CW<br />
:. ,.<br />
", FD*<br />
CW Fn Strawyield<br />
TW" " CW<br />
g/p1ot<br />
ET-13 37.22 33.32 16.06 35.24 28.62 19.76 30.08 25.60 13.05<br />
K6290-bu1k 37.13 29.88 24.41 30.51 24.55 22.82 26.85 17.69 15.00.<br />
VeelMyna 34.38 27.74 27.08 28.61 23.96 23.45 26.46 22.95 19.67<br />
PRL/Sara 32.14 21.24 15.70 3l.97 24.46 21.45 23.50 20.85 14.38<br />
Ducula 29.67 28.47 19.15 27.71 23.00. 21.99 23.59 2l.86 19.37<br />
LSD(0.05) 4.50 3.11 2.908<br />
FD-Freely dramed control; TW-transient waterloggmg; CW-contmuous waterloggmg<br />
260
Effects ofsoil waterlogging on concentration and uptake ofnutrients - Amsal et al.<br />
I<br />
Table 3. Mean eu, Zn, P and K concentrations and statistical significance of treatment effects in bread wheat genotypes, 1998/99.<br />
'w' h"" I' ') 1;:'" -"'1 )' , "h . :0\ ' " S' . ,.,:_0"/< -'" " .c' .";', " - J " ",,[ ',., -i" , ':" ,",<br />
.':': • ",t>'" 0 e pi ant:~IOlJ.hISs ~at antes.!; trawat,-arvest .J .: _:{;; . ;';.;:, , . ~li,alD?a( h.ar~est:f£ .,.c:;-':' ,. i<br />
· Fac~or ."f.~ ·,;{'·Cu" , ·,:,,·~rif ·.. .j.;:: J{' ~ )1 ' " }:$P .: ...;_, ,, ,Jilu ~' .;: · Zri~ , :);tI"r ': K ,.;~' Ji'; ' "t ' , J~ \C.,f (·~·''' ' Zn· >: . ;,5~(,, ;K; ,J~ '. /'! . ~t~;;:-<br />
'. ,:.;:/:, ( "'gJ.k'g'b~M) 'S' (itlgl ,·}-;tt (%. ) ~.... ;; ~'( ' ~k DM) ' ,(aJ'i.;--;:,,:., (l'l
Effects ojsoil waterlogging on concentration and uptake ojnutrients 7 Amsal et al.<br />
Table 4. Statistical significance of treatment effects and mean Cu, Zn, K and P uptake by bread wheat genotypes, 1998/99.<br />
'Vhole plantbiorpass (mg/pot)<br />
Factor at anthesis Straw uptake (m~/p()t) atbarvest Grain uptake (ntWpot) a't harVest<br />
Zil P Cu Zn P .. K "<br />
,. Cu -' Zn P K<br />
Cu 'K Waterlo~ging (W) ** *** *** *** Ns *** Ns *** ** *** *** ***<br />
Control 0.19a 0.50a 55.2a 716.76a 0.07 0.19a 8.4 589.20a 0.16a 0.54a 9.83a 67.78a<br />
Transient 0.15a 0.22b 37.0b 418.47b 0.07 0.10b 8.2 464.06b 0.13b 0.40b 6.73a 54.20b<br />
Continuous 0.09b 0.13c 21.lc 256.00c 0.04 0.09b 11.4 301.26c 0.07c 0.29c 4.98b 38.02c<br />
LSD(0.052 0.047 0.033 7.4 5.19 ----- 0.033 --- 6.22 0.04 0.06 1.8 2.68<br />
Genotype (G) * Ns Ns *** Ns Ns ** Ns Ns *** Ns ***<br />
ET-13 0.16a 0.28 38.8 507.46a 0.06 0.13 9.8ab 451.66 0.10 0.35c 6.99 49.92cd<br />
K6290-Bu1k 0.16a 0.31 35.4 476.82c 0.07 0.13 8.2b 442.51 0.12 0.39bc 7.18 53 .18bc<br />
Vee/Myna 0.16a 0.26 40.6 484.55b 0.06 0.12 8.4b 494.79 . 0.12 0.41b 6.85 56.95ab<br />
PRLfSara 0.12b 0.28 34.2 404.5ge 0.06 0.12 8.6b 433.08 0.12 0.42b 7.11 45.60d<br />
Ducula O.14ab 0.30 39.8 445.30d 0.05 0.15 11.4a 435.48 0.13 0.49a 7.71 61.02a<br />
LSD(0.05) 0.025 ---- ----- 4.36 ----- ---- 2.0 -------- ----- 0.05 ------ 5.13<br />
WxG Ns Ns ** * Ns Ns Ns ** * *** ** ***<br />
C.V.(%) 21.21 18.87 17.01 11.35 25.16 28.52 ' 24.83 12.46 23.71 13.48 12.87 11.62<br />
" '.<br />
262
Effects ofsoil waterlogging on concentration and uptake ofnutrients - Amsal et al.<br />
Table 5. Mean effects of waterlogging x genotype interaction on Cu, Zn, P and K nutrient concentration in bread wheat genotypes,<br />
1998/99.<br />
.<br />
FD w<br />
- .<br />
,~,<br />
Grain - ' Straw<br />
Zh P K<br />
:-
EFFECT OF CROP ROTATION AND FERTILIZER APPLICATION <br />
ON WHEAT YIELD PERFORMANCE ACROSS FIVE YEARS <br />
AT TWO LOCATIONS IN SOUTH-EASTERN ETHIOPIA <br />
Amanuel Gorfu I , Kefyalew Girma I , D.G. Tanner2, Asefa Taa l and Shambel MaruI<br />
IKulumsa Agricultural Research Center (EARO), P.O. Box 489, Asella, Ethiopia<br />
2CIMMYT/CIDA <strong>Eastern</strong> Africa Cereals Program, P.O. Box 5689, Addis Ababa, Ethiopia<br />
ABSTRACT<br />
A crop rotation experiment was initiated at the Asasa and Kulumsa locations<br />
in 1992. At both locations, the rotation crops used were faba bean (Vidafaba),<br />
rapeseed (Brassica carinata), and barley (Hordeum vulgare) in 2- and 3<br />
course rotations with wheat (Triticum aestivum); continuous wheat was<br />
included as a control treatment. Two rates of nitrogen (30 and 60 kg N ha- I )<br />
and two rates of phosphorus (0 and 20 kg P ha- I ) in factorial combination were<br />
applied as subplots within rotations during the period from 1995 to 1999. <strong>The</strong><br />
combined analysis of the results generated at each location during 1995 to<br />
1999 showed that rotation had a significant effect on wheat grain yield and<br />
most yield components of wheat at both Kulumsa and Asasa. At both<br />
locations, rotation with faba bean had a marked effect on the grain yield of<br />
wheat. <strong>Wheat</strong> following faba bean in a 2-course rotation (FbW and first<br />
wheat after faba bean in a 3-course rotation (Fb WW) significantly out yielded<br />
all other treatments at Kulumsa. At Asasa, first wheat after rapeseed in a 2<br />
course rotation (RpW) did not differ from the faba bean treatments (i.e., PbW,<br />
FbWW, FbWW). <strong>The</strong> treatments FbW and FbWW resulted in grain yield<br />
increments of 1.37 and 1.30 t ha- I , respectively; relative to the continuous<br />
wheat treatment at Kulumsa, whereas at Asasa grain yield increases were 0.86<br />
and 1.05 t ha- I , respectively. At both locations, there was no significant<br />
difference between the yield of wheat in barley 'rotations and continuous<br />
wheat. Crop rotation treatments exerted significant effects on wheat grain<br />
yield response to applied N and P nutrients: rotation with faba bean minimized<br />
wheat response to fertilizer N; crop rotation, in general, tended to enhance<br />
wheat response to applied P.<br />
INTRODUCTION<br />
Sustainable agriculture has been defined as "the successful management of resources for<br />
agriculture to satisfy changing human needs while maintaining or enhancing the quality of<br />
the environment and conserving natural resources" (TAC, 1988). <strong>The</strong> maintenance of longterm<br />
agricultural productivity depends on a number of biotic and abiotic factors, all of which<br />
are dynamic in response to human intervention. Conservation tillage and crop rotation are<br />
considered to be the major means of maintaining agricultural productivity globally (Lal,<br />
1989).<br />
Practical rotation options for cropping systems in wheat producing zones have been<br />
considered in only a few cases in sub-Saharan Africa (SSA). Most of these studies have<br />
264
Effect ojcrop rotation andJertilizer application on wheat yield - Amanuel et at.<br />
focused on the short-tern1 agronomic benefits from break or precursor crops for wheat<br />
production (Hailu et aI., 1989). One eight year rotational study in Ethiopia provided extensive<br />
infoffi1ation on the impact of various cropping sequences on wheat grain yield (Amanuel and<br />
Tanner, 1991), but this particular set of trials contained several methodological flaws<br />
(Amanuel et ai., 1994).<br />
Fertilizer rates have been recommended for wheat production in SSA without considering the<br />
sustainability of continuous fertilizer application. In Ethiopia, high rates of nitrogen (N)<br />
applied to bread wheat in single-season on-farm fertilizer trials had repercussions on soil pH<br />
levels, severity of wheat foliar disease, and weed incidence and competition (Tanner et ai.,<br />
1993). However, there are no reports available on the long-term effects of repeated Nand<br />
phosphorus (P) application at the rates recommended for wheat production.<br />
In the peasant farming systems of south-eastern Ethiopia, cereals predominate, often<br />
occupying over 80% of the total cropped land each season (Chilot et ai., 1992). In the<br />
highland zones, bread wheat and barley are the most common cereals in production, while<br />
faba bean and rapeseed are the most common grain legume and oilseed crops, respectively.<br />
<strong>The</strong> high proportion of wheat and barley in the highland cropping systems satisfies the shortteffi1<br />
subsistence objectives of peasant farmers, but may prove detrimental in the 10ng-teffi1<br />
due to the absence of the inherent advantages of crop rotational systems. Crop rotation could<br />
be extremely beneficial in the peasant faffi1ing sector for several reasons: N fixation by<br />
legumes (Hargrove et ai., 1983); the interruption of weed (Heenan et ai., 1990), disease and<br />
insect cycles by dicotyledonous crops; crop diversification (Zentner and Campbell, 1988);<br />
improvement in soil tilth and a concomitant reduction in rainfall runoff and erosion (Higgs et<br />
ai., 1990). "<br />
Several short-telm studies in the Ethiopian highlands have examined the beneficial effects of<br />
break crops on wheat production. In one study, a faba bean break crop increased wheat grain<br />
yield by 1100 kg ha- I , or 69%, cf. the yield of second year continuous wheat (Hailu et ai.,<br />
1989); in a second study, faba bean increased wheat yield by 1000 kg ha- I , or 44%, cf. the<br />
yield of continuous wheat (Asefa et ai., 1992). However, no studies have previously<br />
considered the long-term effects of diverse cropping sequences on the Ethiopian cropping<br />
environment.<br />
This paper presents a combined analysis of wheat agronomic data generated during the period<br />
from 1995 to 1999 in an ongoing study conducted at two locations in a major bread wheat<br />
production zone in south-eastern Ethiopia. Previous reports have summarized results obtained<br />
during the first four years of this trial regarding effects of rotation on weed populations<br />
(Amanuel et ai., 1996a), soil nitrate and compaction characteristics (Amanuel et ai., 1996b),<br />
crop yield components (Asefa et ai., 1997), and soil-borne pathogen incidence (Tezera et ai.,<br />
1996). <strong>The</strong> objective of this paper is, therefore, to evaluate the long-term effects of alternate<br />
crop rotation systems on wheat productivity, and on wheat response to inorganic fertilizer.<br />
MATERIALS AND METHODS<br />
<strong>The</strong> rotation experiment was initiated during 1992 at the Kulumsa (8°02'N and 39°10'E) and<br />
Asasa (7°08'N and 39°13 'E) research sites in Arsi Region of Ethiopia; the station soils are<br />
classified as an intergrade (between an eutric Nitosol and a luvic Phaeozem) and an eutric<br />
Nitosol, respectively. <strong>The</strong> soil clay content is approximately 45% at Kulumsa and 35% at<br />
265
Effect ofcrop rotation andfertilizer application on wheat yield - Amanuel et at.<br />
Asasa. <strong>The</strong> average monthly mean minimum temperatures during the annual growing season<br />
are 10.6 and 6.7°C, and the corresponding average monthly mean maximum temperatures are<br />
22.1 and 22.7°C, respectively. Total annual precipitation is 824 and 665 mm, and that<br />
received during the June-November growing season is 504 and 472 mm, respectively (1 970!.<br />
95 means). <strong>The</strong> stations are situated at altitudes of 2200 and 2360 m a.s.l., respectively. <strong>The</strong><br />
experimental sites used for the rotation trials had been sown to unfertilized wheat crops in<br />
1991. .<br />
<strong>The</strong> trial incorporates three fundamental design principles consistently stressed in the<br />
statistical literature on multi-rotation experiments (Patterson, 1965; Preece, 1986; Cady,<br />
1991):<br />
• Each phase of a specific rotation is present in the experiment every year to avoid<br />
assessing the effects of the rotational crops under differing seasonal conditions (i.e.,<br />
confounding treatment and year effects). A three year cycle requires three plots in each<br />
replication to include all three phases of the rotation, while a two year cycle occurs in two<br />
phases each year.<br />
• Randomization is essential to avoid anomalies from systematic assignment of treatments<br />
to field plots, and is fundamentano the validity of statistical analyses. ~<br />
• Replication is required to estimate experimental error and to minimize the magnitude of<br />
the standard error of treatment means.<br />
<strong>The</strong> experiment was laid out in a split-plot design with crop rotations as main plots and<br />
fertilizer levels as subplots. <strong>The</strong> crop rotations are wheat-based, and reflect the predominant<br />
crops in the surrounding farming system: faba beah, rapeseed and barley. Treatments 1 to 15<br />
(Table 1) comprise all phases of wheat in two and three year rotations with the three break<br />
crops, while treatment 20 consists of continuous wheat. Treatment pairs 16 and 17 and 18 and<br />
19 comprise a partial sampling of all potential phases of complex six and four year rotations,<br />
respectively. <strong>The</strong> four fertilizer levels used during the period 1995-1999 were the factorial<br />
combinations of30 and 60 kg N ha- 1 with 0 and 20 kg P ha- 1 • <strong>The</strong> four fertilizer combinations<br />
were maintained as fixed subplots over the duration of the trial. Urea and triple<br />
superphosphate are the sources of Nand P, respectively. <strong>The</strong> trial is laid out in three<br />
replications, and the area of each main plot is 100 m 2 with each fertilizer subplot having an<br />
area of 25 m 2 •<br />
Tillage for this trial is based on the local ox-plough; crop protection practices simulate farmer<br />
practices (i.e., hand weeding); varietal selection is optimal for each crop, and open to change<br />
over the trial duration. <strong>The</strong> recommended varieties used during the 1995-1999 period for the<br />
various crop species were: for bread wheat, HAR 1685 (Kubsa); for barley, ARDU 12-60B;<br />
for faba bean, CS20DK; for rapeseed, Yellow Dodola. <strong>The</strong> seed rates used were 150 kg ha- 1<br />
for bread wheat, 200 kg ha- 1 for faba bean, 15 kg ha- 1 for rapeseed, and 130 kg ha- I for barley.<br />
Pre-weighed amounts of seed and fertilizer were broadcast applied on the soil surface of the<br />
appropriate plots after tillage by ox-plough, and were subsequently incorporated, in the<br />
traditional Ethiopian practice, by one pass of the ox-plough. Sowing dates followed farmers '<br />
practice at both sites (i.e., sowing from mid June to early July as soon as sufficient rain has<br />
been received to saturate the surface soil layer).<br />
266
Effect ofcrop rotation and fertilizer application on wheat yield - Amanuel et al.<br />
Each year, at crop maturity, a net plot of 9 m 2 from each subplot was harvested by sickle at<br />
ground level for grain and biomass yield determination. Grain moisture contents were<br />
determined and yields adjusted to a 12.5% moisture basis for wheat.<br />
Table 1. Treatments included in the crop rotation experiment at Kulumsa and Asasa.<br />
·.. · t~J9()~, .' " ' ;"'19~n ,',<br />
! " :. ,<br />
Treat. . Rota:t~on;. : J99~ : "' , '. . ' < .>:' 't 1998 1~99<br />
,~ . . , .<br />
'·r~; _<br />
.. " . -r " . '.<br />
'~ " ' .' '..<br />
" .'<br />
' Ph~~e " , :<br />
1 1-1 W* Fb W Fb W<br />
2 1-2 Fb W Fb W Fb<br />
3 2-1 W Ba W Ba W<br />
4 2-2 Ba W Ba W Ba<br />
5 3-1 W Rp W Rp W<br />
6 3-2 Rp W R W R<br />
7 4-1 Rp W W Rp W<br />
8 4-2 W W Rp W I W<br />
9 4-3 W Rp W W Rp<br />
10 5-1 Fb· W W Fb W<br />
11 5-2 W W Fb W W<br />
12 5-3 W Fb W W Fb<br />
13 6-1 Ba W W Ba W<br />
14 6-2 W W Ba W W<br />
15 6-3 W Ba W W Ba<br />
16 7-1 Rp W W Fb W<br />
17 7-2 Fb W W Rp W<br />
"<br />
18 8-1 W Fb W Rp W<br />
19 8-2 W Rp W Fb W<br />
20 - W W W W W<br />
* W = wheat, Ba = barley, Fb = faba bean, Rp = rapeseed.<br />
In the current report, data generated during 1995-199? from wheat in 2- and 3-course<br />
rotations and the continuous wheat treatment are considered. Combined analysis of data was<br />
conducted across years for each location using ANOVA. Year was treated as a main factor,<br />
and rotation and fertilizer as sub- and sub-sub-factors, respectively.<br />
RESULTS AND DISCUSSION<br />
Rotation Effects on <strong>Wheat</strong> Grain Yield<br />
<strong>The</strong> results of the ANOVA of the rotation experiments conducted at Kulumsa and Asasa<br />
combined over the period 1995 to 1999 are presented in Tables 2 and 3. <strong>The</strong> results revealed<br />
that rotation had significant effects on wheat grain yield (GY) and the majority of yield<br />
components at both locations. Rotation by year interaction effect was significant for GY and<br />
some wheat parameters. Differences among rotations were distinct at both locations. Dicot<br />
precursor crops resulted in higher GYs of subsequent wheat crops relative to the continuous<br />
cereal cropping systems (Tables 4 and 5). At both locations, faba bean had the most dramatic<br />
effect on the GY ofa succeeding wheat crop.<br />
267
Effect ofcrop rotation and fertilizer application on wheat yield - Amanuel et at.<br />
At Kulumsa, wheat after faba bean in a 2-course rotation (FbW) and first wheat after faba<br />
bean in a 3-course rotation (Fb~ significantly out yielded all other rotation treatments<br />
included in the current study (Table 4). <strong>The</strong> superior performance of these two treatments<br />
suggests that the growth and development of the first wheat following a precursor faba bean<br />
crop is probably benefiting from atmospheric N2 fixed by faba bean and available soil<br />
mineral N spared by the legume. <strong>The</strong> top yielding faba bean treatments, FbW and FbWW,<br />
gave GY increments of 1.37 and 1.30 t h'a- I , respectively, in comparison to the continuous<br />
wheat treatment at Kulumsa. Second wheat after faba bean (Fb WW) produced a GY similar<br />
to the rapeseed precursor treatments (i.e., RpW, RpWW and RpWW). FbWW, RpW and<br />
RpWW exhibited equal performance producing additional GY of 0.62, 0.67 and 0.64 t ha- I ,<br />
respectively, relative to continuous wheat. Although oilseed rape is not an N2 fixing crop,<br />
such GY increases after a rapeseed precursor presumably reflect other crop rotation<br />
advantages such as improved soil structure and reduced incidence of diseases and weeds<br />
(Kirkegaard et at., 1994). Regarding soil structure improvement, an earlier report revealed<br />
that penetrometer resistance (PR) was reduced in rapeseed plots relative to faba bean plots<br />
(Amanuel et at., 1996b). In the current study, there was no difference among the rapeseed<br />
treatments; however, RpWW produced the lowest GY, and as a result was not significantly<br />
different in GY from wheat in the. barley rotations (i.e., BaW, BaWW and BaWW) or<br />
continuous wheat (Table 4).<br />
At Asasa, wheat GY responded to rotation treatments in a similar fashion to GY at Kulumsa.<br />
<strong>The</strong> faba bean treatments Fb Wand Fb WW were the highest yielding treatments at Asasa<br />
(Table 5). <strong>The</strong> GY increments of these treatments cf. continuous wheat were 0.86 and 1.05 t<br />
ha- I , respectively. <strong>The</strong> GY performance of the fa~a bean treatments at Asasa followed the<br />
order FbWW > FbWW, while FbW was intermediate. <strong>The</strong> GY of RpW was higher than that<br />
of RpWY:L. and was comparable to the faba Dean treatments, giving an additional GY of 0.6 t<br />
ha- I relative to continuous wheat. <strong>The</strong> GYs of FbW, FbWW, RpW and RpWW were not<br />
significantly different from each other. As at Kulumsa, the GYs of wheat following a barley<br />
precursor and continuous wheat were not significantly different from each other.<br />
Rotation Effects on <strong>Wheat</strong> Yield Components<br />
<strong>The</strong> results of the ANOV A for rotation effects on wheat 'yield components are presented in<br />
Tables 2 and 3. Among the wheat parameters, plant height, number of spikes m- 2 and number<br />
of grains per spike were significantly influenced by rotation systems at both locations. <strong>Wheat</strong><br />
seedlings m- 2 , thousand kernel weight (TKW), and harvest index (HI) were significantly<br />
influenced by rotation at one location only.<br />
<strong>Wheat</strong> plant height (PH) significantly increased in faba bean rotations at both locations. Fb W<br />
and FbWW exhibited an equal height increase of 5 cm at Kulumsa and 6 cm at Asasa relative<br />
to continuous wheat (Tables 4 and 5). <strong>The</strong> continuous cereal rotations resulted in relatively<br />
shorter wheat plants, reflecting the positive contribution of faba bean as an N source for the<br />
enhanced growth of the wheat crop.<br />
<strong>The</strong> maximum number of spikes m- 2 occurred in FbW and FbWW plots at both Kulumsa and<br />
Asasa, indicating that seedlings and tillers developing during the early vegetative stage were<br />
more vigorous in the first wheat following faba bean, presumably because of a surplus N<br />
supply from different sources (i.e., fertilizer, fixed N, soil). Ultimately, these treatments also<br />
resulted in significantly more grains per spike. vVheat following rapeseed and in continuous<br />
cereal rotations did not differ in the number of grains per spike.<br />
268
Effect ofcrop rotation andfertilizer application on wheat yield - Amanuel et at.<br />
HIs of the semi-dwarf wheat cultivar used in this experiment were generally high at Kulumsa,<br />
ranging from 43.3% for RpWW to 45.1 % for FbWW. At Asasa, the highest HI, 39.8%, and<br />
the lowest HI, 36.8%, were recorded on BaW and the continuous wheat, respectively.<br />
TKW was not significantly affected by treatments at Asasa. However, at Kulumsa, FbW<br />
exhibited a higher TKW than FbWW, RpWW, BaWW and continuous wheat (Table 4).<br />
Rotation x Nutrient Interaction Effects<br />
Applied Nand P exerted a significant influence on wheat GY and some yield components at<br />
Asasa (Table 3). <strong>The</strong> higher rate of 60 kg N ha- l enhanced GY, PH and spikes m- 2 , but<br />
reduced HI and TKW relative to the lower N rate (30 kg ha- l ). Application of 20 kg P ha- l<br />
significantly increased PH, spikes m- 2 , TKW and Gy.<br />
<strong>The</strong> effect ofN and P was limited to certain yield components at Kulumsa (Table 2). GY, PH,<br />
spikes m- 2 and grains spike- l increased significantly with the higher N rate. Applied P only<br />
increased PH and spikes m- 2 significantly.<br />
Rotation x N interaction was significant at Kulumsa for GY (P
Effect ofcrop rotation and fertilizer application on wheat yield - Amanuel et al.<br />
treatments, respectively, at Kulumsa. At Asasa, the AE for N was relatively low across all<br />
treatments; however, BaWW exhibited the highest AE of20.3 kg grain per kg Nat Asasa.<br />
<strong>The</strong> AE of an incremental 20 kg P ha- I was significant at Kulumsa for only four rotation<br />
treatments: 32.5 for RpW, 27.5 for RpWW, 19.0 for FbW and 13.5 for BaW (Table 6). In<br />
contrast, AE was significant for seven treatments at Asasa: toe RpWW, FbW, BaW, FbWW,<br />
FbWW, BaWW and RpW treatments exhibited AEs of 30.5,29.0,23.0,21.0, 18.0, 16.5 and<br />
16.0 kg grain per kg applied P.<br />
. CONCLUSIONS<br />
<strong>The</strong> long-tenn data set generated by this experiment revealed that the first wheat following a<br />
faba bean precursor crop either in a 2- or 3-course rotation consistently resulted in superior<br />
grain yields in both environments. A rapeseed precursor also resulted in significant grain<br />
yield increments in a succeeding wheat crop. <strong>The</strong> low yields obtained from the continuous<br />
cereal rotations at both locations indicate the need to encourage the adoption of appropriate<br />
crop rotations by peasant fanners in Ethiopia. In particular, the proportion of legumes should<br />
be increased in the currently cereaL-dominated cropping systems. Crop rotation treatments<br />
exerted significant effects on wheat response to applied Nand P nutrients: rotation with faba<br />
bean minimized wheat response to fertilizer N; crop rotation, in general, enhanced wheat<br />
response to applied P. <strong>The</strong> use of the N2 fixing leguminous crop faba bean in rotation with<br />
wheat in the present experiment clearly demonstrated the importance of legume-cereal<br />
rotation systems in sustaining wheat production and reducing the consumption of costly<br />
imported inorganic N fertilizer.<br />
ACKNOWLEDG.MENTS<br />
<strong>The</strong> authors wish to thank Messrs. Mekonnen Kassaye and Workiye Tilahun for their<br />
technical assistance during trial execution. This research was supported financially by the<br />
Ethiopian Agricultural Research Organization (EARO) with the collaboration of the wheat<br />
agronomy component of the CIMMYT/CIDA <strong>Eastern</strong> Africa Cereals Program.<br />
REFERENCES<br />
Amanuel Gorfu and Tanner, D.G. 1991. <strong>The</strong> effect of crop rotation in two wheat production zones of<br />
southeastern Ethiopia. In: <strong>Wheat</strong>for the Non-traditional Warm Areas. Saunders, D.A. (Ed.), pp. 491<br />
496. CIMMYT, Mexico, D.F., Mexico.<br />
Amanuel Gorfu, Tanner, D.G., Asefa Taa and Duga Debele. 1994. Observations on wheat and barley based<br />
cropping sequence trials conducted for eight years in southeastern Ethiopia. In: Developing Sustainable<br />
<strong>Wheat</strong> Production Systems. Tanner, D.G. (Ed.), pp. 261-280. CIMMYT, Addis Ababa, Ethiopia.<br />
Amanuel Gorfu, Tanner, D.G., Kefyalew Girma and Asefa Taa. I 996a. <strong>The</strong> influence of crop rotation and<br />
fertilizer level on weed density in bread wheat in southeastern Ethiopia. In: <strong>The</strong> Ninth <strong>Regional</strong> <strong>Wheat</strong><br />
<strong>Workshop</strong> for <strong>Eastern</strong>, Central and Southern Africa. Tanner, D.G., Payne, T.S. and AbdaJla, O.S.<br />
(Eds.), pp. 71-76. CIMMYT, Addis Ababa, Ethiopia.<br />
Amanuel Gorfu, Tanner, D.G., Kefyalew Girma, Asefa Taa and Duga Debele. 1996b. Soil nitrate and<br />
compaction as affected by cropping sequence and fertilizer level in southeastern Ethiopia. In: <strong>The</strong> Ninth<br />
<strong>Regional</strong> <strong>Wheat</strong> <strong>Workshop</strong> for <strong>Eastern</strong>, Central and Southern Africa. Tanner, D.G., Payne, T.S. and<br />
Abdalla, O.S. (Eds.), pp. 175-176. CIMMYT, Addis Ababa, Ethiopia.<br />
Asefa Taa, Tanner, D.G. and Amanuel Gorfu. 1992. <strong>The</strong> effects of tillage practice on bread wheat in three<br />
different cropping sequences in Ethiopia. In: Seventh <strong>Regional</strong> <strong>Wheat</strong> <strong>Workshop</strong> for <strong>Eastern</strong>, Central<br />
and Southern Africa. Tanner, D.G. and Mwangi, W. (Eds.), pp. 376-386. CIMMYT, Nakuru, Kenya.<br />
270
Effect ofcrop rotation and fertilizer application on wheat yield - Amanuel et al.<br />
Asefa Taa, Tanner, D.G., Kefyalew Girma and Aroanuel Gorfu. 1997. Grain yield of wheat as affected by<br />
cropping sequence and fertilizer application in southeastern Ethiopia. African Crop Science 1. 5: 147<br />
159.<br />
Cady, F.B. 1991. Experimental design and data management of rotation experiments. Agronomy Journal 83 : 50<br />
56.<br />
Chilot Yirga, Hailu Beyene, Lemma Zewdie and Tanner, D.G. 1992. Farming systems of the Kulumsa area. In:<br />
Research with Fanners - Lessons from Ethiopia. Franzel, S. and van Houten, H. (Eds.), pp. 145-157.<br />
CAB International, Wallingford, U.K.<br />
Hailu Gebre, Amsal Tarekegne and Endale Asmare. 1989. Beneficial break crops for wheat production.<br />
Ethiopian Journal ofAgricultural Science 11: 15-24.<br />
Hargrove, W.L., Touchton, J.T. and Johnson, J.W. 1983. Previous crop influence on fertilizer nitrogen<br />
requirements for double-cropped wheat. Agronomy Journal 75 : 855-859.<br />
Heenan, D.P., Taylor, A.C. and Leys, A.R. 1990. <strong>The</strong> influenGe of tillage, stubble management and crop rotation<br />
on the persistence ofgreat brome (Bromus diandrus Roth). Australian Journal ofExperimental<br />
Agriculture 30: 227-230.<br />
Higgs, R.L., Peterson, A.E. and Paulson, W.H. 1990. Crop rotations: sustainable and profitable. Journal ofSoil<br />
and Water Conservation 45: 68-70.<br />
Kirkegaard, J.A., Gardiner, P.A., Angus, J.F. and Koetz, E. 1994. Effect of Brassica crops on the growth and<br />
yield of wheat. Aust. J. Agric. Res. 45: 529-545.<br />
Lal, R. 1989. Conservation tillage for sustainable agriculture: Tropics versus temperate environments. Advances<br />
in Agronomy 42: 85-197.<br />
Patterson, H.D. 1965. <strong>The</strong> factorial combina1:ion of treatments in rotation experiments. Agricultural Science 65:<br />
171-182.<br />
Preece, D.A. 1986. Some general principles of crop rotation experiments. Experimental Agriculture 22: 187<br />
198.<br />
T AC. 1988. Sustainable Agricultural Production: Implications for International Agricultural Research. FAO,<br />
TAC Secretariat, Rome. 45 pp.<br />
Tanner, D.G., Amanuel Gorfu and Asefa Taa. 1993. Fertiliser effects on sustainabiljty in the wheat-based smallholder<br />
farming systems of Ethiopia. Field Crops Re!iearch 33: 235-248.<br />
Tezera Wolabu, Kefyalew Girma, Ayele Badebo and Tanner, D.G. 1996. <strong>The</strong> effects of alternate crop<br />
management practices on take-all and eyespot diseases of bread wheat in southeastern Ethiopia In: <strong>The</strong><br />
Ninth <strong>Regional</strong> <strong>Wheat</strong> <strong>Workshop</strong> for <strong>Eastern</strong>, Central and Southern Africa. Tanner, D.G., Payne, T.S.<br />
and Abdalla, O.S. (Eds.), pp. 432-439. CIMMYT, Addis Ababa, Ethiopia.<br />
Zentner, R.P. and Campbell, C.A. 1988. First 18 years of a long-term crop rotation study in southwestern<br />
Saskatchewan - yields, grain protein and economic performance. Canadian Journal ofPlant Science<br />
68: 1-21.<br />
271
Effect ofcrop rotation and fertilizer application on wheat yield - Amanuel et at.<br />
Table 2. Effects of crop rotation and fertilizer rate on grain yield (kglha) and yield<br />
components of wheat across five years at Kulumsa.<br />
SOPM: ' PH : ' SPl~f ; "HI. . TKW GPS GY<br />
(noJ~ " (eoi) "(no.) ., '(%) (g) (no.)<br />
Year (Y) *** *'1'* *** ** *** *** ***<br />
Rotation (R) * *** *** NS *** *** ***<br />
YxR NS ** ** NS P
Effect ojcrop rotation andJertilizer application on wheat yield - Amanuel et al.<br />
Table 4. <strong>Wheat</strong> grain yield (kg/ha) and yield components as affected by crop rotation<br />
across five years at Kulumsa.<br />
'Cropping ' SDPM . ."PIF . SPM'~· , ..'. Hi 0.,,: " TKW"·<br />
" , GPS . ···.· ; G¥<br />
. ,<br />
; seq u :~l)ce .. ' (' . ~) j AQ:) ' ., .. ,~o/~) " . .-': ~ ;(i~ : .<br />
:"9~ . ~: ' c 1 ~.<br />
(~m)<br />
.. . . ': .n. ,\....· (rih ~) ; '<br />
FbW 285 AB 86A 381 A· 44.6 34.0 A 35 .1 A 4500 A<br />
FbWW 289 A 86A 379 A 45 .1 33.5 AB 35.6 A 4430 A<br />
FbWW 267BC 83 BC 347 BCD 43.6 32.3 BC 33.3 AB 3750 B<br />
RpW 284AB 83 BC 361 ABC 44.1 33.5 AB 3l.9 BC 3800 B<br />
RpWW 272 ABC 84B 366AB 43.3 33.3 AB 3l.5 BC 3770B<br />
RpWW 260 C 82 CD 337DE 43.5 32.4 BC 32.3 BC 3440 BC<br />
BaW 266BC 81 D 338 CDE 44.2 33.1 AB 30.2 C 3330C<br />
BaWW 261 C 82 CD 332DE 43.7 33 .0 AB 30.0C 3250 C<br />
BaWW 261 C 82 CD 323 E 44.2 32.5 BC 3l.2 BC 3230 C<br />
Cont. wheat 270 ABC 81 D 3]8 E 43.9 32.6 C 3l.9 BC 3130C<br />
Mean 272 83 348 44.0 32.9 32.3 3660<br />
C.V.(%) 17.4 3.4 13.2 8.6 6.8 17.3 10.9<br />
LSD(0.05) 21 1.86 24 NS 1.4 2.4 389<br />
See Table 2 for definitions and abbreviations.<br />
Values in a column followed by the same letter(s) or by no letters are not significantly<br />
different at the 5% level ofthe LSD test.<br />
...<br />
Table 5. <strong>Wheat</strong> grain yield (kglha) and yield components as affected by crop rotation<br />
across five years at Asasa.<br />
Cropping ··· ·· PH .. ' SPNf '-;<br />
..<br />
....... <br />
, ·.(go.) "(:4iJ . :~,:~ ~!~' ;',.,.'<br />
' .<br />
HI ;:' iF~ . ~ ··.:GY<br />
,", '<br />
·sequence (em) .0,,1), ':',;.', . . , ' ., '. .<br />
FbW 90A 449 A 37.5 AB 28.2 25.6 AB 3260 AB<br />
FbWW 90A 454 A 37.5 AB 28.2 27.2 A 3450 A<br />
FbWW 87 BC 412 ABC 37.1 AB 27.7 24.6 BC 2780 BCD<br />
RpW 88AB 421 AB 38.6 AB 30.1 23.8 BCD 3000 ABC<br />
RpWW 88 AB 399 BC 38.8 AB 29.5 24.7 BC 2870 BCD<br />
RpWW 87 BC 383 BCD 37.0 AB 28.5 23.4 CD 2480D<br />
BaW 86 BCD 372 CD 37.9 AB 30.0 24.1 BCD 2630 CD<br />
BaWW 85 CDE 370 CD 39.8 A 30.2 24.0 BCD 2620 CD<br />
BaWW 83 E 352 D 37 .8 AB 30.0 23.6 CD 2410 D<br />
Cont. wheat 84DE 379 BCD 36.8 B 28.0 22.7 D 2400D<br />
Mean 86.7 399 37.9 29.0 24.4 2790<br />
C.V.(%) 3.8 14.8 9.7 10.4 19.8 14.5<br />
LSD(0.05) 2.8 46 2.9 NS 1.9 491<br />
See Table 2 for definitions and abbreviations.<br />
Values in a column followed by the same letter(s) or by no letters are not significantly<br />
different at the 5% level of the LSD test.<br />
273
Effect ofcrop rotation andfertilizer application on wheat yield - Amanuel et at.<br />
Table 6. <strong>Wheat</strong> grain yield increment (kglha) and nutrient response (kg grain/kg<br />
nutrient) with increased rates of Nand P application across five years at Kulumsa and<br />
Asasa.<br />
,'.<br />
,<br />
Cropping<br />
Yieldincre,ment '<br />
.<br />
NittJjent r~spons~<br />
' ,<br />
s~quence N a ,. ',, ;p-~ , ' " "'. . N a pb<br />
. .....<br />
Kul ' :As 'Klil " ,<br />
' As .. Ko.1 : , As Kul As<br />
FbW 40 -60 380 580 NS NS 19.0 29.0<br />
FbWW 250 0 140 360 NS NS NS 18.0<br />
FbWW 310 260 160 420 10.3 8.7 NS 21.0<br />
RpW 730 240 650 320 24.3 8.0 32.5 16.0<br />
RpWW 850 420 550 280 28.3 14.0 27.5 NS<br />
RpWW 780 390 -30 610 26.0 13.0 NS 30.5<br />
BaW 850 140 270 460 28.3 NS 13.5 23.0<br />
BaWW 660 390 0 330 22.0 13.0 NS 16.5<br />
BaWW 550 610 110 250 18.3 20.3 NS NS<br />
Cant. wheat 620 450 150 230 20.7 15.0 NS NS<br />
LSD(0.05) 306 205 254 309 - - - <br />
a 60 vs. 30 kg N/haJannum. <br />
b 20 vs. 0 kg P/haJannum. <br />
274
EFFECTS OF TILLAGE AND CROPPING SEQUENCE PRACTICES <br />
ON WHEAT PRODUCTION OVER EIGHT YEARS ON A FARMER'S FIELD <br />
IN THE SOUTH-EASTERN HIGHLANDS OF ETHIOPIA<br />
Asefa Taa l , D.G. Tanner 2 , Kefyalew Girma l , Amanuel Gorfu l and Shambel MaruI<br />
IKulumsa Research Center (EAR.o), P.O. Box 489, Asella, Ethiopia<br />
2CIMMYT/CIDA <strong>Eastern</strong> Africa Cereals Program, P.O. Box 5689, Addis Ababa, Ethiopia<br />
ABSTRACT<br />
Bread wheat (Triticum aestivum) yields are often low on peasant farmers'<br />
fields in Ethiopia due to the use of sub-optimal crop management practices.<br />
An on-farm crop management trial was initiated in 1992 in Arsi Zone in the<br />
south-eastern highlands of Ethiopia. <strong>The</strong> long-tenn trial examined the effects<br />
of tillage practice and cropping sequence on various parameters of bread<br />
wheat and the break crops faba bean (Vida faba), rapeseed (Brassica<br />
carinata) and barley (Hordeum vulgare). A three year crop rotation, consisting<br />
of two consecutive crops of wheat following one crop of faba bean (FbWW),<br />
significantly increased the grain yield, grains spike-I and spikes m- 2 of wheat.<br />
Minimum tillage had no effect on wheat yield and yield components, but did<br />
reduce seedling density at emergence. <strong>The</strong> yield of bread wheat was more<br />
consistent over years than that of the other three crop species included in the<br />
trial. Conventional tillage increased wheat straw N% and straw N uptake<br />
relative to minimum tillage. <strong>The</strong> density of the weed species Bromus<br />
pectinatus and Galinsoga parviflora increased under minimum tillage;<br />
continuous wheat cropping and the wheat-barley rotation also increased the<br />
density of B. pectinatus. Neither tillage practice nor cropping sequence had an<br />
effect on take-all (Gaeumannornyces graminis fsp. trifid) and eyespot<br />
(Pseudocercosporella herpotrichoides) incidence. <strong>The</strong> effect of interaction<br />
between tillage and cropping sequence was non-s·ignificant for all measured<br />
parameters. However, year by tillage and year by cropping sequence effects<br />
were significant for several parameters. Economic analysis indicated that the<br />
optimal production system consisted of the FbWW crop rotation under<br />
minimum tillage; conventional tillage was dominated by the minimum tillage<br />
system. Rotation of wheat with faba bean should be recommended for peasant<br />
farmers in Ethiopia as a means of increasing the grain yield of wheat and<br />
reducing the population of problematic grass weeds. In order to minimize soil<br />
losses due to erosion, the adoption of minimum tillage practices for smallscale<br />
wheat production in Ethiopia could be encouraged, since there was no<br />
difference among the tillage treatments in terms of the grain yield of wheat.<br />
However, farmers adopting minimum tillage for wheat production must be<br />
encouraged to practice crop rotation with faba bean in order to minimize the<br />
risk of an increase in the density ofB. pectinatus. ,<br />
275
Effects oftillage and cropping sequence practices on wheat production - Asefa et at.<br />
INTRODUCTION<br />
In specific zones of the highlands of Ethiopia (i.e., >2000 m a.s.l.), bread wheat occupies up<br />
to 45% of the total cropped area, and the majority of the wheat crop is cultivated by smallholders<br />
using the traditional ox traction system (Chilot et al., 1992). Bread wheat yields<br />
remain low on peasant fanns: the national mean wheat yield was estimated at about 1.4 t ha- I<br />
during 1993-95 (CIMMYT, 1996). Such 'low yields are attributable to both agronomic and<br />
socio-economic constraints (Hailu et al., 1988).<br />
To alleviate the agronomic constraints confronting bread wheat production, it is important to<br />
examine integrated crop management practices. <strong>The</strong> combined effects of tillage practice and<br />
cropping sequence were previously evaluated at the Kulumsa Research Center in Ethiopia<br />
under both mechanized and ox-plow tillage systems (Asefa et al., 1992). <strong>The</strong> principal<br />
objectives of soil tillage are to provide suitable seedbed conditions and adequate weed control<br />
(Triplett and van Doren, 1977; Lal, 1989). However, excessive mechanical soil manipulation<br />
leads to deterioration of soil structure, acceleration of soil erosion and runoff, and,<br />
consequently, a reduction of crop yield (Aina, 1979; Phillips et al., 1980; Lal, 1989). Tillage<br />
systems can also affect various soil physical and chemical properties, including soil moisture,<br />
mechanical resistance, organic matter, nitrate and ammonium.<br />
In recent years, however, a growing awareness of sustainability issues related to soil<br />
productivity has increased interest in soil and water conservation via reduced tillage crop<br />
production systems (Phillips et al., 1980; Hargrove and Hardcastle, 1984; Lal, 1989).<br />
Reduced (minimum) tillage is a fonn of conserva~ion tillage in which disturbance of the soil<br />
is reduced by minimizing the degree of tillage, including only those operations that are<br />
essential; appropriate herbicides are substituted for tillage, in order to create suitable<br />
conditions for seed gennination, plant growth and weed control (Hamblin et al., 1982;<br />
Triplett and van Doren, 1977).<br />
Many studies have indicated that reduced tillage has an advantage in decreasing soil erosion<br />
and run-off and maintaining soil structure and long-tenn productivity (Hargrove and<br />
Hardcastle, 1984; Lal, 1989; Phillips et al., 1980). <strong>The</strong> effects of conservation and<br />
conventional tillage have been evaluated in tenns 'of minimizing production costs,<br />
safeguarding against soil loss, and boosting crop yields. Additional benefits of adopting<br />
conservation tillage are enhancement of water infiltration and increased soil organic matter<br />
(Triplett and van Doren, 1977; Aina, 1979; Lal, 1989; Asefa et al., 1992).<br />
<strong>The</strong> use of legumes in sequential cropping with wheat provides several benefits to sustainable<br />
and profitable crop production (Higgs et al., 1990). In Ethiopia, a number of rotation and<br />
cropping sequence trials have indicated the importance of including dicots, particularly<br />
legumes, in the cropping system to improve yields and sustain production (Amanuel and<br />
Tanner, 1991). <strong>The</strong> benefits of such crop rotations include: N-fixation by the legume<br />
(Hargrove et al., 1983); the interruption of weed (Heenan et al., 1990), disease and insect<br />
cycles by dicotyledonous crops; crop diversification (Zentner and Campbell, 1988);<br />
improvement in soil tilth and a reduction in rainfall runoff and erosion (Higgs et al., 1990).<br />
Moreover, no studies have examined the long-tenn integrated effects of tillage and cropping<br />
sequence pra.ctices on the Ethiopian cropping environment. This study presents results<br />
generated during the 1992-1999 cropping seasons on a peasant fanner's field in the southeastern<br />
highlands of Ethiopia.<br />
276
Effects oftillage and cropping sequence practices on wheat production - Asefa et al.<br />
MA TERIALS AND METHODS<br />
Site characteristics: <strong>The</strong> tri-al was initiated during 1992 at an on-farm site near Gonde in the<br />
vicinity of the Kulumsa research station (8°02'N, 39°10'E), located in the south-eastern<br />
highlands of Ethiopia at an altitude of 2200 m a.s.l. During the main crop growing season<br />
(i.e., June to November), long-tenn mean 'monthly minimum and maximum temperatures at<br />
Kulumsa were 10.6 and 22.1 °C; mean precipitation during the main growing season was 504<br />
mm. According to the agro-ecological zonation of Ethiopia, this site is located in the M2<br />
agro-ecological zone (tepid to cool, moist highland). <strong>The</strong> site is located on a high clay content<br />
soil.<br />
Trial design: <strong>The</strong> trial consisted of 8 treatments comprising the full factorial combination of:<br />
a) two levels of tillage (i.e., minimum tillage [MT] vs. conventional tillage) and four levels of<br />
cropping sequence (CS) (i.e., continuous bread wheat vs. a rotation of one year of faba bean,<br />
rapeseed, and barley followed by two years of wheat). <strong>The</strong> treatments were laid out in a splitplot<br />
arrangement in an RCBD with three replications. Tillage treatments were initiated in<br />
main plots of lOx 20 m, and CS in sub-plots of 5 x 10m in 1992. All treatment plots were<br />
maintained over the trial duration. J<br />
Crop management practices: Conventional tillage consisted of four ploughings prior to<br />
sowing (i.e., farmers' practice); for MT, one pass with the ox-plow was used to incorporate<br />
broadcast seed and fertilizer. <strong>For</strong> the MT treatment, chemical fallow was practiced during the<br />
"short rains" period each year: glyphosate was spray applied at 720 g a.i. ha- I during the<br />
fallow period with a maximum of two applications per season (i.e., as required to prevent<br />
weeds from attaining a height of 20 cm). ~<br />
Recommended cultural practices (i.e., for non-experimental crop management factors) were<br />
adopted for faba bean, rapeseed, barley, and bread wheat during the conduct of the trials.<br />
Over the period from 1992 to 1999, the trial was sown on dates ranging from June 29 to July<br />
12. Bread wheat cultivars "Enkoy" (1992-93), and "Mitike" (1994) were sown at a seed rate<br />
of 150 kg ha- I while "Kubsa" (1995-1999) was sown at a seed rate of 175 kg ha- I . During<br />
1992-94, bread wheat received a basal application of 41 kg N ha- I , but from 1995-99, bread<br />
wheat received a basal application of 82 kg N ha- I .<br />
During 1992, 1995, and 1998, break crops were sown as follows: faba bean cultivar<br />
"CS20DK" at a seed rate of 200 kg ha- I ; rapeseed cultivar "Yellow Dodola" at a seed rate of<br />
15 kg ha- J ; barley cultivar "Holker" (1992) at a seed rate of 80 kg ha- l and cultivar "ARDU<br />
12-60B" (1995, 1998) at a seed rate of 130 kg ha- l . Basal N was applied at 18 kg ha- l for faba<br />
bean, whereas, for rapeseed and barley, 41 kg N ha- J was applied. All crops received a basal<br />
application of 46 kg P20S ha- I each year. Due to the risk of damage by spray drift, hand<br />
weeding was used to control weeds during years in which all crops were sown (i.e., 1992,<br />
1995, and 1998). During years in which all plots were sown to wheat (i.e. , 1993, 1994, 1996,<br />
1997, and 1999), weed control entailed a post-emergence spray application of a tank mix of<br />
fenoxaprop-p-ethyl + fluroxpyr + MCPA at 0.069 + 0.175 + 1.0 kg a.i. ha- I , respectively.<br />
Agronomic data: Data on various crop parameters were collected throughout the cropping<br />
season. Data on seedling density, maturity dates, plant height, and spikes m- 2 were collected.<br />
A 9 m 2 net plot area was harvested by sickle to detennine seed yield, thousand seed weight<br />
277
Effects oftillage and cropping sequence practices on wheat production - Asefa et at.<br />
and % seed moisture. Sample culms were harvested at ground level from each wheat plot to<br />
calculate biomass yield and harvest index.<br />
Crop nutrient uptake: Grain and straw N contents were determined by micro-Kjeldahl<br />
analysis of grain and straw taken from oven-dried samples. Grain nitrogen uptake (GNU) and<br />
straw nitrogen uptake (SNU) values were calculated by multiplying grain and straw yields by<br />
the respective N contents. Total N uptake (TNU) was calculated as the sum of GNU and<br />
SNU.<br />
Weed assessment: Data on broadleafweed and grass weed seedling densities were collected<br />
each season from sub-plots using randomly placed quadrats prior to hand weeding; panicle<br />
and spike counts for individual grass weed species were also recorded at maturity of the<br />
wheat crop. Prior to analysis, weed density data were transformed using the square root of<br />
(actual counts + 0.5).<br />
Disease assessment: <strong>The</strong> incidence of take-all and eyespot was estimated during 1994, 1996,<br />
1997 and 1999 within each sub-plot. Each season, samples of main stems and tillers were<br />
collected for disease assessment immediately after crop harvest. Samples were collected by<br />
traversing a "W" pattern across each sub-plot. After washing and drying the stubble samples,<br />
a minimum of 80 crowns from each sub-plot were assessed for disease symptoms.<br />
Eyespot severity was assessed using the 0-3 rating scale of Scott and Hollins (1974) in which<br />
o = crowns with no infection, 1 = slight infection, 2 = moderate infection, and 3 = severe<br />
infection. If eyespot lesions were not clearly visible, the internodes were split and checked for<br />
internal growth of the typical grayish, cottony mycelium to confirm the presence of the<br />
disease. <strong>The</strong> number of crowns in each severity class was recorded, and a weighted percent<br />
severity score for eyespot was calculated for each sub-plot using the following formula: (100<br />
• L([number of crowns in each severity class] • [the severity class rating])) -:- ([total number<br />
of crowns scored] • 3).<br />
Take-all severity was assessed on the same sampled crowns using the 0-5 rating scale of<br />
Scott (1969) in which 0 = crowns with no infection, and 5 = severe infection. A weighted<br />
percent severity score for take-all was calculated for each sub-plot using the following<br />
formula: (100 • L([number of crowns in each severity class] • [the severity class rating])) -:<br />
([total number of crowns scored] • 5).<br />
Statistical analysis: Data from each experiment were combined over years. Analysis of<br />
variance was performed using the MST A TC statistical package and the grouping of means<br />
was determined using the LSD test at the 5% probability level.<br />
Economic analysis: Grain and seed yield data from the trial (i.e., 8 treatment combinations)<br />
were subjected to partial budget analysis (CIMMYT, 1988). Grain and seed yields were<br />
adjusted downwards by 10%. Field prices for the four crops during the period between Dec.<br />
1999 to Jan. 2000, adjusted for the cost of threshing, were 1.671, 1.591, 1.410 and 1.535<br />
EB/kg for faba bean, rapeseed, barley and wheat, respectively. Seed was valued at the 1999<br />
2000 farm-gate price of the output (i.e., farmers used "own" seed). <strong>The</strong> cost of weeding and<br />
harvesting the four crops was 272.00, 131.50, 218.00 and 259.50 EB/ha for faba bean,<br />
rapeseed, barley and wheat, respectively. Fertilizer costs were derived from the purchase<br />
price of fertilizer in the Gonde village during the 1999 planting season as follows: 137.03<br />
EBI100 kg of urea and 228.04 EB/IOO kg ofDAP. <strong>For</strong> the conventional tillage practice, the<br />
278
Effects oftillage and cropping sequence practices on wheat production - Asefa et al.<br />
cost of tillage plus seed covering was estimated as 300 EBlha (i.e., 5 passes by the ox-plow at<br />
60 EB/pass/ha); for MT, the cost of tillage and fallow season weed control was estimated as<br />
210 EBlha (i.e., 720 g glyphosatelha costing 140 EB/ha plus 10 EBlha for application and 60<br />
EBlha for one pass with the ox-plow for seed covering).<br />
Dominance analysis was used to select the superior treatments among the eight treatment<br />
combinations. <strong>The</strong> marginal rate of return (MRR) was calculated for each treatment (i.e.,<br />
relative to the next lowest cost, non-dominated treatment).<br />
RESULTS AND DISCUSSION<br />
Yield and yield components: <strong>The</strong> results of the combined ANOV A for grain yield and yield<br />
components are presented in Table 1. Year and year by tillage effects comprised a high<br />
proportion of the total variability, reflecting pronounced environmental effects on wheat grain<br />
yield and yield components.<br />
Tillage practice had no consistent effect on wheat grain yield and yield components (Tables 1<br />
and 2); however, minimum tillage did reduce seedling density at emergence (Table 2).<br />
Minimum tillage has been stated t6 be a viable option for wheat production elsewhere in East<br />
Africa (Modestus, 1994); however, there was no apparent biological yield advantage due to<br />
MT in the current study. MT has been proposed as an alternative to conventional tillage<br />
where soil is prone to erosion (Aulakh and Gill, 1988; Stobbe, 1990), and to reduce<br />
evaporative losses and maintain soil moisture in drier environments (Griffith et al., 1986).<br />
Other reports have indicated that MT can reduce \:"heat grain yields in specific environments<br />
(Kamwaga, 1990; Kirkegaard et al., 1994).<br />
<strong>The</strong> effect of interaction of tillage by year was significant for all parameters of grain yield<br />
and yield components, but was not significant for seedling density at emergence (Table 1).<br />
<strong>The</strong> interactions revealed differential effect of tillage practices over years for all yield<br />
components (Table 3). Grain yield was not affected by tillage in 3 out of 5 years, but was<br />
affected positively by MT in 1996 and adversely in 1999; HI was higher under MT in 3 out of<br />
5 years; TKW was higher under MT in 3 out of 5 years but was lower in 1999 (Table 3).<br />
<strong>Wheat</strong> grain yield was markedly lower during the 1994 cropping season, due to adverse<br />
weather conditions, particularly strong winds coupled with reduced rainfall prior to the<br />
physiological maturity of the wheat crop; on the other hand, the highest mean wheat grain<br />
was obtained in 1996 because the weather conditions were conducive for the growth and<br />
development ofthe wheat crop.<br />
Cropping sequence significantly affected grain yield, grains spike-I, spikes m- 2 and grains m- 2<br />
(Table 1). <strong>The</strong> three year crop rotation consisting of two consecutive crops of wheat<br />
following one crop of faba bean (Fb WW) significantly increased these parameters,<br />
particularly relative to continuous wheat and the wheat-barley rotation (Table 2). Thus, dicot<br />
crops especially legumes, are recommended fo'r inclusion in the cropping system. Several<br />
authors have emphasized the use of crop rotation to sustain wheat production (Higgs et al.,<br />
1990; Baldock et aI., 1981).<br />
<strong>The</strong> interaction effect of year by cropping sequence was highly significant for grain yield,<br />
grains m- 2 and TKW (Table 1). In general, the interaction effects revealed that in some years<br />
the differences amongst treatments were NS. In the case of wheat grain yield (Table 4),<br />
precursor crop effects were NS during 1994 and 1997 - the second year following precursor<br />
279
Effects oftillage and cropping sequence practices on wheat production - Asefa et al.<br />
crop production (i.e., precursors were grown during 1992 and 1995). By contrast, precursor<br />
crop effects were significant for each wheat crop immediately following the precursors (i.e.,<br />
1993, 1996 and 1999). During 1993, FbWW outyielded RpWW; by contrast, in 1996 and<br />
1999 these two treatments did not differ in yield. During 1999, continuous wheat was lower<br />
yielding than BaWW; however, in 1993 and 1996, these two treatments exhibited similar<br />
yield levels.<br />
<strong>The</strong> number of grains m·2 differed amongst the cropping sequences each year except during<br />
1997 (Table 4). <strong>Wheat</strong> in the faba bean rotation was superior to the other three cropping<br />
sequences in 1993 and 1994; however, in 1996 and 1999, wheat exhibited a similar number<br />
of grains m- 2 following either faba bean or rapeseed.<br />
<strong>The</strong> effects of CS on TKW were less consistent due to the typical plasticity of the response of<br />
TKW to the effects of treatments on other yield components. <strong>For</strong> example, Fb WW in 1994<br />
exhibited an increase in spikes per m- 2 and grains per spike relative to the other precursor<br />
crop treatments (Table 2); however, due to the terminal drought stress experienced in 1994,<br />
the TKW of the FbWW treatment was markedly reduced (Table 4).<br />
<strong>The</strong> three-way interaction effect (i.e., year by tillage by cropping sequence) was significant<br />
for grain yield, harvest index and grains m- 2 (Table 1). Upon scrutiny of the three-way<br />
interaction means for grain yield (data not show), it appeared that conventional tillage<br />
combined with the faba bean rotation markedly increased grain yield in some years.<br />
Nonetheless, the main effect of cropping sequence was clearly apparent among the treatment<br />
means.<br />
<strong>The</strong> data from the three years of precursor crop production revealed that the yield of<br />
continuous bread wheat was less variable over years than the yield of the other three crop<br />
species included in the trial (Table 5); C.V.s (i.e., calculated on plot yields without removing<br />
year and replication effects) ranged from 135% for wheat up to 345% for faba bean. Faba<br />
bean and rapeseed crops are known to be sensitive to environmental conditions (Tanner et al.,<br />
1999), and this was reflected in the C. V. levels. <strong>The</strong> lower levels of variability associated<br />
with cereal production may also partially explain the predominance of cereals in the peasant<br />
fanning systems of Ethiopia (i.e., yield stability enhances rood security).<br />
<strong>Wheat</strong> N uptake: <strong>The</strong> results of the combined analysis over two years for wheat N uptake<br />
(Table 6) revealed that conventional tillage markedly increased straw N% and straw N<br />
uptake. Christensen et al. (1994) found that wheat response to N fertilizer could vary with<br />
tillage system and soil moisture. Results reported by Rao and Dao (1992) suggested that<br />
cereals under MT may require additional fertilizer to attain similar production levels as under<br />
conventional tillage because of a lower extraction efficiency of available N. In general, the<br />
wheat crop N uptake was higher in 1996 and lower in 1997 (data not shown). Cropping<br />
sequence did not exhibit a significant effect on wheat N uptake.<br />
Weed population dynamics: <strong>The</strong> results of the combined analysis over four years for weed<br />
densities are presented in Table 7. Tillage exerted a pronounced effect on weed seedling<br />
densities. Polygonum nepalense was markedly increased under conventional tillage, whereas,<br />
Galinsoga parviflora was increased by minimum tillage. Elsewhere, weed populations have<br />
been observed to build up rapidly under zero or MT (Arshad et al., 1994; Blackshaw et al.,<br />
1994), necessitating the use of increasingly sophisticated post-emergence weed management<br />
280
Effects oftillage and cropping sequence practices on wheat production - Asefa et aI.<br />
practices; by contrast, some broadleaf weed species have been reported to germinate at a<br />
lower frequency under zero-tillage (Clements et at., 1996; Giref et at., 1992).<br />
<strong>The</strong> density of Guizotia scabra was markedly increased in the Rp W\V CS, while Polygonum<br />
nepatense density increased in both the RpWW and Fb WW sequences (Table 7). Guizotia<br />
scabra density apparently reduced over time, whereas Polygonum nepatense decreased<br />
during the middle of the trial period.<br />
Although data were collected for different grass weed species, only one species, Bromus<br />
pectinatus, OCCUlTed at a high density over the trial period. Conventional tillage significantly<br />
reduced Bromus density (Table 7). Repeated tillage brings weed seeds to the surface and<br />
exposes them desiccation, and also buries seeds deep in the soil creating unsuitable<br />
conditions for germination and growth, thereby reducing the density of some weeds<br />
(Akobundu, 1987).<br />
Bromus pectinatus density in wheat was significantly reduced by the use of dicot precursor<br />
crops, especially faba bean, cf. continuous wheat production. Higher infestations of the weed<br />
were observed in continuous wheat and the barley-based cropping sequence. Herbicidal weed<br />
control of other grass weeds by ferioxaprop-p-ethyl may have contributed to the opportunistic<br />
increase of this weed since the chemical does not control Bromus spp. Thus, rotation of wheat<br />
with faba bean is a promising means of reducing grass weed densities in wheat; the build-up<br />
of grass weed species in continuous wheat production systems has been reported elsewhere<br />
(Blackshaw et at., 1994; Heenan et at., 1990).<br />
Incidence of root diseases: <strong>The</strong> results of the combined analysis over four years for root<br />
diseases are presented in Table 8. Neithe{ tillage nor cropping sequence had an apparent<br />
effect on take-all and eyespot incidence. Year effects were more apparent, particularly in the<br />
case of eyespot: the level of eyespot reduced significantly in 1996 and increased during 1999.<br />
<strong>The</strong>re was no significant difference over years in terms oftake-all incidence.<br />
Scott (1969) reported that cultivation significantly reduced the number of white heads caused<br />
by take-all in a wheat crop, and concluded that this was probably due to enhanced microbial<br />
activity in the well-aerated mixture of soil and stubble. Moore and Cook (1984) found that<br />
the best control of take-all in consecutive crops of wheat was achieved by thorough tillage;<br />
the same authors suggested that early loosening of ploughed soil hastened the decline of the<br />
take-all fungus relative to the more compacted soil under zero tillage. Herrman and Wiese<br />
(1985) reported that eyespot incidence was highest in MT plots, and lowest in zero tillage<br />
plots.<br />
Cropping sequence and tillage practices may both influence the inoculum density of residueborne<br />
pathogens (Sutton and Vyn, 1990). Production of wheat in sequence with non-host<br />
crops may suppress wheat pathogens by allowing more time for the organisms to decline in<br />
residues, by modifying the residue microclimate, or through other effects (Sutton and Vyn,<br />
1990). De Boer et at. (1992) reported that rotation of wheat with leguminous crops reduced<br />
the levels oftake-all and eyespot relative to continuously cropped wheat.<br />
Economic analysis: <strong>The</strong> results of the partial budget analysis are presented in Table 9. <strong>The</strong><br />
highest net benefits were associated with the faba bean and rapeseed cropping sequences.<br />
Conventional tillage treatments were dominated (i.e., cost more and produced lower net<br />
benefits) by minimum tillage. <strong>The</strong> lowest cost treatment was RpWW under minimum tillage.<br />
281
Effects oftillage and cropping sequence practices on wheat production - Asefa et al.<br />
<strong>The</strong> optimal treatment was Fb WW under minimum tillage having an MRR of 2047% relative<br />
to Rp WW under minimum tillage. All other treatments were dominated by the optimal<br />
treatment. <strong>The</strong> indices of variability (i.e., a measure of the variability of NB) ranged between<br />
40.8 and 63.2% for the eight treatments; the optimal treatment exhibited an acceptable LV. of<br />
47.3%.<br />
CONCLUSIONS<br />
Crop management practices differed in their impact on the various parameters of the wheat<br />
production systems. Tillage had no consistent effect on wheat yield and yield components,<br />
but MT reduced seedling density at emergence. Conventional tillage increased wheat straw<br />
N% and N uptake as compared to minimum tillage. Bromus pectinatus and Galinsoga<br />
parviflora densities increased under minimum tillage; continuous wheat cropping and the<br />
wheat-barley based rotation also increased the density of B. pectinatus. Neither tillage nor<br />
cropping sequence affected the incidence of take-all and eyespot diseases of wheat. <strong>The</strong><br />
results of the economic analysis revealed that the optimal production system consisted of a<br />
Fb WW cropping sequence under minimum tillage. <strong>The</strong>refore, rotation of wheat with faba<br />
bean should be recommended for small-holders in Ethiopia as a means of increasing the grain<br />
yield of wheat, reducing the population of problematic grass weeds, and increasing the<br />
income of farmers. In order to reduce soil losses due to erosion, adoption of minimum tillage<br />
for small-scale wheat production in Ethiopia could be encouraged, since there was no<br />
difference among the tillage treatments in terms of the grain yield of wheat. However,<br />
farmers adopting minimum tillage for wheat production must be encouraged to practice crop<br />
rotation with faba bean in order to reduce the ~isk of an increase in the density of B.<br />
pectinatus.<br />
ACKNOWLEDGMENTS<br />
This experiment was financially supported by the Ethiopian Agricultural Research<br />
Organization (EARO) of Ethiopia in co-operation with the CIMMYT/CIDA <strong>Eastern</strong> Africa<br />
Cereals Program. <strong>The</strong> authors are grateful to Mekonnen Kassaye, Tamirat Belay and Workiye<br />
Tilahun for their assistance in conducting the experiment and data collection.<br />
REFERENCES<br />
Aina, O.P. 1979. Soil changes resulting from long-tenn management practices in Nigeria. Soil Sci. Soc. Am. J.<br />
43: 173-177.<br />
Akobundu, 1.0. 1987. Weed Science in the Tropics: Principles and Practices. London: John Wiley and Sons.<br />
pp.71-78.<br />
Amanuel Gorfu and Tanner, D.G. 1991. <strong>The</strong> effect of crop rotation in two wheat production zones of southeastern<br />
Ethiopia. In: <strong>Wheat</strong>for the Non-traditional Warm Areas. Saunders, D.A. (ed.), pp. 491-496,<br />
CIMMYT, Mexico.<br />
Arshad, M.A., Gill, K.S., and Coy, G.R. 1994. <strong>Wheat</strong> yield and weed populations as influenced by three tillage<br />
systems on clay soil in a temperate continental climate. Soil and Tillage Research 28: 227-238.<br />
Asefa Taa, Tanner, D.G. and Amanuel Gorfu. 1992. <strong>The</strong> effect of tillage practice on bread wheat in three<br />
different cropping sequences in Ethiopia. In: <strong>The</strong> Seventh <strong>Regional</strong> <strong>Wheat</strong> <strong>Workshop</strong> for <strong>Eastern</strong>,<br />
Central, and Southern Africa. Tanner, D.G. and Mwangi, W. (eds.), pp. 376-386. CIMMYT, Nakuru,<br />
Kenya.<br />
Aulakh, B.S. and Gill, K.L. 1988. Tillage effects on rainfed wheat production and soil bulk density. In: <strong>The</strong><br />
Fifth <strong>Regional</strong> <strong>Wheat</strong> <strong>Workshop</strong> for <strong>Eastern</strong>, Central and Southern African and Indian Ocean. van<br />
Ginkel, M. and Tanner, D.G. (eds.), pp. 224-229, CIMMYT, Mexico, D.F.<br />
282
Effects oftillage and cropping sequence practices on wheat production - Asefa et al.<br />
Baldock, 1.0., Higgs, R.L., Paulson, W.H., Jackobs, A.C. and Shrader, W.D. 1981. Legume effect and mineral<br />
N effect on crop yields in several cropping sequences in the upper Mississippi Valley. Agron. 1.<br />
73:511-518.<br />
Blackshaw, R.E., Lamey, F.O., LindwalI, C.W. and Kozub, G.c. J994. Crop rotation and tillage effects on weed<br />
populations on the semi-arid Canadian prairies. Weed Technology 8: 231-237.<br />
Chilot Virga, Hailu Beyene, Lemma Zewdie and Tanner, D.G. 1992. Farming systems of the Kulumsa area. In:<br />
Research With Farmers- Lessonsfrom Ethiopia. Franzel, S. and van Houten, H. (eds.), pp. 145-157.<br />
CAB International, Wallingford, U.K.<br />
Christensen, N.B., Lindemann, W.C., Salazar, E. and Gill, L.R. 1994. Nitrogen and carbon dynamics in no till<br />
and stubble mulch tillage systems. Agron. J. 86: 298-303<br />
CIMMYT. 1988. From Agronomic Data to Farmer Recommendations. An Economics Training Manual.<br />
Completely Revised Edition. CIMMYT, Mexico, D.F. 79 pp.<br />
CIMMYT. 1996. CIMMYT 1995/96 World <strong>Wheat</strong> Facts and Trends: Understanding Global Trends in the Use<br />
of<strong>Wheat</strong> Diversity and International Flows of<strong>Wheat</strong> Genetic Resources. Mexico, D.F.: CIMMYT. 73<br />
pp.<br />
Clements, D.R., Benoit, D.L., Murphy, S.D. and Swanton, C.J. 1996. Tillage effects on weed seed return and<br />
seed bank composition. Weed Science 44: 314-322.<br />
de Boer, R.F., Steed, G.R. and MacAuley, B.G. 1992. Effects of stubble and sowing treatments on take-all of<br />
wheat in north-eastern Victoria. Aust. J. Exper. Agric. 32: 641-644.<br />
GirefSahile, Tanner, D.G., and Lemma Zewdie. 1992. A study of weed emergence patterns in the bread wheat<br />
producing agro-ecological zones of south-eastern Ethiopia. In: Seventh <strong>Regional</strong> <strong>Wheat</strong> <strong>Workshop</strong> for<br />
<strong>Eastern</strong>, Central and Southern Africa. Tanner, D.G. and Mwangi, W. (eds.), pp. 503-509, CIMMYT,<br />
Nakuru, Kenya.<br />
Griffith, D.R., Mannering, J.V. and Box, J.E. 1986. Soil moisture management with reduced tillage. In: Notillage<br />
and Surface Tillage Agriculture. Sprague, M.A. and Tripplet, G.P. (eds.), pp. 19-55. John Wiley<br />
and Sons: New York. .<br />
Hailu Gebre, Amsal Tarekegne and Endale Asmare. 1988. Preliminary indication on the importance ofyield<br />
limiting factors on wheat. In: <strong>The</strong> Fifth <strong>Regional</strong> <strong>Wheat</strong> <strong>Workshop</strong> for <strong>Eastern</strong>, Central and Southern<br />
Africa and the Indian Ocean. van Ginkel, M., and T~nner, D.G. (eds.), pp. 189-194, CIMMYT,<br />
Mexico, D.F.<br />
Hamblin, A.P., Tennant, D. and Cochrane, H. 1982. Tillage and the growth of wheat crop in a sandy soil. Aust.<br />
J. Agric. Res. 33: 887-897.<br />
Hargrove, W.L. and Hardcastle, W.S. 1984. Conservation tillage practices for winter wheat production in the<br />
Appalachian Piedmont. 1. Soil and Water Cons. 39: 324-326.<br />
Hargrove, W.L., Touchton, J.T. and JOMson, J.W.1983. Previous crop influence on fertilizer nitrogen<br />
requirements for double cropping wheat. Agron. J. 75: 855-859.<br />
Heenan, D.P., Taylor, A.C. and Leys, A.R. 1990. <strong>The</strong> influence of tillage, stubble management and crop rotation<br />
on persistence of great brome (Bromus diandrus Roth). Aust. 1. Exp. Agric. 30: 227-230.<br />
Herrman, J. and Wiese, M.V. 1985. Influence of cultural practices on incidence of foot rot in winter wheat.<br />
Plant Disease 6: 948-950.<br />
Higgs, R., Arthur, L., Peterson, E. and Paulson, W.H. 1990. Crop rotations: sustainable and profitable. 1. Soil<br />
Water Cons. 45: 68-70.<br />
Kamwaga, J.N. 1990. Grain yield of wheat as influenced by different tillage systems in Kenya. In: <strong>The</strong> Sixth<br />
<strong>Regional</strong> <strong>Wheat</strong> <strong>Workshop</strong> for <strong>Eastern</strong>, Central and Southern Africa. Tanner, D.G., van Ginkel, M. and<br />
Mwangi, W. (eds.), pp. 133-139. Mexico, D.F.: CIMMYT.<br />
Kirkegaard, J.A., Angus, J.F., Gardner, P.A. and Muller, W. 1994. Reduced growth and yield ofwbeat with<br />
conservation cropping. I. Field studies in the first year of the cropping phase. Aust. J. Agric. Res. 45:<br />
511-528.<br />
Lal, R. 1989. Conservation tillage for sustainable agriculture: tropical versus temperate environments. Adv.<br />
Agron. 42: 85-197.<br />
Modestus, W.K. 1994. Minimum tiIJage as an alternative to conventional tillage for wheat production in<br />
northern Tanzania. Developing sustainable wheat production systems. In: <strong>The</strong> Eighth regional <strong>Wheat</strong><br />
<strong>Workshop</strong> for <strong>Eastern</strong>, Central and Southern Africa. Tanner, D.G. (ed.), pp. 221-228, CIMMYT, Addis<br />
Ababa, Ethiopia.<br />
Moore, KJ. and Cook, RJ. 1984. Increased take-all of wheat with direct drilling in the Pacific Northwest.<br />
Phytopathology 74: 1044-1049.<br />
Phillips, R.E., Blevins, R.L., Thomas, G.W., Freye, W.W. and Phillips, S.H. 1980. No-tiIJage agriculture.<br />
Science 208: 1108-1113.<br />
Rao, S.c. and Dao, T.H. 1992. Fertilizer placement and tillage effects on nitrogen assimilation by wheat. Agron.<br />
J.84: 1028-1032.<br />
283
Effects oftillage and cropping sequence practices on wheat production - Asefa et al.<br />
Scott, P.R. 1969. Control of Ophiobolus gram in is between consecutive crops of winter wheat. Annals ofApplied<br />
Biology 63: 47-53.<br />
Scott, P.R. and Hollins, T.W. 1974. Effect of eyespot on the yield of winter wheat. Annals ofApplied Biology<br />
78:269-279.<br />
Stobbe, E.H. 1990. Conservation tillage. In: <strong>The</strong> Sixth <strong>Regional</strong> <strong>Wheat</strong> <strong>Workshop</strong> for <strong>Eastern</strong>, Central and<br />
Southern African. Tanner, D.G., Van Ginkel, M. and Mwangi, W. (eds.), pp. 20-32, Mexico D.F.:<br />
CIMMYT.<br />
Sutton, J.e. and Vyn, T.J. 1990. Crop sequences and tiIIage practices in relation to diseases of winter wheat in<br />
Ontario. Canadian J. Plant Pathology 12: 358-368.<br />
Tanner, D.G., Verkuijl, H., Asefa Taa and Regassa Ensermu. 1999. An agronomic and economic analysis of a<br />
long-term wheat based crop rotation trial in Ethiopia. In: Tenth <strong>Regional</strong> <strong>Wheat</strong> <strong>Workshop</strong> for <strong>Eastern</strong>,<br />
Central and Southern Africa. pp. 213-248, CIMMYT, Addis Ababa, Ethiopia.<br />
Triplett Jr., G.B. and van Doren Jr., D.A. 1977. Agriculture without tillage. Scientific American 236: 28-33.<br />
Zentner, R.P. and Campbell, e.A. 1988. First 18 years of a long-term crop rotation study in south-western<br />
Saskatchewan: yield, grain protein and economic performance. Can. J. Plant Sci. 68: 1-12.<br />
Questions and Answers:<br />
John Tolmay: Were any soil moisture measurements taken on different tillage treatments? If<br />
any, were any differences found in soil moisture?<br />
Answer: <strong>The</strong>re were no significant differences between tillage treatments for the data<br />
recorded in 1994, 1996 and 1997.<br />
Bedada Girma: Your results showed that tillage or cropping sequence had no effect on takeall<br />
and eyespot diseases. If so, what possible recommendations would you suggest for the<br />
control of wheat root diseases?<br />
Answer: Seed treatment with chemicals and the use of a resistant variety for both diseases.<br />
H. Mansoor: <strong>The</strong> CVs on your ANOVA were quite high (135-300%). Do you have any<br />
explanation on the CVs? Would you be confident to recommend anything with these high<br />
CVs?<br />
Answer: <strong>The</strong> year and rep. effects were not pulled out. That is why the CV was very high.<br />
284
Effects oftillage and cropping sequence practices on wheat production - Asefa et al.<br />
Table 1. Crop management effects on wheat yield and yield components in the Gonde on-farm trial: ANOV A results<br />
across five years (1993-94, 1996-97, 1999).<br />
..'.. .':··c:!:;g' ";~~ r' .· ·t~ ' . "GR:M'·...";·,· · ·~KW <<br />
"<br />
, .' ""'-' ~ .. '7.,. . ~ ,.:' , . ' i!l ~ . ~: .I~-"<br />
~: '. GOC~ },,' .~~sIf . :~if, . :;:; , 1,11,"'.,· '.; ;.;; 'SP!trNr, : ~.:~~. '-! . .~ ;; '.~<br />
" :11, " "<br />
.<br />
:' ~i;•. . . . .. ~ y : .. ' ~ ': ' ' - ..... .,..t.,: i ;'"n:~<br />
Effects oftillage and cropping sequence practices on wheat production - Asefa et at.<br />
Table 2. Crop management effects on wheat yield and yield components in the Gonde on-farm trial: treatment means<br />
across five years (1993-94, 1996-97, 1999).<br />
, ', , '. . . r".:,, ·<br />
, ., ,<br />
, '<br />
Tillage<br />
ṗ<br />
. ", ~;;: ~~:GY-'~ ~ . :~... ,",," , ,}Sl) ~( ~' '<br />
,'" '
Effects ojtillage and cropping sequence practices on wheat production - AseJa et at.<br />
Table 3. Effects of interaction of tillage by year on grain yield and yield components of wheat in the Gonde on-farm trial.<br />
~~ . " ~.<br />
--: Graincyield ~ : . ~a:vvest index<br />
L. ;1 1: '<br />
~~'; . " • ",' ':2' '''·:,-::1,;: .' ; , ,; ;'r:'~;l'; I" .1' ·;i7,)T.~~W ., ,,(<br />
• ,\ :~: ;.~ ,:~~ , . ~~.,: ...: •. ~: : .f.; "?-f{,T" ,I I ,(kg/ha) ,.r',_ " >:, ,,f,, Min<br />
';-- .,. ~~ } ,'. (Yo) ,;;,- . , i" Spikes/m. -, .;~ . ,.Gr~m~fsplke . J. " .:;;,. -"j2) , ;.. : ",~ .<br />
, ;." Grain's/JIl 2 I<br />
Year Con Min I Con I Min Con Min Con I Min Con Min Con 1993 2443 I 2690 I 34.7 I 33.2 9279 I 9712 431 I 445 22.0 22.0 26.3B 27.6A<br />
1994 1591 I 1762 I 27.9B I 29.9A 5544 I 6103 354 I 314 16.0 19.5 28.7 29.2<br />
1996 4343B I 4906A I 37.8B I 43.7A 14375 I 14922 430 I 401 34.0 37.6 29.9B 32.8A<br />
1997 3629 I 3830 I 43 .8B I 48.2A 12325A I 10891B 288 I 302 43.1A 36.3B 30.4B 36.3A<br />
1999 3652A I 2942B I 44.2 I 44.9 9875A I 8177B 375A I 278B 26.6 31.0 36.9A 35.5B<br />
LSD(5%) 393 1.76 1193 53 4.4 1.23<br />
Values followed by the same or no letters within a year for each parameter are not significantly different at the 5% level of the LSD test.<br />
Con = Conventional tillage; Min = Minimum tillage; TKW = Thousand kernel weight.<br />
Table 4. Effects of interaction of cropping sequence by year on grain yield and yield components of wheat in the Gonde on-farm<br />
trial.<br />
~~ ',~ ,·,vf.~·
Effects oftillage and cropping sequence practices on wheat production - Asefa et al.<br />
Table 5.<br />
Precursor crop yields (kg/ha) by tillage treatment in the Gonde on-farm<br />
trial (mean of 1992, 1995, 1998).<br />
Precursor crop Conventional Minimum<br />
Faba bean 2573 2470 345<br />
Rapeseed 2267 1945 323<br />
Barley 2310 2030 193<br />
<strong>Wheat</strong> 2162 1775 135<br />
Table 6.<br />
Crop management effects on wheat N uptake in the Gonde on-farm trial:<br />
treatment means (1996, 1997).<br />
-"""SNc% ,.: co;. .,-' G.NU ' '''j - " ,<br />
,<br />
'<br />
:',' ' .. r ~ ,<br />
,<br />
, ":<br />
. • r ' GN~' 0 " 1 ·° . 0, __ - . '.<br />
" . .'. ft ' ,SNU '" .,TNV'"<br />
,<br />
Tillage<br />
Conventional 1.81 0.51A 63.4 28.0A 91.7<br />
Minimum 1.75 0.43B 67.6 21.2B 88.8<br />
Cropping sequence<br />
Faba bean-W-W 1.86 0.47 74.3 24.7 98.9<br />
Rapeseed-W-W 1.80 0.46 68.1 26.4 94.9<br />
Barley-W-W 1.74 0.49 61.0 25.5 86.5<br />
Continuous wheat 1.72 0.46 58.7 21.8 80.5<br />
Values for an individual factor level within a column followed by the same or no letters are<br />
not significantly different at the 5% level of the LSD test.<br />
SN% = Straw N (%); GN% = Grain N (%); GNU = Grain N uptake (kg/ha); SNU = Straw N<br />
uptake (kg/ha); TNU = Total N uptake (kg/ha).<br />
288
Effects oftillage and cropping sequence practices on wheat production - Asefa et al.<br />
Table 7.<br />
Crop management effects on weed population dynamics in the Gonde<br />
on-farm trial: treatment means 3 (1993, ]994, 1996, 1999).<br />
... ~,<br />
. J_' '\ _.. : {' ~, .- tir~'<br />
:~ ~'·Btiq;l!l~.,J ··f .-:.," ~ "I ~' (;1!atotjg .: ;.;,<br />
\':,.:.-:<br />
-...... - ~. I~:, W.A .. ool; .... , ' •••• i7 )~~1 _..f- ""1 ~;j,."ef?JifoiiUm Galiiisoga<br />
'M',.:..:<br />
'--:-.<br />
"' .<br />
~ ! '.<br />
~ ... I},l\ r. pe.cti"~tU S'<br />
'
Effects oftillage and cropping sequence practices on wheat production - Asefa et al.<br />
Table 8.<br />
Crop management effects on the incidence take-all and eyespot diseases<br />
on wheat in the Gonde on-farm trial: treatment means a (1994, 1996, 1997,<br />
1999).<br />
. • '.~!:,<br />
..<br />
"';\;;;i:
SURVEY OF WEED COMMUNITY STRUCTURE IN BREAD WHEAT <br />
IN TUREE DISTRICTS OF ARSI ZONE IN SOUTH-EASTERN ETHIOPIA <br />
Kefyalew Ginna, Shambel Maru, Amanuel Gorfu, Workiye Tilahun<br />
and Mekonnen Kassaye<br />
Kulumsa Research Center (EARO), P.O. Box 489, Asella, Ethiopia<br />
ABSTRACT<br />
Survey and monitoring of weed community structure was conducted in 1999<br />
in three major wheat growing districts of Arsi Zone. <strong>The</strong> survey was<br />
conducted twice during the cropping season. Weed species were counted and<br />
fanners were interviewed regarding different aspects of weeds and weed<br />
management practices. Overall, 45 weed species were identified in the<br />
surveyed area. <strong>The</strong> frequency of occurrence of individual weed species in the<br />
surveyed area ranged from 1.9 to 98.1 %. <strong>The</strong> most frequently occurring<br />
broadleaf weed species included Polygonum nepalense, Guizotia scabra,<br />
Galium spurium, Anagallis arvensis, Galinsoga parvijlora and Chenopodium<br />
spp. Grass weed species occurring with high frequency included Bromus<br />
pectinatus, Phalaris minor and Lolium temulentum. <strong>The</strong> broadleaf weed<br />
species with highest mean field densities w~re Polygonum nepalense, Galium<br />
spurium, Guizotia scabra, Galinsoga parvijlora, Cotula abyssinica and<br />
Anagallis arvensis. <strong>The</strong> grass weeds Phalaris minor, Bromus pectinatus,<br />
Lolium temulentum and Setaria pumila exhibited the highest mean field<br />
densities. Fanners ranked Galium spurium, Guizotia scabra, Rumex bequartii<br />
and Polygonum nepalense as the most frequent problematic broadleaf species,<br />
while Snowdenia polystachya, lJromus pectinatus, Avena Jatua and Lolium<br />
temulentum were identified as 'the most troublesome' grass weeds. Of the<br />
fanners interviewed, 57.7% selected Bromus pectinatus, Argemone mexicana<br />
and Polygonum convolvulus as new problem weeds: Generally, the weed count<br />
data and fanners' identification ofproblem weed species were in agreement.<br />
INTRODUCTION<br />
Successful weed management requires understanding arable land weed communities<br />
(Swanton et al., 1993). Knowledge of weed community structure is an important component<br />
of modem weed management research (Zonderwijk, 1982). <strong>The</strong> presence of each weed<br />
population in a field represents the results of ecological reactions to management practices of<br />
the current and previous years, edaphic factors of the site and the regional climate as weed<br />
distribution is regional in nature (Frick and Thomas, 1992). Weed populations in a given year<br />
also reflect local weather conditions and the resulting effects on recruitment, survival and<br />
competitive ability (Hidalgo et al., 1990). In addition, weed management practices including<br />
chemical, cultural and mechanical methods used may also exert a selective influence on the<br />
weed populations (Zanin et al., 1992; Sagvedra et al., 1990) providing the impetus for survey<br />
of weed population. Community studies, therefore, may help to detect the significant<br />
interaction among weed . communities, environment and management practices (Naavas,<br />
291
Survey ofweed community structure - Kefyalew et al.<br />
1991). Moreover, this kind of ecological study helps to understand the impact of changing<br />
managem~nt (Zanin et al., 1992; Thomas, 1985). .<br />
Weeds occurring in wheat growing areas of Arsi represent a major production loss. But since<br />
all weed species do not equally contribute to this loss, it is important to know the relative<br />
importance of weed species. In the past the weed composition of Arsi was assessed (ARDU,<br />
1982). Recently survey results were docutnented from wheat growing areas of West Shewa<br />
and Bale (Taye and Yohannes, 1999; Kedir et aI. , 1999). In Arsi, Giref and Workiye (1997)<br />
reported survey results of large-scale state owned farms around Asasa plain. <strong>The</strong> survey did<br />
not consider the small-scale farmers' fields and also were confined to specific areas of the<br />
wheat belt of Arsi. Moreover, the survey data was not collected in such a way that it could be<br />
quantitatively interpreted to aid weed management decisions. No survey work was done to<br />
characterize the weed community of the current survey area and baseline information is<br />
lacking to at least reproduce from survey results indicated above. Additionally, cereal based<br />
cropping is bringing to light new problems. Part of this involves the weed flora and<br />
management decisions required by growers to avert this problem.<br />
<strong>The</strong> objective of the survey was therefore to document quantitative and qualitative aspects of<br />
the weed community occurring in wheat in wheat growing areas of Digelu-Tijo, Munesa and<br />
Tiyo districts, so as to help devise crops and implement proper weed management strategies.<br />
MATERIALS AND METHODS<br />
Description of tJte Area<br />
<strong>The</strong> survey was conducted in wheat growing areas of Digelua-Tijo district and parts of<br />
Munesa and Tiyo districts. <strong>The</strong> altitude of the surveyed area ranged from 2240 to 2740 m<br />
a.s.l. Soil types of the surveyed area varied from heavy black soil to red soils with textural<br />
groups ranging from clay to sandy loam. In this survey the areas covered lay in two sub<br />
AEZs namely M2-7 and H2-7 (tepid to cool moist humid highlands). <strong>The</strong> survey area was<br />
classified into three soil and altitude ranges to determIne uniformity indices of weed species.<br />
Sampling Procedure<br />
A total of 62 farmers' fields were surveyed. <strong>The</strong> number of fields to be sampled were<br />
determined using the method outlined in Taye and Yohannes (1998). Every'S km, 3-4 fields<br />
were surveyed following different routes. A field was sampled for counting weeds using an<br />
inverted W pattern described by Thomas (1985) with 4 quadrats, each 0.25 m 2 . <strong>The</strong> number<br />
of plants was counted in each quadrat. In all cases, individual plants were counted ignoring<br />
tillers or other vegetative shoots in the case of annuals or perennials, respectively. In some<br />
instances it was difficult to identify species by name and grouping was made by genera. <strong>The</strong><br />
survey was conducted twice (before weeding and at anthesis of wheat) during the main rainy<br />
season in the same fields. <strong>The</strong> time frame was chosen so that the weed counts reflected the<br />
impact of the agronomic management decision made by farmers to produce wheat. Farmers<br />
were interviewed on different aspects of their cropping systems and weed management<br />
practices and problems related to weeds.<br />
292
Survey a/weed community structure - Kefyalew et al. <br />
Data Analyses and Summary <br />
<strong>The</strong> data from different fields were combined and summarized using frequency, density (both<br />
mean field density and mean occurrence field density), dominance and similarity index<br />
(Thomas, 1985).<br />
Frequency (F): is defined as the number of fields in which a weed occurred, expressed as a<br />
percentage of the total number of surveyed fields, and is an estimate of geographic extent of<br />
the weed in the study area.<br />
Fk<br />
= 100*(Iy/n)<br />
where, Fk is frequency of species k, Yi is presence 1 or absence 0 of species k in field i, and n<br />
is number of fields surveyed.<br />
Density: is defined as the mean number of plants per square meter. Two measures of<br />
densities were considered. Mean field density (MFD) is obtained by summing all the<br />
densities of a weed and dividing by the number of fields in which the weed occurred. Mean<br />
occurrence field density (MOFDj is obtained by summing all the densities of a weed and<br />
dividing by the number of fields in which a weed species occurred.<br />
= (IDi/n) <br />
= (IDi/(n-a)) <br />
where, Di is density (expressed as no. m- 2 ) value of species j in field I, n is the same as above,<br />
and a is the number of fields where species fls absent.<br />
To detect the existence of possible groups in the weed flora, a scatter plot of frequency versus<br />
mean field density was prepared.<br />
Dominance (D): This is a measure of mean field density of species k (MFDk) expressed as<br />
percentage of the total mean field density of all weed spec~es (MFDD.<br />
Similarity index (SJ): <strong>The</strong> survey area was divided into three groups based on soil type and<br />
altitude range. <strong>The</strong> first group included light soil area with altitude ranging from 2240 to<br />
2470 m. <strong>The</strong> second group was a black soil area, with altitude ranging from 2260 to 2520.<br />
<strong>The</strong> third group was red soil area with altitude ranging from 2510 to 2710 m. Similarity<br />
indices (SI) of weed species occurring in the three groups were calculated using the following<br />
formula. <strong>The</strong> formula compares two groups at a time and determines the degree of similarity<br />
of weed species in the specified groups in the current context.<br />
Where,<br />
gij is no. of species found in groups i and j<br />
gi is no. of species found only in group i and not in j<br />
gj is no. species found only in group j and not in i<br />
293
Survey ofweed community structure - Kefyalew et al.<br />
RESULTS AND DISCUSSION<br />
Quantitative Analysis of Weed Flora of the Surveyed Area<br />
Overall 45 weed species were identified in the surveyed area which belonged to a total of 23<br />
families of plants. Only seven families contained two or more weed species in number. Of<br />
these, Poaceae contributed 10 species, Compositae contributed seven species, Polygonaceae<br />
four and two species for each of Boraginaceae, Caryophylaceae, Labiatae and Leguminosae<br />
families. <strong>The</strong> prevalent weed species enlisted here were annuals reproducing by seed with<br />
high plasticity and seed setting capacity. Most of weed species important in wheat belonged<br />
to these families although there were single species families that can not be ignored (e.g.,<br />
Galium spurium in family Rubiaceae).<br />
<strong>The</strong> frequency of weed species in the surveyed area ranged from 1.9 to 98.1 %. 31 weed<br />
species infested 5% or more of the fields (Table 1) representing 16 families. <strong>The</strong> most often<br />
occurring broadleaf weed species (F>38%) included Polygonum nepalense, Guizotia scabra,<br />
Galium spurium, Anagallis arvensis, Gatinsoga parvijlora, Chenopodium spp., Cotula<br />
abyssinica, and Rumex bequartii. Similarly, grass weed species with high level of frequency<br />
(F>73%) were Bromus pectinatus, Phalaris minor and Lolium temulentum.<br />
Mean field densities ranged from 0.04 to 203.5 plants m- 2 (Table1). Broadleaf weed species<br />
with high (>6 plants m- 2 ) mean field densities were Polygonum nepalense, Galium spurium,<br />
Guizotia scabra, Galinsoga parvijlora, Cotula abyssinica, Anagallis arvensis and Oxalis<br />
corniculata in that order. Of the grasses, Pha~aris minor, Bromus pectinatus, Lotium<br />
temulentum and Setaria pumila exhibited higher (5 plants m- 2 ) mean field density.<br />
<strong>The</strong> mean occurrence field density ranged from 2 to 207 plants m- 2 • Identifying weed<br />
community structure using this method offers wheat growers to know the situation of a weed<br />
species in the fields where the weed occurs. Although it is a liberal measure, it is helpful in<br />
designing control measures at farm level.<br />
To detect the existence ofpossible groups in the weed flora, a scatter plot of frequency versus<br />
mean field density was prepared (Figure 1). Accordingly, the first group, with the highest<br />
frequency (98.1 %) and MFD (203.5 plants m- 2 ) contained only Polygonum nepalense. <strong>The</strong><br />
second group with still relatively high frequency (2:75%) and intermediate MFD (55.2 to 96.9<br />
plants m- 2 ) included only two weed species belonging to Poaceae: Phalaris minor and<br />
Bromus pectinatus. <strong>The</strong> third group contained two species (Guizotia scabra and Gatium<br />
spurium) with high frequency (>92%) and MFD between 19.9 and 45.4 plants m- 2 . <strong>The</strong> fourth<br />
group contained two species with frequency between 61.3 and 73.1% and MFD between 6.1<br />
and 8.2 plants m- 2 . <strong>The</strong> species included here were Anagallis arvensis and Lolium temulentum<br />
belonging to families Caryophyllaciae and Poaceae, respectively. <strong>The</strong> fifth group included six<br />
weed species with frequency ranging from 36.5 to 44.2% and MFD between 2.6 and 9.4<br />
plants m- 2 . <strong>The</strong> species clumped together here were Misopates orantium, Oxalis corniculata,<br />
Galinsoga parvijlora, Rumex bequartii, Cotula abyssinica, Cearastium octandrum belonging<br />
to five families. <strong>The</strong> sixth group included 18 weed species with frequency between 5.8 and<br />
28.9% and MFD 0.38 to 7.4 plants m- 2 . <strong>The</strong> 14 weed species recorded in the survey but not<br />
included in Figure 1 were considered infrequent, occurring in
Survey ofweed community structure - Kefyalew et al.<br />
densities do not take into consideration the size of the weeds (McCully et al., 1991).<br />
Polygonum nepalense is a relatively short, small plant which grows below wheat canopy<br />
except wlien well established ahead of the wheat crop. As recorded in the survey, this weed<br />
had the highest frequency and MFD but poses no significant threat compared to weed species<br />
like Galium spurium, Guizotia seabra, Bromus peetinatus and Avena fatua which are very<br />
problematic in wheat.<br />
Dominance analysis. <strong>The</strong> dominance analysis of weed species indicates which weed species<br />
dominate across the surveyed area. Dominance for the surveyed area ranged from 39.4% (for<br />
Polygonum nepalense) to 0.007% (for Myosotis orantium and Spilanthes mauritiana). Only<br />
five species exhibited dominance levCls greater than 3, while 7 species had dominance levels<br />
between 1.1 and 1.7%. <strong>The</strong> other species had dominance levels < 1 %.<br />
Generally, from the frequency, density and dominance analysis, the flora was dominated by a <br />
few species from which one can infer that a few weed species are important to wheat growers <br />
in the surveyed area. This gives fanners the opportunity to design strategic weed <br />
. management. <strong>The</strong>refore, given the appropriate attention and proper planning, farmers can <br />
easily manage problem weed species in the surveyed area.<br />
Similarity Index. <strong>The</strong> three groups fonned from different soil types and altitude ranges<br />
showed different similarity index ranges (Figure 2). <strong>The</strong> light versus black soil weed flora<br />
exhibited 77.1 % similarity. However, the comparison of weed species composition between<br />
light versus red and black versus red soils (46.5 and 51.2%, respectively) fell below the<br />
threshold similarity index (60%) to claim that two groups are similar. From management<br />
perspective, weed management decision can be made for the light soils and black soil areas of<br />
the surveyed districts. However, the red soil weed flora since the Similarity index value is<br />
lower (compared with both light and black soils), it is important to must be dealt with<br />
separately.<br />
Qualitative Assessment of the Weed Flora <br />
and Farmers' Perception of Weed Problem and Management Strategies <br />
Cropping Practice. Fanners in the surveyed area praCtice cereal rotation or continuous<br />
cropping of wheat (51 %), cereal based fallowing (30%) and rotation with dicot crops (19%).<br />
Further analysis of fanners' cropping practices and weed counts of surveyed area indicated<br />
that there was an apparent density difference in the different cropping patterns (Figure 3).<br />
Accordingly, total grass and broadleaf weed counts per field showed a consistent trend in<br />
which density was higher when fanners practice cereal or continuous cropping and lower<br />
when rotation was exercised.<br />
Weed control practices. Fanners' weeding practices involve hand weeding (25%),<br />
herbicidal weed control (46.2%) or both (28.8%). More than 90% of fanners exercising hand<br />
weeding perfonn one time weeding which is usually light. Labor demand for hand weeding is<br />
directly related to the weed infestation level which is in tum influenced by the variety, seed<br />
source, cropping systems and weather conditions. <strong>The</strong> daily wage rate is estimated to be 5 EB<br />
per day. To hand weed a hectare offield, on average, 40 workdays suffice.<br />
Most fanners in the surveyed area apply 2,4-0 except 2% of them who are using grass killer<br />
herbicides. Due to this, fanners exercise supplementary hand weeding to remove grass weeds<br />
and prevent crop damage. Although fanners apply a great deal of 2,4-0 on their wheat field,<br />
295
Survey ofweed community structure - Kefyalew et al.<br />
the rate they use tremendously varies from the recommended rate. Most farmers (7l.4%)<br />
apply less than the recommended rate of herbicide. Indeed, 48.6% of the fanners in the<br />
surveyed area apply half or less than half the recommended rate. This has an impact on the<br />
whole weed management strategy in that, first, by reducing the herbicide rate, desirable<br />
efficacy will not be attained. Second, from the economics perspective, it is a waste of money.<br />
Thirdly, there can be a danger of introducing herbicide resistant biotypes by reducing the rate<br />
although this is not a common phenomeRon with auxinic type of herbicides. <strong>The</strong> reasons<br />
farmers use below recommended rate are several. To mention a few, the price of herbicide<br />
plays greater role. <strong>The</strong> average price of 2,4-D is 50 EB per liter. This amount is higher than<br />
the cash investment capacity of farmers. Another factor is cost associated with spraying and<br />
spray equipment. Usually farmers reduce the number of tanks so as to minimize the amount<br />
of money they pay. In such cases, the applicators rush through the field without uniform<br />
coverage of the field. Additionally, when farmers buy herbicide from local merchants, quite<br />
frequently they are deceived since the merchants add odd materials into the actual content of<br />
the herbicide which actually reduce the rate without the knowledge of the farmer. Besides,<br />
farmers have no idea of calibration and they apply spray mix in unorganized way in the field.<br />
Associated with herbicides is the use of protective measures. Seventy six percent of farmers<br />
applying herbicide used no protectives and those who used protectives were using a piece of<br />
cloth to cover their nose and mouth. More than 90% of the farmers are aware of the danger<br />
associated with herbicides on human health.<br />
Alternative weed management. Farmers either use hand weeding or herbicides so as to<br />
eliminate weeds from their field. Of the farmers interviewed on alternative measures to<br />
control weeds, 55% thought of no alternative weed 'control strategies other than hand weeding<br />
and herbicides. Even this group of fanners-'are not in a position to think of operations like<br />
tillage as practices for managing weeds. Those farmers who exercise alternative weed<br />
management methods suggested tillage, fallowing, rotation and higher seed rate as options to<br />
reduce weed population. Some farmers are adding diesel oil in the 2,4-D spray mix with the<br />
assumption that it will kill Galium spurium, a weed species weakly controlled on farmers<br />
field by 2,4-D.<br />
Yield loss due to weeds. Yield loss due to weeds, compared with other pests (diseases and<br />
insects) was ranked 3 rd • <strong>The</strong> major reasons for this were first, weed problem is understood as<br />
a predictable problem in which farmers plan weed control ahead and they are sure that weed<br />
control is inevitable. On the other hand, disease and insect problems are unpredictable and no<br />
preparedness against them by farmers can be made ahead so as to prevent loss of yield.<br />
Second, weed control options are readily available than other pests which give comfort to<br />
farmers when viewing weeds as problem pests. Despite this, all farmers agreed that of all<br />
pests, the cost incurred to control weeds exceeds that of other pests summed together. Also<br />
from the interview, if weeds are left uncontrolled, on average 50% yield reduction is<br />
apparent, although total yield loss due to weeds is uncommon.<br />
Farmers were asked which weed species are most difficult to incur yield loss. <strong>The</strong>y ranked<br />
Gatium spurium, Guizotia scabra, Rumex bequartii and Polygonum nepalense as the most<br />
troublesome broadleaf weeds while Snowdenia polystachya, Bromus pectinatus, Avena Jatua<br />
and Lotium temulentum as the most troublesome grass weed species. Farmers' assessment of<br />
the problem weeds somehow agrees with the quantitative analysis obtained from the survey.<br />
296
Survey ofweed community structure - KefYalew et at.<br />
Another aspect of loss reflected due to weeds involves that of market price of produce.<br />
Fanners carrying wheat grain infested with weed seed always get on average 30% less price<br />
than those fanners carrying clean seed. This has direct relation with the type of weed<br />
management that farmers exercise.<br />
New weed problems. Farmers were asked if they came across new weed species or if weeds<br />
that had not been important had recently become so. Accordingly, 42.3% of the fanners<br />
interviewed responded 'no' while 57.7% responded 'yes'. Of the 57.7% responded 'yes'<br />
28.9% identified Bromus pectinatus, 5.9% Argemone mexicana and 2% Polygonum<br />
convolvulus. <strong>The</strong> rest identified weed species like Phalaris minor, Galium spurium and<br />
Guizotia scabra as new weed problems in their area.<br />
CONCLUSIONS AND RECOMMENDATIONS<br />
In the current survey, the following conclusions and recommendations can be drawn for<br />
researchers, extension workers and fanners.<br />
• <strong>The</strong> survey has documented th~ species and their relative importance in wheat.<br />
• <strong>The</strong> data from current survey is the first of its kind in the surveyed area; therefore, the<br />
data can be used in the future to detennine the impact of crop management and other<br />
factors on the weed species composition and community structure.<br />
• <strong>The</strong> first eight major weeds with high mean density and dominance are Polygonum<br />
nepalense, Phalaris minor, Bromus pectinatus, Galium spurium, Guizotia scabra,<br />
Galinsoga parvijlora, Cotula abyssinica, Anagallis arvensis.<br />
• Since the major weed species are limited in number, designing an effective weed<br />
management strategy for the surveyed area should be relatively simple.<br />
• Fanners and development workers should give due attention to new problem weeds<br />
before they become difficult for management.<br />
REFERENCES<br />
ARDU. 1982. Report on surveys and experiments carried out in 1980. 'Plant Husbandry department. Asella,<br />
Ethiopia: ARDD.<br />
Dale, M.R.T. and A.G. Thomas. 1987. <strong>The</strong> structure of Saskatchewan fields. Weed Sci. 35:348-355.<br />
Frick, B. and A.F. Thomas. 1992. Weed surveys in different tillage systems in southeastern Ontario field crops.<br />
Can. J. Plant Sci. 72:1337-1347.<br />
Giref Sahile and Workiye Tilahun. 1997. Results of a weed survey in the southeastern wheat plain of Asasa<br />
woreda. Arem 2&3: 100-102.<br />
Hidalgo, B., M. Saavedra and L. Garcia-Torres. 1990. Weed flora of dryland crops in the Cordoba region<br />
(Spain). Weed Res. 30:309-318.<br />
Kedir Nefo, Feyissa Tadesse and Tilahun Geleto. 1999. Results of weed surveys in the major barley and wheat<br />
growing areas of the Bale highlands. In: Fasil Reda and D.G. Tanner (eds.). Arem 5:85-95. EWSS,<br />
Addis Ababa.<br />
McCully, K.Y., M.G. Sampson and A.K. Watson. 1991. Weed survey of Nova Scotia lowbush Blueberry<br />
(Vaccinium angustifolium) fields. Weed Sci. 39:180-185.<br />
Naavas, M.L. 1991. Using plant population biology in weed research: A strategy to improve weed management.<br />
Weed Res. 31:171-179.<br />
Saavedra, M., L. Garcia-Torres, E. Herrnandez-Bermejo and B. Hidalgo. 1990. Influence of environmental<br />
factors on the weed flora in crops in the Guadalguivir valley. Weed Res. 30: 363-374.<br />
Swanton, C.J., D.R. Clements and D.A. Derksen. 1993. Weed succession under conservation tillage: A<br />
hierarchical framework for research and management. Weed Techno!. 7:286-297.<br />
Taye Tessema and Yohannes Lemma. 1998. Qualitative and quantitative determination of weeds in tef in west<br />
Shewa zone. In: Fasil Reda and D.G. Tanner (eds.). Arem 4: 46-60. EWSS, Addis Ababa.<br />
297
Survey ofweed community stntcture - Kefyalew et al.<br />
Taye Tessema, Yohannes Lemma and Belayneh Admasu. 1999. Qualitative and quantitative determination of<br />
weed occurrence in wheat in west Shewa zone of Ethiopia. pp. 160-172. In: CIMMYT. <strong>The</strong> Tenth<br />
<strong>Regional</strong> <strong>Wheat</strong> <strong>Workshop</strong> for <strong>Eastern</strong>, Central and Southem Africa. Addis Ababa, Ethiopia:<br />
CIMMYT.<br />
Thomas, A.F. and M.R.T. Dale. 1991. Weed community structure in spring seeded crops in Manitoba. Canadian<br />
l. of Plant Science 71: 1069-1080.<br />
Thomas, A.G. 1985. Weed survey system used in Saskatchewan for cereal and oilseed crops. Weed Sci. 33:34<br />
43.<br />
Thomas, A.G., and l.A. Ivany. 1990. <strong>The</strong> weed flora of Prince Edward Island cereal fields. Weed Sci. 38: 119<br />
124.<br />
Zanin, A.B.G., G. Baldoni, C. Grignani, M. Mazzoncini, P. Montemurro, F. Tei, C. Vazzana and P. Viggiani.<br />
1992. Frequency distribution of weed counts and applicability of a sequential sampling method to<br />
integrated weed management. Weed Res. 32:39-44.<br />
298
Survey ofweed community structure - Kefyalew et at.<br />
Table 1.<br />
Weed species characteristics and quantitative analysis of Digelu and Tijo,<br />
parts of Tiyo and Munesa districts, 1999.<br />
Botanical name Family characteristics F MFD · MOFD· Domin<br />
Amaranthus spp. Amaranthaceae a d s 7.69 0.81 10.50 0.16<br />
Anagallis arvensis Primulaceae a d s 61.54 8.23 13.38 1.59<br />
Alchemilla abyssinica Rosaceae a d s 3.85 0.27 7.00 0.05<br />
Avenafatua Poaceae a m s 3.85 0.27 7.00 0.05<br />
Bromus pectinatus Poaceae a m s 76.92 55.19 71.75 10.68<br />
Cerastium octandrum Caryophylaceae a d s 36.54 4.00 10.95 0.77<br />
Chenopodium spp. Chenopodaceae a d s 38.46 2.96 7.70 0.57<br />
Commelina banghalensis Commelinaceae alp d s/v 11.54 0.85 7.33 0.16<br />
Corrigiola capensis Caryophylaceae a d s 28.85 3.31 11.47 0.64<br />
Cotula abyssinica Compositae a d s 38.46 8.92 23.20 1.73<br />
Cynodon dactylon Poaceae p m s/v 15.38 0.96 6.25 0.19<br />
Cynoglssum lanceolatum Boraginaceae a d s 1.92 0.23 12.00 0.04<br />
Cyperus spp. Cyperaceae p m s/v 19.23 7.38 38.40 1.43<br />
Daucus carrota Umbelliferae alb d s 28.85 3.04 10.53 0.59<br />
Digitaria abyssinica Poaceae p m s/v 17.31 3.12 18.00 0.60<br />
Eragrostis aspera Poaceae a m s 9.62 0.50 5.20 0.10<br />
Erucastrum arabicum Cruciferae a d s 25.00 2.15 8.62 0.42<br />
Euphorbia spp. Euphorbiaceae alp d s 1.92 0.08 4.00 0.01<br />
Galinsoga parviflora Compositae a d s 40.38 9.42 23.33 1.82<br />
Galium spurium Rubiaceae a d s 92.31 45 .38 49.17 8.78<br />
Ganaphalium declinatum Compositae a d 11.54 4.19 36.33 0.81<br />
Guizotia scabra Compositae a d s 94.23 19.85 21.06 3.84<br />
Haplocarpha shimperi Compositae alp d s 5.77 0.92 16.00 0.18<br />
Lamiumspp. Labiatae a d s 3.85 0.08 2.00 0.01<br />
Lotium temulentum Poaceae a m s 73.08 6.12 8.37 l.l8<br />
Misopates orantium Scrophulariaceae a d s 44.23 4.8] 10.87 0.93<br />
Myosotis arvensis Boraginaceae a d s 1.92 0.04 2.00 0.01<br />
Ocimumspp. Labiatae a d s 3.85 0.38 10.00 0.07<br />
Oxalis corniculata Oxalidaceae alp d s/v 42.31 6.15 14.55 1.19<br />
Pennisetum spp. Poaceae p m s/v 3.85 0.58 15.00 0.11<br />
Phalaris minor Poaceae a m s 75.00 96.88 129.18 18.75<br />
Plantago lanceolata Plantignaceae alb m s 15.38 1.12 7.25 0.22<br />
Polygonum convolvulus Polygonaceae a d s 3.85 0.35 9.00 0.07<br />
Polygonum nepalense Polygonaceae a d s 98.08 203.54 207.53 39.38<br />
Portulaca oleracea Portulacaceae a d s/v 1.92 0.12 6.00 0.02<br />
Ranunculus spp. Ranullculaceae p d s 3.85 0.15 4.00 0.03<br />
Rumex abyssinicus Polygonaceae a d s/v 5.77 0.38 6.67 0.07<br />
Rumex bequartii Polygonaceae a d s/v 38.46 2.58 6.70 0.50<br />
Setaria pumila Poaceae a m s 17.31 5.77 33.33 1.12<br />
Snowdenia polystachya Poaceae a m s 15.38 3.23 21.00 0.63<br />
..<br />
Solanum nigrum Solanaceae a d s 3.85 0.42 11.00 0.08<br />
Sonchus oleraceus Compositae a d s 25.00 l.l5 4.62 0.22<br />
Spilanthus mauritiana Compositae<br />
a d s l.92 0.04 2.00 0.01<br />
-<br />
Trifolium spp. Leguminosae a d s 17.31 0.69 4.00 0.13<br />
Vicia dicarpa Leguminosae a d s 3.85 0.54 14 0.10<br />
a, b, p, m, d, represents annual, bmmai, perennial, monocotyeldon, dlcotyeldon whIle s and v represent<br />
reproduction by seed and vegetative means.<br />
299
Survey ofweed community structure - KeJYalew et al.<br />
~ I<br />
+Pdwun<br />
.G..i2dia<br />
•<br />
GalllI11<br />
XBroous <br />
XA1alais <br />
175 ~ eLdilm<br />
+Anagallis<br />
,~j<br />
OxaIis<br />
__ I<br />
lsi<br />
;d~.Jmexb<br />
-Msqlates<br />
Galinscga<br />
Olerqxxilm<br />
.. Cd:uIa<br />
.<br />
~<br />
·iii ilCeraslilm <br />
c Cooigida<br />
.gOO<br />
x<br />
-[Wcus<br />
'75 :E '<br />
I<br />
- Eruca:stnm<br />
.Sooch..Is<br />
~ ; c,.perus<br />
Allgitria<br />
x Xsaaia<br />
so J<br />
X Trifdilm<br />
I .Oyro:loo<br />
25L '<br />
o A • - ,! i. · '.:, · .Er5%.<br />
300
Survey ofweed community structure - Kej/alew et al.<br />
80.00<br />
70.00<br />
60.00<br />
50.00<br />
40.00<br />
30.00<br />
20.00<br />
10.00<br />
group1vs2 group1vs3 group2vs3<br />
Fig. 2. Similarity indices of surveyed areas classified into three<br />
groups (1, 2 and 3 for light, black and red soils, respectively).<br />
//1 .--~- ----'" - ---.. - . ~.--,,---- .------. ---<br />
un cereal/continuous<br />
o fallow<br />
Elrotation<br />
N<br />
E<br />
;;:,<br />
c<br />
;j<br />
8<br />
'0<br />
CI)<br />
CI)<br />
~<br />
150<br />
100<br />
50<br />
Total TGW TBW<br />
Fig. 3. <strong>The</strong> relationship between cropping system practiced by farmers and weed<br />
count data. TGW and TBW represent total grass and broadleaf weeds, respectively.<br />
301
EVALUATION OF HERBICIDES FOR THE CONTROL OF BROME GRASS<br />
. IN WHEAT IN SOUTH-EASTERN ETHIOPIA<br />
Shambel Marui, Kefyalew Ginna l and D.G. Tanner 2<br />
IKulumsa Agricultural Research Center (EARO), P.O. Box 489, Asella, Ethiopia<br />
2CIMMYT/CIDA <strong>Eastern</strong> Africa Cereals Program, P.O. Box 5689, Addis Ababa, Ethiopia<br />
ABSTRACT<br />
Brome grass (Bramus peetinatus) is a major grass weed in wheat for which no<br />
chemical control is currently/ available in Ethiopia. As a result, small-scale<br />
farmers suffer dramatic grain yield losses in infested fields. A weed control<br />
trial comparing two new herbicides, applied at different rates and timings,<br />
with a weedy check was conducted on seven farmers' fields in S.E. Ethiopia<br />
during the 1999 cropping sea~on. Sulfosulfuron (post) applied at 30 g a.i. ha'i<br />
resulted in 91 and 65% control of brome grass at Asasa and Etheya,<br />
respectively. <strong>The</strong> combination of sulfosulfuron (post) at 22 g a.i. ha'l plus<br />
ethiozin (pre) at 1.6 kg a.i. ha'! also exhibited good control of brome grass.<br />
Applying sulfosulfuron (post) at 22 g a.i. ha'\ sulfosulfuron (post) at 30 g a.i.<br />
ha' , and sulfosulfuron (post) at 22 g a.i. ha'i plus ethiozin (pre) at 1.6 kg a.i.<br />
ha'! produced grain yield increments of 101-140% and 61-120% relative to the<br />
weedy check at Asasa and Etheya, respectively. <strong>The</strong> herbicidal chemicals<br />
sulfosulfuron and ethiozin exhibit significant potential to control problematic<br />
grass weeds including brome grass in the wheat growing areas of Ethiopia. As<br />
brome grass exhibits special adaptive characteristics such as a high rate of<br />
seed production and early maturity relative to the wheat crop, herbicidal<br />
control should not be considered as the only option. Thus, it is recommended<br />
to conduct additional research to confirm the results of this experiment and to<br />
devise an integrated approach to the control ofbrome.grass.<br />
INTRODUCTION<br />
Although Ethiopian wheat producers attempt to minimize losses from weeds, grass weed<br />
species present a serious production constraint in the wheat growing areas of the southeastern<br />
highlands. Brome grass is one such weed species that recently became prominent in<br />
the affected cropping systems due to a weed population shift attributed primarily to<br />
continuous cereal cropping and frequent use of selective herbicides against previously<br />
common grass weeds such as AvenaJatua (Tanner and Giref, 1991; Amanuel et at., 1992).<br />
Globally, research scientists have attempted to develop herbicides to selectively control<br />
Bramus weed species during the last two decades (Stahlman, 1984). Metribuzin exhibited<br />
moderate control of B. seealinus and B. teetarum in wheat with a narrow window of<br />
application (Koscelny and Peeper, 1990). However, this herbicide has been ineffective for the<br />
control of B. peetinatus in Ethiopia (Giref, 1998). However, ethiozin applied pre-emergence<br />
at a rate of 3.6 kg a.i. ha'i reduced the population ofB. peetinatus by 39% in the field; control<br />
was reported to be 100% in a glass house screening with ethiozin applied at a rate of at least<br />
1.3 kg a.i. ha'l either pre- or post-emergence (Giref, 1998). Pre-emergence application of the<br />
302
Evaluation ofherbicides for the control ofbrome grass - Shambel et al.<br />
same herbicide on fanners' fields at the rate of 1.6 kg a.i. ha- l achieved 68% control of brome<br />
grass (KRC, 1998). However, under specific field conditions, the population of the weed is<br />
not dramatically reduced after spraying; this might be due to a number of factors including<br />
application timing, growth stages of either the crop or the weed at the time of spraying,<br />
and/or differential impact of weather condition and soil type.<br />
It was, therefore, considered necessary to evaluate several herbiCides, including a newly<br />
introduced product, for the control of brome grass under fanners' field conditions. <strong>The</strong> new<br />
product originated from Monsanto: a sulfonyl urea compound named sulfosulfuron was<br />
reported to control Bromus spp. and several other 'grass and broad leaf weeds including Avena<br />
fatua, Phalaris minor, Anagallis arvensis and Medicago polymorpha in wheat (Monsanto,<br />
1998). <strong>The</strong> herbicide is already marketed in the USA by Monsanto as a selective herbicide for<br />
the control of annual weeds in wheat (Koscelny et al., 1997). Due to its high efficacy in<br />
controlling Bromus spp., further studies on the absorption and translocation of this herbicide<br />
have been carried out recently (Olson et aI., 1999; Miller et ai" 1999). <strong>The</strong> objective of the<br />
current research was to evaluate the effects of sulfosulfuron relative to other promising<br />
herbicides on brome grass and other annual weed species in brea
Evaluation ofherbicides for the control ofbrome grass - Shambel et al.<br />
measured and recorded. Harvest index (HI) (%), grains per spike (no. m- 2 ) and grains per<br />
meter square (no. m-~) were determined from the above measured parameters.<br />
Before statistical analysis, weed density data were transformed using the square root of<br />
[actual count data + O.S] to satisfy the assumptions of normality and homogeneity of variance<br />
of the data. Crop and weed data were then subjected to analysis of variance, combining the<br />
two sites for each of the three locations (i.e., excluding the Kulumsa data). Subsequently, the<br />
effects of the eight treatments in each location were partitioned into meaningful single degree<br />
of freedom components (Table 2). ANOV A of the data was performed with MST ATC<br />
statistical software, while orthogonal contrasts were cal
Evaluation ofherbicides for the control ofbrome grass - Shambel et al.<br />
Considerable difference in biomass yield of wheat was observed between treated and<br />
untreated plots. Herbicide treated plots out yielded untreated plots by 62, 19 and 68% at<br />
Asasa, Bekoji and Etheya, respectively (contrast #1 in Table 4). Plots receiving preemergence<br />
application of ethiozin produced higher biomass yields than post-emergence<br />
applications (contrast #3 in Table 4).<br />
Weed control increased wheat grain yield by 72, 14 and 76% at Asasa, Bekoji and Etheya,<br />
respectively, cf. the weedy check (contrast #1 in Table 4). <strong>The</strong> standard herbicide treatment<br />
(T6) outyielded sulfosulfuron treated plots (3400 vs. 2919 kg ha- 1 ) at Etheya (contrast #2 in<br />
Table 4). This could be attributed to the superior activity of the two herbicides against a<br />
broad range of weeds at an early growth stage, thereby improving resource exploitation by<br />
the wheat crop. <strong>The</strong> significance of contrast #2 for total broad leaf weed seedling and total<br />
grass inflorescence densities at Etheya substantiates this argument: T6 significantly reduced<br />
total broad leaf and grass weed populations cf. the sulfosulfuron treatments - despite a<br />
significant decrease of brome grass populations by sulfosulfuron cf. T6. Thus, wheat grain<br />
yields responded to differences in the weed flora at each location, and to differential<br />
responses of the respective flora to the applied weed control treatments.<br />
Pre-emergence application of ethiozin exhibited superior control of brome grass density at<br />
Bekoji and total grass weed density at Bekoji and Etheya (contrast #3 in Table 4). This<br />
differential effect was reflected in a 22-49% grain yield advantage for pre-emergence ethiozin<br />
cf. post-emergence application across the three locations (contrast #3 in Table 4).<br />
A significant difference in wheat spike density at maturity was observed between the<br />
unweeded vs. herbicide treated plots (295 vs~ 349 spikes m- 2 at Asasa and 203 vs. 262 spikes<br />
m- 2 at Etheya) (contrast #1 in Table 4).<br />
Broad leaf weed seedling densities were reduced 10 days after herbicide application by 53%<br />
at Asasa, 52% at Bekoji, and 57% at Etheya. Obviously, broad leaf weed densities differed<br />
between the unweeded check and herbicide treated plots (contrast #1 in Table 4). <strong>The</strong><br />
broadleaf herbicide included in T6, Starane M, demonstrated superior control of broad leaf<br />
weeds cf. sulfosulfuron alone which was reputed to be effective against a range of grass and<br />
broad leaf weed species (contrast #2 in Table 4). Apparently, the activity of sulfosulfuron on<br />
broadleaf weeds was lower than indicated on the product label (Monsanto, 1998).<br />
Brome grass panicle counts at maturity exhibited highly significant effects of herbicides<br />
(Table 4). <strong>The</strong> panicle density of brome grass was markedly lower in the sulfosulfuron<br />
treated plots cf. plots treated with Puma Super + Starane M at Bekoji and Etheya (contrast #2<br />
in Table 4). Also, the combination of sulfosulfuron + ethiozin (T3) significantly reduced<br />
brome grass panicle density compared with the unweeded cheek. <strong>The</strong>refore, pre-emergence<br />
application of ethiozin exhibits potential for the control of brome grass infestation. In general,<br />
across locations and sites, sulfosulfuron reduced the panicle density of brome grass by 47%<br />
cf. the weedy check. Weed count data 10 days after herbicide application revealed that<br />
sulfosulfuron at the high rate (T1) reduced brome grass density by 91 % at Asasa and 65% at<br />
Etheya. Correlation analysis revealed a strong negative relationship between wheat grain<br />
yield and brome grass density at Etheya (r = -0.48, P
Evaluation ofherbicides for the control ofbrome grass - Shambel et al.<br />
other common grass weed species in the testing sites such as Setaria pumila and Phalaris<br />
minor (Amanuel et al., 1992). Pre-emergence applied ethiozin also showed good control of<br />
the total grass weed population. However, since the experiment was conducted on-farmers'<br />
fields under natural infestations, there were several flushes of weeds emerging throughout the<br />
crop cycle; thus, an apparently poor percent control of the weed may not reflect the actual<br />
efficacy of a post-emergence applied herbicide.<br />
CONCLUSIONS<br />
<strong>The</strong> herbicidal chemicals sulfosulfuron and ethiozin exhibit significant potential to control<br />
problematic grass weeds including brome grass in the wheat growing areas of Ethiopia. As<br />
brome grass exhibits special adaptive characteristics such as a high rate of seed production<br />
and early maturity relative to the wheat crop, herbicidal control should not be considered as<br />
the only option. Thus, it is recommended to conduct additional research to confirm the results<br />
of this experiment and to devise an integrated approach to the control ofbrome grass.<br />
ACKNOWLEDGMENTS<br />
This experiment was financially supported by the Ethiopian Agricultural Research<br />
Organization (EARO) in cooperation with the CIMMYT/CIDA <strong>Eastern</strong> Africa Cereals<br />
Program. <strong>The</strong> authors express their gratitude to Workiye Tilahun and Mekonnen Kassaye for<br />
assistance in the execution of the experiment and collection of all necessary data.<br />
REFERENCES<br />
Amanuel Gorfu, D.G. Tanner and Asefa Taa. 1992. Oh-fann evaluation of pre- and post-emergence grass<br />
herbicides on bread wheat in Arsi Region of Ethiopia. pp. 330-337. In: Seventh <strong>Regional</strong> <strong>Wheat</strong><br />
Worhhop for <strong>Eastern</strong>, Central and Southern Africa. Tanner, D.G. and Mwangi, W. (Eds.). Nakuru,<br />
Kenya, CIMMYT.<br />
Giref Sahile. 1998. Evaluation of herbicides for the control ofBromus in wheat. Arem 4: 114-118.<br />
Koscelny, J.A., GL Cramer, S.E. Blank, N.R. Hageman, PJ. Isakson, D.K. Ryerson and S.K. Parrish. 1997.<br />
MON 37500: A new selective herbicide to control annual weeds in wheat. Western Soc. afWeed Sci.<br />
50:59.<br />
Koscelny, I.A. and T.F. Peeper. 1990. Herbicide-grazing interactions in cheat (Bromus secalinus) infested<br />
winter wheat (Triticum aestivum). Weed Sci. 38:532-535. .<br />
KRC (Kulumsa Research Center). 1998. Annual Report of1997/98 Cropping Season. Kulumsa, Ethiopia,<br />
KARC.<br />
Miller, P.A., P. Westra and S.l. Nissen. 1999. <strong>The</strong> effect of surfactant and nitrogen on foliar absorption ofMON<br />
37500. Weed Sci. 47:270-274.<br />
Mohammed Hassena, Regassa Ensennu and Kefyalew Ginna. 1996. On-farm verification of advanced bread<br />
wheat lines under recommended and fanners' management levels in Arsi Region. pp. 231-237. In: <strong>The</strong><br />
Ninth <strong>Regional</strong> <strong>Wheat</strong> Worhhop for <strong>Eastern</strong>, Central and Southern Africa. Tanner, D.G., Payne, T.S.<br />
and Abdalla, O.S. (Eds.). Addis Ababa, CIMMYT.<br />
Monsanto. 1998. Monitor 75 WG: <strong>Wheat</strong> Herbicide by Monsanto. Monsanto South Africa (Pty) Ltd. Sandton,<br />
South Africa.<br />
Olson, B.L., K. AI-Khatib, P. Stahlman, S. Parrish and S. Moran. 1999. Absorption and translocation of MON<br />
37500 in wheat and other grass species. Weed Sci. 47:37-40.<br />
Stahlman, P.W. 1984. Downy brome (Bromus tectorum) control with dic1ofop in winter wheat (Triticum<br />
aestivum). Weed Sci. 32:59-62.<br />
Tanner, D.G. and GirefSahile. 1991. Weed control research conducted in wheat in Ethiopia. pp. 235-275. In:<br />
<strong>Wheat</strong> Research in Ethiopia: A Historical Perspective. Hailu Gebre-Mariam, D.G. Tanner and<br />
Mengistu Hulluka (Eds.). Addis Ababa, IARICIMMYT.<br />
Thomson, W.T. 1993. Agricultural Chemicals Book II. Herbicides (revised edition). Thomson Pub., Fresno,<br />
California.<br />
306
Evaluation ofherbicides for the control ofbrome grass - Shambel et al.<br />
Table 1. Treatments included in the on-farm trials.<br />
Common name(s) · R,afe(s) Time of-application<br />
Tr. # (kg ait 'ha o1 ) .<br />
<br />
1 sulfosulfuron 0.03 Post (1-4 leaf)<br />
2 sulfosulfuron 0.0222 Post (1-4 leaf)<br />
3 ethiozin + sulfosulfuron 1.6 + 0.0222 Pre + Post (1-4 leaf)<br />
4 ethiozin + 2,4-0 1.9 + 0.72 Pre + Post (3-5 leaf) _<br />
5 ethiozin + 2,4-0 1.6 + 0.72 Post (2-4) + Post (3-5)<br />
6 fenoxaprop-p-ethyl + fluroxypyr + MCPA 0.069 + 0.07 + 0.4 Post (1-4 leaf)<br />
7 2,4-0 0.72 Post (3-5 leaf)<br />
8 Weedy check -<br />
Table 2. Orthogonal contrast coefficients used in the treatment comparisons.<br />
Contrast: #1 .#2 #3<br />
Herbicides sulfosulfuron.. ethiozin pre<br />
Tr.# ys. vs.<br />
vs.<br />
Unweeded<br />
,- ;<br />
Tr~#6 ethiozin po~t<br />
1 1 1 0<br />
2 1 1 0<br />
3 1 0 1<br />
4 1 0 1<br />
5 1 . 0 -2<br />
6 1 -2 0<br />
0 '<br />
7 1 0 0<br />
8 -7 0 0<br />
Table 3. Effect of treatments on grain yield (GY) at Asasa, Bekoji and Etheya sites.<br />
Asasa Bekoji Etheya<br />
Treatment GY GYI a GY' GYI a . GY GYl a<br />
(kg/ha) (%) (kg/ha) (%) (kg/ha) (%)<br />
<br />
1 3062 AB 107 3622 A 18 2920 BC 62<br />
2 2970 B 101 3641 A 19 2919 BC 61<br />
3 3540 A 140 3642 A 19 3980 A 120<br />
4 1973 CD 33 3840 A 25 3912 A 116<br />
5 2149 C 45 3068 C 0 2646 C 46<br />
6 2791 B 89 3486 AB 14 3400 AB 88<br />
7 1309 E -11 3157 BC 3 2468 C 37<br />
8 1478 DE - 3065 C - 1808 D<br />
Mean 2409 3440 3007 <br />
LSD(o,o5) 556.3 395.5 643.9 <br />
C.V.(%) 19.5 9.7 18.1 <br />
Means followed by same letter are not sigmficantly dIfferent at the 5% level of LSD test.<br />
a Relative to weedy check.<br />
307
Evaluation ofherbicides for the control ofbrome grass - Shambel et at.<br />
Table 4. Results of ANOVA and orthogonal contrast analyses.<br />
"<br />
'~ ..<br />
Treatment Contrast b<br />
effe~t<br />
#1 #2 #3 .....<br />
Parameter' ." A B E A B E A B E .A . ·.'n·· , 'E'<br />
Seedlings m- 2 ** NS NS NS NS NS NS NS NS * * NS<br />
Mean 213 188 220 173 204<br />
C.V.(%) 17.8 18.0 16.7 vs.223 vs. 162<br />
BY (kg ha-') *** ** ** *** * *** NS NS NS * *** ***<br />
Mean 7350 10602 8118 7720 10814 8551 8159 12205 10601<br />
C.V.(%) 16.7 13.9 17.9 vs.4755 vs.9116 vs. 5089 vs.6817 vs.9467 vs. 7406<br />
GY (kg ha-') *** ** *** *** ** ** NS NS P
EVALUATION OF THE EFFECTS OF SURF ACE DRAINAGE METHODS <br />
ON THE YIELD OF BREAD WHEAT ON VERTISOLS IN ARSI ZONE <br />
Yesuf Assen, Duga Debele and Amanuel Gorfu<br />
Kulumsa Agricultural Research Center, P.O. Box 489, Asela, Ethiopia<br />
ABSTRACT<br />
An experiment was conducted to investigate and confirm the effect of<br />
different surface drainage methods on the yield of bread wheat on Vertisols at<br />
two locations in Arsi Zone of south-eastern Ethiopia for three consecutive<br />
years. <strong>The</strong> experiment compared two surface drainage methods, ridge and<br />
furrow (RF) and broad bed and furrow (BBF), with a flat seedbed (control).<br />
<strong>The</strong> combined statistical analysis over years revealed that, at Sagure, grain<br />
yield increases of about 1200 and 690 kg/ha were obtained using BBF and RF<br />
surface drainage methods, 'respectively. Similarly, at Arsi-Robe, grain yield<br />
increases were 660 and 300 kg/ha over the control treatment using BBF and<br />
RF surface drainage, respectively. Straw yields were influenced in a similar<br />
manner. Furthermore, the use of BBF reduced the time taken to cover the seed<br />
at sowing significantly (11.6 hr/ha), followed by RF (22.9 hr/ha), as compared<br />
to the flat seedbed (42.3 hr/ha). <strong>The</strong> overall assessment of surface drainage<br />
methods ranks BBF first for the parameters considered in this study. <strong>The</strong><br />
current result confirmed earlier findings in central Ethiopia.<br />
INTRODUCTION<br />
In Ethiopia, Vertisols cover about 12.6 million ha of land of which about 13% are found in<br />
south-eastern part of the country (Bull, 1987). <strong>The</strong>se soils have great potential for crop<br />
production since they are located mainly in the highlands where there is reliable rainfall and<br />
intensive farming. <strong>The</strong> south-eastern parts of the couritry in general and Arsi zone in<br />
particular are among the most important areas for bread wheat production. However, due to<br />
the inherent characteristics of these soils coupled with high rainfall" yield is low mainly due<br />
to waterlogging. Waterlogging results in poor aeration, lower soil microbial activities, loss<br />
and unavailability of plant nutrients and poor agricultural workability (Trough and Drew,<br />
1982; Tesfaye et al., 1991).<br />
According to Trough and Drew (1982), within two days, even at low temperature, available<br />
oxygen can be totally removed from the profile of waterlogged soil. Moreover, nitrogen<br />
availability can be seriously lowered in waterlogged soils due to denitrification caused by<br />
anaerobic soil bacteria (Belford et al., 1985; Cook and Veseth, 1991).<br />
<strong>The</strong> root tips, where most water, air and nutrient uptake takes place, are the first to suffer<br />
from waterlogging mainly due to lack of oxygen reducing the seminal root growth in<br />
particular (van Ginkel et al., 1991). As a result of this, the crop roots are poorly aerated and<br />
nutrient uptake for growth and development will be impaired (McDonald and Gardner, 1987).<br />
Waterlogging during tillering and stem elongation leads to fewer tillers, more floral sterility,<br />
fewer grains per spike, reduced kernel weight and a final yield loss of 50% or more (Grieve et<br />
309
Effects ofsurface drainage methods on yield ofbread wheat on Vertisols - Yesuf et al.<br />
al., 1986; McDonald and Gardner, 1987). Thus, wheat production on Vertisols is constrained<br />
by the physical and hydrological properties of these soils.<br />
Farmers in Ethiopia generally use different traditional methods to improve the drainage<br />
situation of these soils since antiquity. <strong>The</strong>se include, soil burning "guie" followed by a long<br />
period of fallowing after cropping, late planting (i.e., at the end of the main rain season) using<br />
a furrow with a certain interval after pJaI)ting or left for grazing (native pasture) because of<br />
severe drainage problems (ARDU, 1983). Such traditional soil, water and crop management<br />
practices have their own side effects due to decrease in soil fertility in the case of soil burning<br />
and terminal drought stress in case oflate planting (Mesfin et al., 1991).<br />
In order to alleviate this continued problem, various surface and sub-surface drainage<br />
methods such as camberbed, clay tiles, eucalyptus or bamboo poles were tested and found to<br />
be effective in raising the grain yield of wheat in Arsi Zone (ARDU, 1983). However, despite<br />
their effectiveness, the adoption of these technologies by subsistence farmers was limited.<br />
This is due to the cost of the materials which require high capital investment and<br />
inconvenience to implement some of the methods due to the fragmented nature of the<br />
farmers' land holding system as well (Tesfaye et al., 1991).<br />
Cultivars are the easiest technology to be adopted by subsistence farmers. However, it was<br />
recommended that complementary contributions of improved soil and water management<br />
practices that improve the drainage of Vertisols and offer an opportunity for early planting<br />
and thereby increase yield are essential (Himy, 1986; Tesfaye et al., 1991). Furthermore, it<br />
has been reported that removal of excess water from Vertisol sites enhance significantly the<br />
response of wheat to fertilizer application (Asnakew et al., 1991; Belford et al., 1985).<br />
<strong>The</strong>refore, the previously developed technology (BBF) by ILCA, now ILRI, which was found<br />
to be effective in the central part of Ethiopia was tested in Arsi Zone considering the greater<br />
physico-chemical heterogeneity of the soil and environment into account. This paper presents<br />
the effects 'of two surface drainage methods in comparison with. flat seedbed on the different<br />
crop parameters of bread wheat under Vertisol conditions in Arsi Zone of south-eastern<br />
Ethiopia.<br />
MATERIALS AND METHODS<br />
<strong>The</strong> experiment was conducted in Arsi Zone of south-eastern Ethiopia particularly at Arsi<br />
Robe (2420 m a.s.l.) and Sagure (2450 m a.s.l.) for three consecutive years starting from<br />
1993. Table 1 indicates the physico-chemical characteristics of the respective sites.<br />
<strong>The</strong> experiment encompassed two different surface drainage methods: Ridge and Furrow<br />
(RF), draining the excess water through the furrow while the crops are grown on the ridge;<br />
Broadbed and Furrow (BBF) developed by ILCA (Jutzi et al., 1987) which permits wheat<br />
seedlings to grow on the bed of 80 cm width and 20 cm furrow for water drainage. <strong>The</strong> flat<br />
seedbed was considered as a control. <strong>The</strong> plot size was 10 m by 9.8 m and the trial was laid<br />
out in a RCBD with three replications. <strong>The</strong> bread wheat variety ET-13 was used at a seed rate<br />
of 175 kg/ha together with application of 82-20 kg N-P per ha. Planting was done in the main<br />
season at the start of rain each year and for each location before soils become too wet. In<br />
1995, the time taken to cover the seed was recorded for each treatment and site. Weeds were<br />
controlled with herbicides. After maturity, plant height was measured and harvesting was<br />
done from an area of 9 m 2 by sickles just above ground level. <strong>The</strong>n, biomass and grain yield<br />
310
Effects ofsurface drainage methods on yield ofbread wheat on Vertisols - Yesuf et al.<br />
was recorded and the grain yield was adjusted to 12.5% moisture content before statistical<br />
analysis. Eventually, data were subjected to statistical analysis using the MSTATC statistical<br />
package, and differences between means were separated by the LSD test at the 0.05 level if<br />
significant treatment effects occurred.<br />
RESULTS AND DISCUSSION<br />
<strong>The</strong> first year (1993) results indicate, as apparently seen in Table 2, significant differences in<br />
grain yield both at Sagure and Arsi-Robe with a grain yield advantage of 1580 kglha<br />
(+ 122%) and 560 kglha (+56.9%), respectively, for broad bed and furrow (BBF) over the flat<br />
seedbed. At Sagure, the straw yield was significantly higher, 1450 kglha (+29%), for the BBF<br />
plots than the flat seedbed. Likewise, significantly taller plant height, 20.3 cm (+22.1 %) and<br />
9 cm (+11.5%) was recorded from BBF plots than the flat seedbed at Sagure and Arsi-Robe,<br />
respectively. This higher plant height from BBF plots contributed to the straw yield increase.<br />
Moreover, the BBF drainage method increased plant height by 12 cm (12%) over the RF.<br />
Even though there were increases in straw and grain yield from BBF plots over the ridge and<br />
furrow (RF) drainage method at both locations, the difference was significant only for grain<br />
yield at Arsi-Robe (Table 2).<br />
During the 1994 cropping season at Arsi-Robe, as shown in Table 3, a grain yield advantage<br />
of 460 kglha (+98%) and 220 kglha (+46.8%) were obtained due to BBF and ridge and<br />
furrow, respectively, over the flat seedbed. During the same cropping season, the result at<br />
Sagure indicate a significant variation in grain yield with an additional yield of 1290 kg/ha<br />
(+137%) and 610 kg/ha (+64.9%) using BBF and RF drainage methods in comparison with<br />
the flat seedbed, respectively. Although there was an increase in straw yield at both locations<br />
for BBF and RF, the result was not significant. A higher plant height, 13.3 cm (+24.2%), was<br />
recorded from BBF plots relative to the flat seedbed at Arsi-Robe. Similarly additional plant<br />
height of 8.7 cm (+9.7%) and 4.7 cm (+5.2%) was recorded from both BBF and RF drainage<br />
methods, re~pectively over the flat seedbed at Sagure (Table 3):<br />
Furthermore, in 1995 an extra grain yield of 940 kg/ha (+96.8%) was obtained using BBF as<br />
compared with the flat seedbed at Arsi Robe. At Sagure, the grain yield advantage was 620<br />
kglha (+40.4%) and 320 kg/ha (+20.4%) using BBF and RF drainage methods, respectively,<br />
relative to the flat seedbed. <strong>The</strong> straw yield was significant during this season, with an<br />
increase of 4190 kglha (+162%) and 3130 kg/ha (+102%) at Arsi Robe and 4355 kglha<br />
(+186%) and 1940 kg/ha (+82.1%) at Sagure using BBF and RF drainage methods,<br />
respectively, compared with the flat seedbed. Moreover, significantly higher plant height was<br />
recorded from BBF plots which was 15.4 cm (+18.9%) and 17 cm (+18.4%) over the flat<br />
seedbed at Arsi Robe and Sagure, respectively.<br />
Interestingly, the combined statistical analysis over years (Table 5) revealed that an extra<br />
grain yield of about 1200 kg/ha and 700 kglha over the control treatment were obtained using<br />
BBF and RF surface drainage methods at Sagure, respectively. Likewise, grain yield<br />
increases of 660 kg/ha and 170 kglha in comparison with the control treatment were obtained<br />
using BBF and RF surface drainage methods at Arsi-Robe, respectively.<br />
<strong>The</strong> higher clay content, relatively level gradient and inherent poor soil fertility at Arsi-Robe<br />
than Sagure (Table 1) basically elucidate the lower yield in the former location. Even though<br />
grain yield was generally low at this location, the result obtained with BBF was encouraging<br />
and significantly improved.<br />
311
Effects ofsurface drainage methods on yield ofbread wheat on Vertisols - Yesufet al.<br />
Moreover, in 1995, the time taken to cover the seed was recorded in both locations. <strong>The</strong><br />
combined statistical analysis result over locations indicated that, significantly, a very low<br />
time (11.6 hr/ha) was needed to cover the seed using BBF as compared to RF (22.9 hr/ha)<br />
and 42.3 hrlha for the control. Thus, by reducing the time required for seed covering at<br />
planting, the BBF method gives opportunity for the farmer to participate in other activities.<br />
<strong>The</strong> current finding is in agreement with results obtained in other parts of the country (Mesfin<br />
et al., 1991). <strong>The</strong>refore, the promising treatments, particularly BBF, can be used by farmers<br />
in Arsi Zone.<br />
CONCLUSION<br />
<strong>The</strong> attempt made to drain the excess water improved bread wheat yield. <strong>The</strong> outcome of the<br />
experiment is in agreement with results obtained in other parts of the country. <strong>The</strong> overall<br />
assessment of the drainage methods puts BBF on top of the other treatments with regard to<br />
grain and straw yields obtained at both locations. <strong>The</strong> BBF was also the most efficient<br />
method to cover the seed at planting in waterlogged soils. <strong>The</strong>refore, in waterlogged soils,<br />
use of an efficient drainage method such as BBF would help to improve grain and straw yield<br />
thus allowing integrated crop and livestock production.<br />
REFERENCES<br />
Arsi Rural Development Unit (ARDU). 1983. On the activities of the plant husbandry department. ARDU<br />
Publication No. 24. Nov. 1983.<br />
Asnakew Woldeab, Tekaligne Mamo, Mengesha Bekele and Tefera Ajema. 1991. Soil fertility management<br />
studies on wheat in Ethiopia. In: Hailu Gebre-Mariam, Douglas G. Tanner and Mengistu Hulluka<br />
(eds.). <strong>Wheat</strong> research in Ethiopia: A historical perspective. Addis Abeba: IAR/CIMMYT.<br />
Belford, R.K., R.Q. Canell, and R.J. Thomson. 1985. Effect of single and multiple waterloggings on the growth<br />
and yield of winter wheat on a clay soil. J. Sci. Food Agri. 36: 142-156.<br />
Bull, T.A. 1987. Agroecological Assessment of Ethiopian Vertisols. Management of Vertisols in Sub-Saharan<br />
Africa. Proceedings of a conference held at ILCA. Addis Ababa, Ethiopia.<br />
Cook, R.J. and R.J. Veseth. 1991. <strong>Wheat</strong> health management. APS Press. pp 152.<br />
Grieve, A.M., E. Dunford, D. Marston, R.E. Martin and P. Siavich. 1986. Effects of waterlogging and soil<br />
salinity on irrigated agriculture in the Murray Valley: A review. Aust. J. Exp. Agri. 26:761-77.<br />
Hiruy Belayneh. 1986. <strong>The</strong> effect ofdrainage systems, drainage spacing and fertilizer on seed yield and other<br />
characteristics of wheat, teff and chickpea on heavy clay soil of Ginchi. Eth. J. Agri. Sci. 8: 85-94.<br />
Jutzi, S.C., F.M. Anderson and Abiye Astatke. 1987. Low cost modification of the traditional Ethiopian tine<br />
plow (maresha) for land shaping and surface drainage of heavy clay soils, preliminary results from on<br />
farm verification trials. ILCA Bull. No. 27.<br />
McDonald, G.K. and W.K. Gardner. 1987. Effect of waterlogging on the grain yield of wheat. Aust. J. Exp.<br />
Agri. 27: 661-670.<br />
Mesfin Abebe, Tekalign Mamo, Miressa Duffera and Selamyihun Kidanu. 1991. Durum wheat response to<br />
improved drainage of vertisols in the central highlands of Ethiopia. In: D.G. Tanner and Wilfred<br />
Mwangi (eds.). <strong>The</strong> Seventh <strong>Regional</strong> <strong>Wheat</strong> <strong>Workshop</strong> for <strong>Eastern</strong>, Central and Southern Africa.<br />
Nakuru, Kenya, Sep. 16 - 19, 1991. pp 407-410.<br />
Tesfaye Tesema, Getachew Belay and Demissie Mitiku. 1991. Evaluation of durum wheat genotypes for<br />
naturally waterlogged highland vertisoils of Ethiopia. In: D.G. Tanner and Wilfred Mwangi (eds.). <strong>The</strong><br />
Seventh <strong>Regional</strong> <strong>Wheat</strong> <strong>Workshop</strong> for <strong>Eastern</strong>, Central and Southern Africa. Nakuru, Kenya, Sep. 16<br />
19,1991.pp96-98.<br />
Trough, M.C.T. and M.C. Drew. 1982. Effects of waterlogging on young wheat plants (Triticum aestivum L.)<br />
and on soil solutes at different soil temperatures. Plant and Soil 69: 311-326.<br />
Van Ginkel M., S. Rajaram and M. Thijssen. 1991. Water logging in wheat. Germplasm evaluation and<br />
methodology development: In: D.G. Tanner and Wilfred Mwangi (eds.). <strong>The</strong> Seventh <strong>Regional</strong> <strong>Wheat</strong><br />
<strong>Workshop</strong> for <strong>Eastern</strong>, Central and Southern Africa. Nakuru, Kenya, Sep. 16 - 19, 1991. pp 115-120.<br />
312
Effects ofsurface drainage methods on yield ofbread wheat on Vertisols - Yesufet al.<br />
Questions and Answers:<br />
Mamoun I. Dawelbeit: What are the types of implements used for seeding and bed<br />
formation?<br />
Answer: A chain attached to the broadbed maker is used to cover the seed after broadcasting.<br />
<strong>The</strong> broadbed maker (BBM) is used to make the bed.<br />
Table 1.<br />
<strong>The</strong> physico-chemical characteristics of the top soil (0-30 cm) and rainfall<br />
data for the different years and respective sites.<br />
·Soir~haracteristics ·<br />
Location Year Soil texture .. %}.. 0 OM .·<br />
o<br />
N;'-••<br />
P -Rain~fall<br />
<br />
,.<br />
.. Sand t Silt _. ···Clay . .' (%) (%} , (Plim) pH (mm)<br />
Arsi-Robe 1993 8.9 34.3 56.7 6.6 0.25 16 5.8 413<br />
1994 7.0 35.2 57.8 6.7 0.24 15 5.7<br />
1995 11.8 27.9 60.3 6.6 0.25 16 5.9 495<br />
Sagure 1993 17.7 39.8 42.5 9.9 0.54 9 5.9 409<br />
1994 18.6 36.0 45.4 9.7 0.53 10 5.6 578<br />
1995 18.4 32.1 49.5 9.8 0.55 10 5.7 529<br />
OM =SoIl orgamc matter; N =Total mtrogen; P =Available phosphorus; and Ramfall = Total ramfa II from<br />
June-Sep.<br />
Table 2.<br />
<strong>The</strong> effects of surface drainage methods on different crop parameters of<br />
bread wheat at Sagure and Arsi-Robe Vertisol sites in 1993.<br />
Locatlop<br />
Treatment Sa~ure Arsi:-Robe<br />
,.<br />
GRY STY PLHT GRY STY PLHT<br />
Flat seedbed 1296A 5003A 91.7A 986A 3353A 78.3A<br />
RF 2388B 5330AB 100.3B 1112B 3588A 81.7AB<br />
BBF 2876B 6456B 112C 1547C 4018A 87.3B<br />
Mean 2186 5596 101.3 1215 3653 82.4<br />
LSD (0.05) 705 1196 3.94 197 NS 5.9<br />
C.V.(%) 16.15 10.7 1.95 8.13 13.18 3.64<br />
Means In a column followed by a common letter are not slgmficantly dIfferent from each other at the 5% level <br />
of the LSD test. <br />
NS = Non-significant; GRY = Grain yield (kglha); STY = Straw yield (kglha); PLHT = Plant height at harvest <br />
(cm); RF = Ridge and furrow; and BBF = Broadbed and furrow. <br />
313
Effects ofsurface drainage methods on yield ofbread wheat on Vertisols - Yesufet al.<br />
Table 3.<br />
<strong>The</strong> effects of surface drainage methods on different crop parameters of<br />
bread wheat at Sagure and Arsi-Robe Vertisol sites in 1994 .<br />
Treatment<br />
S~~pr,e .<br />
..." ~
Effects ofsurface drainage methods on yield ofbread wheat on Vertisols - Yesufet al.<br />
Table 6.<br />
<strong>The</strong> time taken to cover wheat seed at planting for the different drainage<br />
methods (hr/ha).<br />
"~ ,<br />
.Treatment Saglire Arsi-Rohe .. Over-Locations<br />
Flat seedbed 38.89A 45.8A 42.32A<br />
RF 22.22B 23.5B 22.88B<br />
BBF 10.05C 13.2C 11.64C<br />
Mean 23.72 27.5 25.61<br />
LSD (0.05) 3.468 3.03 3.486<br />
C.V.(%) 7.32 5.53 11.06<br />
Means In a column followed by a common letter are not significantly different from each other at the<br />
5% level of the LSD test. NS = Non-significant.<br />
315
CROP ROTATION EFFECTS ON GRAIN YIELD <br />
AND YIELD COMPONENTS OF BREAD WHEAT <br />
IN THE BALE HIGHLANDS OF SOUTH-EASTERN ETHIOPIA <br />
Tilahun Geleto 1, Kedir N efo 1 and F eyissa Tadesse 2<br />
lSinana Agricultural Research Center (OADB), P.O. Box 208, Robe-Bale, Ethiopia<br />
2Alemaya University of Agriculture, P.O. Box 138, Dire Dawa, Ethiopia<br />
ABSTRACT<br />
Rotation of alternate crops with bread wheat was studied at the Sinana R.C.<br />
using six precursor crops and two rates of fertilizer, viz., 9-23 and 41-46 N<br />
P20 5 kglha, applied to precursors and wheat. <strong>The</strong> break crops, viz., bread<br />
wheat, barley, emmer wheat, faba bean, field pea and linseed, were grown in<br />
the gena season of 1996 and bona of 1995 and 1997, while the main bread<br />
wheat crop was grown during alternate years in the gena season of 1997 and<br />
bona of 1996 and 1998 in separate fields for each season. Bread wheat after<br />
pulses produced a higher grain yield cf. after cereals with a yield advantage of<br />
8-14%. This advantage was higher in 1998 than 1996 implying a gmdual<br />
increase in the effect of rotation. Kernels m- 2 was the most important yield<br />
component contributing about 94.6% of the variation in grain yield. Fertilizer<br />
rate had a significant effect on grain yield, kernels m- 2 , kernels and yield per<br />
spike, harvest index, and straw yield during bona 1998. In general, pulses are<br />
beneficial break crops in contrast to continuous cropping of cereals. It is<br />
important to investigate the long-term effects of rotation and to extend the<br />
study to farmers' fields.<br />
INTRODUCTION<br />
Crop rotation, growing a sequence of plant species on the same land (Yates, 1954) is in<br />
contrast to the growing of the same species repeatedly on the same land (Power, 1990). It can<br />
maintain crop yields by controlling weeds, insects, and disease and preventing soil erosion.<br />
Crop rotation mostly maintains soil fertility through supplying nitrogen (Bullock, 1992).<br />
Bread wheat and barley are the most adapted and the main staple foo
Crop rotation effects on grain yield and yield components ofbread wheat - Tilahun et al.<br />
found that faba bean, field pea and linseed in that order are the best beneficial break crops in<br />
wheat production. <strong>The</strong>refore, a crop rotation experiment was conducted on bread wheat to<br />
evaluate the effect of different break crops on the grain yield and yield components of bread<br />
wheat; and to determine the most beneficial precursor crop in wheat production.<br />
MATERIALS AND METHODS<br />
Treatments and Experimental Design<br />
A crop rotation study was executed for bread wheat at Sinana on-station during bona (meher)<br />
(August to December) season of 1995-98 and gena (belg) (April to August) of 1996 and 1997<br />
seasons on two separate fields for each season. Precursors were grown during gena 1996 and<br />
bona 1995 and 1997 seasons while the principal crop was grown in alternate years i.e. gena<br />
1997 and bona 1996 and 1998 seasons.<br />
<strong>The</strong> treatments were laid out in a randomized complete block design with three replications.<br />
Six precursor crops, bread wheat, barley, emmer wheat, faba bean, field pea and linseed, and<br />
two rates of fertilizer, 9-23 and 41-46 N-P 2 0 S kglha, were sown each on a plot size 20 m 2<br />
having 20 rows of 5 m length. <strong>The</strong> distance between the rows was 20 cm. Urea and DAP<br />
were used as sources of fertilizer. Similar fertilizer rate was applied on both precursor and<br />
principal crop to minimize the variation of soil fertility. <strong>The</strong> arrangement and rates were<br />
repeated up to the end of the project. <strong>The</strong> experimental land was plougbed by tractors and<br />
row planting was made manually. Sowing dates ranged between mid August to early<br />
September. <strong>The</strong> variety ET -13 was used as a principal crop. <strong>The</strong> treatments were shown in<br />
Table 1.<br />
Data Collection and Measuring Methods<br />
At maturity, plant height, productive spikes m- 2 , and spike length were measured. Fourteen<br />
central rows of 5 m length (14 m 2 ) was harvested manually to measure grain and biomass<br />
yield. Thousand-kernel weight was measured from the sample grain yield. Harvest index was<br />
calculated from grain and biomass yields. <strong>The</strong> other parameters were calculated in the<br />
2<br />
following steps: (1) grain yield (g) spike-I = (grain yield (kg ha- I )1l0)/(spikes m- ); (2) kernel<br />
spike-I = (1000 kernels/weight of 1000 kernels (g)*yield spike- l (g); (3) kernels m- 2 = (kernels<br />
spike-')*(spikes m- 2 ); and (4) straw yield (kglha) = biomass yield (kglha) - grain yield<br />
(kglha).<br />
Statistical Analysis of Agronomic Parameters<br />
Data were subjected to analysis of variance using MST ATC microcomputer software.<br />
Parameters of the principal crop were analyzed each year separately. Treatment degrees of<br />
freedom (df) and total sum of squares of precursor were partitioned by orthogonal contrasts<br />
into 5 meaningful single df components for each parameter. <strong>The</strong> major groups are:<br />
1. Pulses vs. cereals and linseed<br />
2. Cereals vs. linseed<br />
3. Within cereal group, wheat vs. barley<br />
4. Within wheat, bread wheat vs. emmer wheat<br />
5. Within pulses, faba bean vs. field pea<br />
317
Crop rotation effects on grain yield and yield components ojbread wheat - Tilahun et al.<br />
Only those parameters with significant partitioned group were presented in the orthogonal<br />
contrast table.<br />
Using multiple linear correlation and regression model and step wise method parameters with<br />
significant partial coefficient of regression and better contribution to the variation of grain<br />
and straw yield, yield/spike and kernel m- 2 were selected and used in the model<br />
(Rangaswamy, 1995). <strong>The</strong> contribution. of each independent terms to the variations of<br />
dependent variables in the model was calculated as: % bi = (Pi 2 j IPi 2)* 100, where bi and Pi<br />
are sample regression coefficient and standard partial regression coefficient of each<br />
independent variables, respectively whereas i is the independent variable.<br />
RESULTS AND DISCUSSIONS<br />
Grain Yield<br />
<strong>The</strong>re was no significant effect of precursor crops on grain yield in all of the seasons.<br />
However, the partitioning of the main effect of precursors into single df as pulses vs. cereals<br />
and linseed indicated that wheat sown after pulses gave higher grain yield than after others in<br />
both bona 1996 and 1998 (Tables' 2 and 3). Pulses vs. others contributed about 47.2 and 66.1<br />
% of the total precursor sum of square in the respective years of bona season. <strong>Wheat</strong> grown<br />
after pulses had yield advantages of 243.5 kg/ha (7.4%) and 480 kg/ha (13 .3%) over wheat<br />
after cereals in 1996 and 1998 bona season, respectively. This implied that pulse precursor<br />
had more effect on grain yield in 1998 than 1996. This gradual and sustainable effects of crop<br />
rotation might be through supplying more nitrate in the soil after pulses (Amanuel et al.,<br />
1996). <strong>The</strong> benefit of pulses in this finding agrees with the findings of Tanner et al. (1991 &<br />
1998) and Mooleki and Siwale (1998). "<br />
Fertilizer rate had a significant effect on grain yield during bona 1998. This might indicate<br />
the reduction of soil fertility over time with the application of the lower fertilizer rate.<br />
Application of 41-46 N-P 2 0 S kg/ha gave a yield advantage of 558 kg (16%) over 9-23 N<br />
P 2 0 S kg/ha in 1998 (Tables 2 and 5).<br />
Kernels per unit area and 1000-kernel weight were strongly associated with grain yield per<br />
hectare (Table 6). Kernels per unit area contributed about 94.6% to the variation of grain<br />
yield, the most important yield component. <strong>The</strong> effect of precursor crops and fertilizer rates<br />
on different agronomic parameters played a significant role in the increment of grain yield<br />
per unit area.<br />
Yield Components<br />
Precursor crops had significant effects on spikes and kernels m- 2 in bona 1996 (Table 3).<br />
However, the partitioning of main effect of precursors into single df component of pulses vs.<br />
cereals & linseed affected kernels and spikes m- 2 during bona 1996 and 1998, and yield and<br />
kernel per spike during bona 1998. Linseed vs. cereal component had also significant effect<br />
on yield and kernels per spike during gena 1997 (Table 3). Pulses had higher effect than<br />
others on kernels and spikes m- 2 while both pulses and linseed had greater effect on yield and<br />
kernels per spike. <strong>The</strong> effect of linseed and pulses on kernels per spike of main crop was<br />
manifested on yield per spike as it was strongly correlated to yield per spike (Table 6).<br />
318
Crop rotation effects on grain yield and yield components ofbread wheat - Tilahun et af.<br />
Fertilizer application increased kernels and spikes m- 2 , yield and kernels per spike during<br />
bona 1998 (Table 5). Productive spikes per unit area and kernels per spike were strongly<br />
associated with kernels per unit area. Kernels per spike contributed about 80.4% to the<br />
variation ofkernels per unit area. <strong>The</strong> effect of precursors or fertilizer rate on kernels per unit<br />
area was due to their effect during tillering and kernel growth or both simultaneously.<br />
Kernels per spike played a significant role in the variation of both yield per spike and kernels<br />
per unit area.<br />
Straw Yield, Plant Height, and Harvest Index<br />
Precursor crops had no effect on straw yield, plant height and harvest index. However, the<br />
partitioned main effect of precursors into single df component of pulses vs. cereals & linseed<br />
showed that bread wheat grown after pulses gave higher straw yield than after other crops in<br />
bona 1996 and 1998 (Table 3). It contributed about 46.7 and 62.3% of the total sum of square<br />
of precursor during the respective years, which indicated the gradual advantage of pulse<br />
precursors in increasing the straw yield of the principal crop.<br />
Fertilizer rates had significant effects on straw yield and plant height during bona 1996 and<br />
1998 and on harvest index during 1996. <strong>The</strong> application of41-46 N-P20 Skg/ha gave higher<br />
straw yield and taller plants and lower harvest index than 9-23 N- P20S kg/ha (Table 5).<br />
Straw yield was linearly and positively associated with plant height (Table 6), which showed<br />
that the enhancement of plant height or vegetative growth might increase photosynthetic area<br />
and finally straw yield.<br />
If. general, pulses are the most beneficial break crops. <strong>The</strong> effect of both precursors and<br />
fertilizer rate on grain yield and yield components were observed gradually. <strong>The</strong>refore, longterm<br />
investigation of rotation effect under Sinana condition and extending the<br />
recommendation to the user is essential.<br />
ACKNOWLEDGMENTS<br />
<strong>The</strong> authors wish to acknowledge the researcher Mr. Genene Gezu, who reviewed and<br />
commented on each section of the paper, and technical as'sistants Messrs. Mengistu Bogale,<br />
Sefudin Mahadi and Bodena Alemayehu in all aspects of trial execution. <strong>The</strong> researchers also<br />
express their sincere gratitude to the Agricultural Development Bureau of the Oromya Region<br />
of Ethiopia and collaborative financial support of the wheat agronomy component of the<br />
CIMMYT/CIDA <strong>Eastern</strong> African Cereals Program.<br />
REFERENCES<br />
Amanuel Gorfu, Tanner, D.G., Kefyalew Girma, Asefa Taa, Duga Debele. 1996. Soil nitrate and compaction as<br />
affected by cropping sequence and fertilizer level in southeastern Ethiopia. In: <strong>The</strong> Ninth <strong>Regional</strong><br />
<strong>Wheat</strong> <strong>Workshop</strong> for <strong>Eastern</strong>. Central and Southern Africa. Tanner, D.G., Payne, T.S. and Abdalla,<br />
O.S., pp. 175-176. CIMMYT, Addis Ababa, Ethiopia.<br />
Bullock, D.G. 1992. Crop rotation. Critical Rev. Plant Soil. 11 :309-326.<br />
Mooleki, P. and J. Siwale. 1998. <strong>The</strong> impact of crop rotation on the grain yield of rainfed wheat in Northern<br />
Zambia. In: <strong>The</strong> Tenth <strong>Regional</strong> <strong>Wheat</strong> <strong>Workshop</strong> for <strong>Eastern</strong>. Central and Southern Africa. pp. 350<br />
356. ClMMYT, Addis Ababa, Ethiopia.<br />
Power, J.F. 1990. Legumes and crop rotation. p. 178. In: Sustainable Agriculture in Temperate Zones. CA.<br />
Francis, C.B. Flora. and L.D. King (eds.). Wiley, New York.<br />
Rangaswamy. 1995. A text book of agricultural statistics. New Age International Publisher limited. Wiley<br />
<strong>Eastern</strong>, New Dehili, Bangalow and London.<br />
319
Crop rotation effects on grain yield and yield components ofbread wheat - TiLahun et aL.<br />
Tanner, D.G., Amanuel Gorfu and Kassahun Zewdie. 1991. <strong>Wheat</strong> agronomy research in Ethiopia pp. 101. In:<br />
<strong>Wheat</strong> Research in Ethiopia: A historical perspective. Hailu Gebre Mariam, D.G. Tanner and Mengistu<br />
Hulluka (eds.). IARICIMMYT, Addis Ababa, Ethiopia.<br />
Tanner, D.G., H. Verkujil, Asefa Taa and Regassa Ensermu. 1998. An agronomic and economic analysis ofa<br />
long-term wheat based crop rotation trial in Ethiopia. In: <strong>The</strong> Tenth <strong>Regional</strong> <strong>Wheat</strong> <strong>Workshop</strong> for<br />
<strong>Eastern</strong>, Central and Southern Africa. pp. 213-248. CIMMYT, Addis Ababa, Ethiopia.<br />
Yates, F. 1954. <strong>The</strong> analysis of experiments consisting of different crops. Biometrics. 10:324.<br />
Table 1.<br />
Management practices for precursor crops.<br />
... Cr()p Variety See" r;lte. (kg/hal· Fedilizer rate (kg/ha) <br />
1 Bread wheat ET-13 150 9-23 and 41-46 <br />
2 Barley Aruso (local) 100 9-23 and 41-46 <br />
3 Emmer wheat Local 150 9-23 and 41-46 <br />
4 Faba bean CS-20DK 200 9-23 and 41-46 <br />
5 Field pea G-22763-2c 150 9-23 and 41-46 <br />
6 Linseed CI-1652 25 9-23 and 41-46 <br />
320
Crop rotation effects on grain yield andyield components ofbread wheat - Tilahun et al.<br />
Table 2.<br />
Analysis of grain yield of bread wheat after different precursor crops<br />
during gena 1997 and bona 1996 and 1998, Sinana.<br />
.Source ofvariation ..<br />
Precursor<br />
Pulses vs. others<br />
Others<br />
Fertilizer<br />
Precursor X fertilizer<br />
Error<br />
Precursor<br />
Pulses vs. others<br />
Others<br />
Fertilizer<br />
Precursor X fertilizer<br />
Error<br />
Precursor<br />
Pulses vs. others<br />
others<br />
Fertilizer<br />
Precursor X fertilizer<br />
Error<br />
~tf. MS<br />
Bona meher) 1996<br />
5 . 192870<br />
1 474372<br />
4 122494<br />
1 94219<br />
5 159463<br />
22 159463<br />
Gena (beI2) 1997<br />
145662<br />
312050<br />
1338753<br />
98073<br />
29339<br />
95879<br />
meher) 1998<br />
557424<br />
1843200<br />
235979<br />
2809976<br />
290787<br />
173974<br />
5<br />
1<br />
4<br />
1<br />
5<br />
22<br />
Bona<br />
5<br />
1<br />
4<br />
1<br />
5<br />
22<br />
F<br />
Pro.b •<br />
2.1 >1<br />
5.2
Crop rotation effects on grain yield and yield components ojbread wheat - Tilahun et al.<br />
Table 3.<br />
Orthogonal contrast for grain yield and other agronomic parameters of<br />
bread wheat following different precursor crops gena 1997 and bona,<br />
1996 and 1998, Sinana.<br />
" "<br />
'"<br />
' , ' . ';',i' - . '",<br />
, " ...-~ ~ ,,;" " " J,,;-jP';.trahtet~rs . "<br />
Source-.ilf;Yaria'thm ', ' :O-nai,n yield 'N~r*,~Js Spik~S : ;f9;~ Gnlinsh - HarvestYiefd/spike<br />
'(Rgilia), ' ,:" ' 11l: 2 (no;) " (no.) ;" &pik~ (no.)irtdex (%)' (g) "<br />
Bona (meher) 1996<br />
Precursor croQ.s sum square ns * * ns ns ns<br />
Pulses vs. cereals & linseed ns * * ns ns ns<br />
Others ns ns ns ns ns ns<br />
Fertilizer rates ns ns ns ns ns ns<br />
Precursor x fertilizer ns * ns ns ns ns<br />
Gena (belg) 1997<br />
Precursor crops sum square ns ns ns ns ns ns<br />
Pulses VS. cereals & linseed * ** ns ns ns ns<br />
Cereal vs. linseed ns ns ns * ns **<br />
Others ns ns ns ns ns ns<br />
Faba bean vs. field pea ns ns ** ns ns ns<br />
Fertilizer rates ns ns ns ns ns ns<br />
Precursor x fertilizer ns ns ns ns ns ns<br />
Bona (meher) 1998<br />
Precursor crops sum square ns ns ns ns ns ns<br />
Pulses VS. cereals & linseed *** *** ns * ns *<br />
Cereal VS. linseed ns ** ns ns ns ns<br />
<strong>Wheat</strong> vs. barley<br />
ns<br />
"<br />
* ns ns ns ns<br />
Others ns ns ns ns ns ns<br />
Fertilizer rates<br />
*** *** ns ** * *<br />
Precursor x fertilizer ns ns ns ns os ns<br />
322
Crop rotation efJects on grain yield and yield components ofbread wheat - Tilahun et al.<br />
Table 4.<br />
Effect of precursor crops on grain yield and other agronomic parameters<br />
of bread wheat, gena 1997 and bona 1996 and 1998, Sinana.<br />
Precursor<br />
crop<br />
Grain<br />
yield<br />
(k2lha)<br />
Kernels<br />
m- 2<br />
, (no~) ,<br />
1000<br />
KW<br />
(2)<br />
Spikes: Kernels<br />
m- 2 . !spik~<br />
(no.) ' ' (nQ.)<br />
Harvest<br />
'index<br />
,(%)<br />
Yield/<br />
,splke<br />
, .(g)<br />
Primt<br />
Ileiglit<br />
Jcrn)<br />
Straw yiel(l<br />
(kgJha)<br />
Bona meher) 1996<br />
<strong>Wheat</strong> 3265 9834 33 .23 337 29.65 30.00 0.983 117.13 7875<br />
Barley 3398 10822 31.43 308 35.36 29.50 1.110 117.40 9060<br />
Emmer wheat 3145 9651 32.59 282 34.61 29.72 1.126 117.30 7605<br />
Faba bean 3674 11409 32.23 315 37.5 26.08 1.280 116.17 10776<br />
Field pea 3359 10298 32.66 297 35.32 28.05 1.151 116.67 8694<br />
Linseed 3284 9759 33.62 304 33.33 28.19 1.250 116.57 8417<br />
Mean 3354 10296 32.63 307 34.29 28.26 1.170 116.87 8738<br />
LSDJO.05) ns ns ns ns ns ns ns ns ns<br />
C.V.(%) 9.24 9.67 4.21 17.8 21.98 10.52 22.19 2.64 21.54<br />
Gena (belg) 1997<br />
<strong>Wheat</strong> 4104 11583 35.43 345 23.35 31 .38 0.828 110.00 9039<br />
Barley 3990 11505 34.67 383 23.69 31.52 0.818 106.67 8736<br />
Emmer wheat 4220 11809 35.73 354 25.66 31.81 0.917 108.50 9089<br />
Faba bean 4386 12412 35.37 406 25.51 30.58 0.901 110.67 10019<br />
Field pea 4337 12271 35.37 340 24.87 31.10 0.880 110.00 9687<br />
Linseed 4341 12102 35.87 390 26.91 30.62 0.965 110.67 9969<br />
Mean 4230 11942 35.41 370 25.00 31.17 0.885 109.42 9423<br />
LSD(0.05) ns ns ns ns ns ns ns ns ns<br />
C.V.(%) 6.97 6.35 2.86 10.53 9.38 7.48 10.08 4.82 14.5<br />
Bona meher) 1998<br />
<strong>Wheat</strong> 3436 9240 37.20 616 29.99 28.20 1.117 8.55 8921<br />
Barley 3798 10239 37.17 612 31.69 31 .23 1.173 92.20 8392<br />
Emmer wheat 3388 9274 36.50 642 30.04 29.49 1.100 85.45 8040<br />
Faba bean 4159 11431 36.50 699 36.81 29.95 1.339 91.02 9746<br />
Field pea 4005 10820 37.10 653 33.45 29.91 1.239 90.65 9448<br />
Linseed 3786 10104 37.63 675 29.85 29.34 1.120 93.65 9119<br />
Mean 3762 10184 37.02 650 31.97 29.67 1.182 90.25 8944<br />
LSD(0.05) ns ns ns ns ns ns ns ns ns<br />
C.V.(%) 8.19 8.8 2.48 11.08 14.87 8.16 14.58 4.7 9<br />
323
Crop rotation effects on grain yield and yield components ofbread wheat - Tilahun et al.<br />
Table 5.<br />
Effect of fertilizer rates on grain yield and agronomic parameters of<br />
bread wheat gena 1997 and bona 1996 and 1998, Sin ana .<br />
,<br />
. Parainet~(s<br />
N-P:zOs .Grain 'K~(nels 1000 ";'Spikes Ker'rl'els · Harvest- Yh~ld " Plant S'traw<br />
rates 'yield m"2 KW .iit-2<br />
/spike 'index Ispike height yield<br />
(kgl~ha) (kg/ha) '(no.) (g) (no.) , (1).0.) (%) (g) (cm) I(kgtl1a)<br />
Bona (meher) 1996<br />
9-23 3303 10175 32,50 307 34.04 29.52 l.11 115.6 7995<br />
41-46 3405 10417 32.75 307 34.55 27.00 l.13 118.2 9480<br />
F-value 0.9 0.53 0.31 0.0005 0.04 6.45 0.08 6.4 5.6<br />
Prob. ns ns ns ns ns 0.03 ns 0.03 0.04<br />
Gena (belg) 1997<br />
9-23 4177 11812 35.40 363 25.24 31.55 0.89 108.9 9128<br />
41-46 4282 12082 35.42 377 24.76 30.80 0.88 109.9 9718<br />
F-value l.13 1.14 0.0097 1.19 0.38 0.96 0.33 0.36 1.7<br />
Prob. 0.3 0.3 ns 0.3 ns ns ns ns 0.22<br />
Bona (meher) 1998<br />
9-23 3483 9381 37.17 602 29.87 29,36 1.11 86.96 8374<br />
41-46 4041 10988 36.90 697 34.07 30.01 1.25 93.50 9514<br />
F-value 29.6 29 2.5 15.7 7.03 0.66 6.13 21.7 18.5<br />
Prob. 0.0002 0.0002 0.09 0.002 0.02 ns 0.03 0.0006 0.001<br />
Table 6.<br />
Regression and correlation coefficients of agronomic parameters of bread<br />
wheat grown following different crops gena 1997 and bona 1996 and 1998,<br />
Sinana.<br />
R2 .<br />
P·arameters . Model ' P N<br />
Straw yield (kglha) -22231 + 296.3 * plant height 0.48 0.008 12<br />
Yield/spike (g) -1.216 + 0.035 * 1000 KW + 0.035 * kernels/spike 0.999 0.000 12<br />
Kernels/m2 (no.) -6933 + 23.5 * productive tillers +297.8 * kernels/spike 0.977 0.000 12<br />
Grain yield (kg/ha) -3746 + 107 *1000 KW + 0.35 * kernels/m2 0.998 0.000 12<br />
324
IMPACT OF CROPPING SEQUENCE AND FERTILIZER APPLICATION <br />
ON KEY SOIL PARAMETERS <br />
AFTER THREE YEARS OF A CROP ROTATION TRIAL <br />
J. Kamwaga l , D.G. Tanne~, E.W. Nassiuma' and P. Bor l<br />
, .<br />
NPBRC-KARl, P.O. Njoro, Kenya <br />
2CIMMYT/CIDA <strong>Eastern</strong> Africa Cereals Program, P.O. Box 5689, Addis Ababa, Ethiopia <br />
ABSTRACT <br />
A rotation trial was established at Njoro, Kenya, in 1992 to assess the impact of <br />
16 cropping sequences and four fertilizer levels on crop productivity and soil <br />
parameters in a wheat-based cropping system. Soybean (Glycine max), rapeseed <br />
(Brassica napus) , potato (Solanum tuberosum) and maize (Zea mays) were <br />
grown in rotation with wheat (Triticum aestivum); the control treatment consisted <br />
of continuous wheat. Post-harvest soil samples were taken from three depths in <br />
1994 and analyzed for soil organic matter (SOM), pH, N03-N, and P. SOM was <br />
not influenced by cropping sequence. Applied N with or without P significantly <br />
increased SOM, while applied P with or without N significantly decreased SOM. <br />
Measurable P was not influenced by cropping sequence or by applied N, but was <br />
significantly increased by applied P. Soil N03-N was highly influenced by <br />
cropping sequence at all sampled depths, and by applied N at the top two depths. <br />
Crop rotations including potato exhibited higher levels of soil N03-N relative to <br />
continuous wheat. <strong>The</strong> other crop rotations did not apparently influence soil N03<br />
N level. Soil pH was neither influenced by cropping sequence or by applied N or <br />
P.<br />
INTRODUCTION<br />
<strong>The</strong> predominant cropping systems in the wheat growing" areas of Kenya invariably include<br />
wheat as the main crop, either grown continuously or rotated with other cereals or grass leys.<br />
Such cropping systems may lead to diminished soil fertility (Hargrove et al., 1983); other<br />
problems associated with continuous cereal production include the buildup of specific diseases,<br />
weeds and insect pests (Heenan et al., 1990). <strong>The</strong>se problems will in the long run translate into<br />
reduced yields and hence lower returns for the farmer. Also, the need to maintain soil organic<br />
matter (SOM) in any cropping system cannot be over-emphasized due to the myriad functions<br />
that SOM performs in enhancing the availability of nutrients to crops (Palm et al., 1997). <strong>For</strong><br />
sustainable crop production, rotation with legumes and other non-cereal crops has been identified<br />
as an effective method of maintaining soil fertility with minimal use of expensive mineral<br />
fertilizers (Asefa et ai., 1992). Furthermore, an optimal rotation system can break the disease,<br />
weed and insect pest cycles that are be associated with wheat monoculture, or other cropping<br />
systems dominated by cereals.<br />
To date, there has been little information generated regarding the long-term effects of crop<br />
rotation and ofcontinuous annual fertilizer application on key soil parameters in the wheat based<br />
cropping systems of Kenya. <strong>The</strong> objective of the current trial was to determine the effects of<br />
325
Impact ofcropping sequence and fertilizer application on soil parameters - Kamwaga et al.<br />
specific cropping sequences and constant fertilizer application rates on the relevant soil<br />
parameters affecting crop yields.<br />
MATERIALS AND METHODS<br />
A long-tenn crop rotation trial was established at the NPBRC (KARl), Njoro, Kenya in 1992 to<br />
assess the impact of sixteen specific cropping sequences and four constant nutrient application<br />
rates as main plots and sub-plots, respectively, on total crop productivity and the key soil<br />
parameters in a wheat-based cropping system. <strong>The</strong> experimental site is at an altitude of 2160 m<br />
a.s.l. on a soil classified as a well-drained mollic Andosol (FAO classification). <strong>The</strong> site receives<br />
an average annual precipitation of 930 mm with a mean monthly temperature of 14.5°C during<br />
the wheat cropping season.<br />
<strong>The</strong> experiment was laid out as an RCBD with split-plot assignment of treatments; cropping<br />
sequences were assigned to main plots (i.e., 6 x 18 m) and nutrient rates to sub-plots (i.e., 6 x 4.5<br />
m). Design considerations put forward by Cady (1991) were taken into account in the design of<br />
the crop rotations: the sixteen cropping sequences used (see below) consisted of five unique<br />
three-course rotations of wheat with soybean, rapeseed, potato and maize (i.e., balanced with<br />
years) and a continuous wheat treatment. Four nutrient rates (i.e., N:P20s at 0:0, 0:46, 60:0,<br />
60:46 kg ha- I ) were examined as constant annual applications within each cropping sequence.<br />
Urea and TSP (triple superphosphate) were the sources ofN and P20S, respectively.<br />
Croppi~gsequence<br />
Treatment 1992 1993 : 1994<br />
1 RP W W<br />
2 W W RP<br />
3 W RP W<br />
4 SOY W W<br />
5 W W SOY<br />
6 W SOY W<br />
7 POT W W<br />
8 W W POT<br />
9 W POT W<br />
10 MAZ W W<br />
11 W W MAZ<br />
12 W MAZ W<br />
13 MAZ POT W<br />
14 POT W MAZ<br />
15 W MAZ POT<br />
16 W W W<br />
RP = Rapeseed; SOY = Soybean; POT = potato; MAZ = Maize; W = <strong>Wheat</strong>.<br />
Subsequent to harvest of all crops sown in the 1994 season, soil samples were taken from the 0<br />
15, 15-30, and 30-60 cm depths of all sub-plots and analyzed for pH (in water), N0 3 (Bremner,<br />
1965), and soil P (Mehlich, 1958). Soil organic matter (Walkley and Black, 1947) was<br />
determined from the 0-5 cm depth. Data on these soil parameters form the basis ofthis paper.<br />
326
Impact of cropping sequence and f?rtilizer application on soil parameters - Kamwaga et al.<br />
RESULTS AND DISCUSSION<br />
<strong>The</strong> analysis of variance (ANOY A) of the main effects of crop rotation, N and P on key soil<br />
parameters at various depths (Table 1) revealed that SOM was not influenced by cropping<br />
sequence: all cropping sequences were equivalent to continuous wheat in terms of the level of<br />
SOM in the top S cm of the soil. <strong>The</strong> application offertilizer N, however, significantly (P
Impact ofcropping sequence and fertilizer application on soil parameters - Kamwaga et al.<br />
exhibited higher levels of N03-N than those that had potato one or two years prior to sampling<br />
(i.e., treatments 7, 9, 13 and 14). This indicates that the effect of potato on soil N03-N was<br />
greatest immediately post-harvest and declined over the three years of the experimental period.<br />
Overall, treatments including potato had higher levels of N03-N relative to continuous wheat.<br />
Interestingly, complex sequences (i.e., treatments 13 to 15) that had potato and maize in rotation<br />
with wheat exhibited higher levels ofN03-N compared to other sequences (i.e., treatments 10 to<br />
12) that had maize in rotation with wheat, suggesting a beneficial effect of potato in the rotation<br />
system.<br />
It is not apparent why potato - which is a high consumer of nutrients - would be such a good<br />
break crop for wheat. It could, however, be expected that potato residues, being relatively<br />
succulent, would decompose faster than other crop residues and thus would initially result in<br />
higher soil N03 levels relative to the other crops. <strong>The</strong> microbially-mediated decomposition<br />
process results in the simultaneous mineralization of soil organic-N and the immobilization of<br />
inorganic-N by the microbial population. Net mineralization occurs when the microbial<br />
population releases more N during decomposition than it can assimilate, while net<br />
immobilization occurs when the microorganisms assimilate more N than is being released from<br />
the decomposing OM. <strong>The</strong>se processes are affected by the C:N ratio of the decomposing material<br />
- mineralization occurs during the decomposition of material with a narrow C:N ratio and vice<br />
versa for immobilization (Jenkinson, 1971). Considering the N content of crop residues, soybean<br />
with 2.2% N would be expected to result in net mineralization on decomposition - relative to a<br />
suggested threshold level of 1.5% N at which immobilization and mineralization are in balance<br />
(Smith et al., 1982). <strong>Wheat</strong> and maize straw with 0.7 and 1.1 % N content, respectively, would be<br />
expected to immobilize N during decomposition. <strong>The</strong> N content for rapeseed and potato crop<br />
residues were not found in literature.<br />
It has also been reported that soil disturbance - as occurred during potato harvest - enhances<br />
the decomposition of crop residues due to increased exposure of the residues to microbial attack<br />
(Wall et al., 1994). <strong>The</strong>se authors indicated that soil disturbance tends to aerate the soil, leading<br />
to rapid oxidation of OM. This would be particularly relevant when disturbed soil is wetted by<br />
rain showers soon after harvesting the potato crop. Mean levels of N03-N after rotation with<br />
potato, soybean, maize and rapeseed follow in that order ofmagnitude. <strong>The</strong> fact that soybean did<br />
not have a bigger effect on soil N03-N may have been due to poor N fixation. Poor nodulation of<br />
soybean was observed during the trial period because the seed had either been improperly<br />
inoculated or the rhizobial inoculant applied had not been effective.<br />
Rapeseed was a poor break crop, resulting in a mean soil N03 level even lower than that of<br />
continuous wheat plots. Maize was apparently a better break crop than rapeseed although this<br />
had not been anticipated - due to the long time required for maize stover to decompose relative<br />
to residues from the other crop species. Among the treatments including rapeseed, soil N03 level<br />
was lowest where rapeseed had been produced in 1994. <strong>The</strong> same trend was apparent for<br />
treatments based on maize as the break crop. This suggests that these crops were big consumers<br />
of N, and that soil N03 gradually recovered during the second and third succeeding years <br />
when the plots were sown to wheat. This therefore indicates that these crops were not beneficial<br />
to the soil with respect to soil N supply. In contrast, the trend for soybean and potato was exactly<br />
the opposite. Soil N03 levels were highest immediately following these crops, but declined over<br />
time during the period of wheat production. This indicates a beneficial effect of these two crops<br />
on soil N levels vis-a-vis continuous wheat production.<br />
328
Impact ofcropping sequence and fertilizer application on soil parameters - Kamwaga et at.<br />
Cropping sequence by depth interaction means for soil N0 3 level reveal a significant general<br />
decline in N0 3 levels down the soil profile for all rotation sequences (Table 4). However, the<br />
decline from the first to second soil depths was more pronounced on plots with potato in the<br />
second phase (i.e., 7.8 ppm for treatment 9) and lowest on plots with soybean in the third phase<br />
(i.e., 2.1 ppm for treatment 5). Also, the differential effects of cropping sequences were more<br />
apparent in the observed change in soil N0 3 level from the second to the third depth; the decline<br />
in soil N0 3 levei across this interval was only significant for treatments 5, 8,15 and 16.<br />
In general, extractable P declined down the soil profile - an expected phenomenon due to P<br />
immobility (Table 5). However, a significant differential effect resulted from the relatively large<br />
decline in soil P level on plots that had potato in the second or third phase (i.e., treatments 8 and<br />
9) vs. the relatively low decline on plots that had rapeseed in the third phase (i.e., treatment 2).<br />
Also, the differential effects of cropping sequences were apparent in the observed change in P<br />
level from the second to the third soil depth; the decline in soil P level across this interval was<br />
only significant for treatments 6, 8, 9 and 14.<br />
<strong>The</strong>re was a general increase in pH down the soil profile (Table 6) that could be attributed to the<br />
use of acidifying fertilizers on this site and, thus, a reduction in the pH of the surface soil layer.<br />
Tanner et al. (1993) also reported that fertilizer N reduced pH in the surface soil layer after only<br />
one year of application in on-fann fertilizer trials. <strong>The</strong> significant interaction between rotation<br />
and depth may have been due to different magnitudes of decline for the various cropping<br />
sequences, but no discernible trend was apparent in the data.<br />
Annual application of 60 kg N ha- 1 increased soil N0 3 levels at all three soil depths relative to the<br />
nil rate (Table 7). This constant differential throughout the soil profile can be explained by the<br />
high mobility of N in soil. In contrast, annUal application of 46 kg P205 ha- I only increased<br />
extractable P in the upper (i.e., 0-15 cm) soil depth; this confinement of P to the upper layer is<br />
entirely due to the relative immobility ofP in the soil.<br />
<strong>The</strong> results of the current study demonstrated differential effects of cropping sequences on key<br />
soil parameters. Cropping sequence exhibited the most dramatic effect on soil N. <strong>The</strong> selection<br />
of crops to grow in rotation with wheat can have a significant effect on soil parameters. Some of<br />
the observations from the current trial could not be satisfactorily explained, and more work may<br />
be required to explain these results.<br />
ACKNOWLEDGMENTS<br />
This experiment was financially supported by the Kenyan Agricultural Research Institute<br />
(KARl) of Kenya in co-operation with the CIMMYT/CIDA <strong>Eastern</strong> Africa Cereals Program.<br />
<strong>The</strong> authors are grateful to the staff of the Kulumsa Research Center (EARO) of Ethiopia for<br />
their assistance in conducting the soil chemical analyses.<br />
REFERENCES<br />
Amanuel Gorfu, Tanner, D.G., Asefa Taa and Duga Debele. 1994. ObselVations on wheat and barley based cropping<br />
sequence trials conducted for eight years in southeastern Ethiopia. pp. 261-280. In: Tanner, D.G. (ed.).<br />
Developing Sustainable <strong>Wheat</strong> Production Systems. <strong>The</strong> Eighth <strong>Regional</strong> <strong>Wheat</strong> <strong>Workshop</strong> for <strong>Eastern</strong>,<br />
Central and Southern Africa. Addis Ababa, CIMMYT.<br />
Asefa Taa, Tanner, D.G. and Amanuel Gorfu. 1992. <strong>The</strong> effects oftillage practice on bread wheat in three different<br />
cropping sequences in Ethiopia. pp. 376-386. In: Tanner, D.G. and Mwangi, W. (eds.). <strong>The</strong> Seventh<br />
<strong>Regional</strong> <strong>Wheat</strong> <strong>Workshop</strong> for <strong>Eastern</strong>, Central and Southern Africa. Nakuru, Kenya, CIMMYT.<br />
329
Impact ofcropping sequence and fertilizer application on soil parameters - Kamwaga et at.<br />
Bremner, J.M. 1965. Inorganic forms of nitrogen. pp. 1179-1237. In: Black, e.A., Evans, D.o., White, J.L.,<br />
Ensminger, L.E. and Clark, F.E. (eds.). Methods ofSoil Analysis. Part 2. Chemical and Microbiological<br />
Properties. ASA, Madison, Wisc.<br />
Cady, F.B. 1991. Experimental design and data management of rotation experiments. Agronomy Journal. 83: 20-56.<br />
Hargrove, W.L., Touchton, J.T. and Johnson, J.W. 1983. Previous crop influence on fertilizer nitrogen<br />
requirements for double-cropped wheat. Agronomy 10urna175: 855-859.<br />
Heenan, D.P., Taylor, Ae. and Leys, AR. 1990. <strong>The</strong> influence of tillage, stubble management and crop rotation on<br />
the persistence of great brome (Bromus diandrus Roth). Australian Journal ofExperimental Agriculture 30:<br />
227-230.<br />
Jenkinson, D.S. 1971. Studies on the decomposition of 14-C labeled organic matter in soil. Soil Science Ill: 64-70.<br />
MehIich, A. 1958. Soil Test Methods. Annual Report. Senior Soil Chemist, Nairobi.<br />
Nassiuma, W.E., Bor, P. and Tanner, D.G. 1996. Effect ofcrop rotation on wheat yields in Kenya. pp. 195-196. In:<br />
Tanner, D.G., Payne, T.S. and Abdalla, O.S. (eds.). <strong>The</strong> Ninth <strong>Regional</strong>'<strong>Wheat</strong> <strong>Workshop</strong> for <strong>Eastern</strong>,<br />
Central and Southern Africa. Addis Ababa, CIMMYT.<br />
Palm, e.A, Myers, J.K.R. and Nandwa, S.M. 1997. Combined use oforganic and inorganic nutrient sources for soil<br />
fertility maintenance and replenishment. In: Replenishing Soil Fertility in Africa. SSSA Special Publication<br />
No. 51. ASA and SSSA, Madison, Wisc.<br />
Smith, J.H. and Peterson, J.R. 1982. Recycling nitrogen through application ofagricultural, food processing and<br />
municipal wastes. pp. 791-796. In: Nitrogen in Agricultural Soils. Amer. Soc. Agron., Crop Sci. Soc. Amer.<br />
and Soil Sci. Soc. Amer. Special Publication No. 22. ASA, CSSA and SSSA, Madison, Wisc.<br />
Tanner, D.G., Amanuel Gorfu and Asefa Taa. 1993. Fertiliser effects on sustainability in the wheat-based smallholder<br />
fanning systems of Ethiopia. Field Crops Research 33: 235-248.<br />
Walkley, A and Black, LA. 1947. Determination oforganic matter in the soil by chromic acid digestion. Soil Science<br />
63: 251-264.<br />
Wall, P.e. and Causarano, H. 1994. <strong>The</strong> reversal ofsoil degradation in the wheat-soybean cropping system of the<br />
southern cone of South America. pp. 208-220. In: Tanner, D.G. (ed.). Developing Sustainable <strong>Wheat</strong><br />
Production Systems. <strong>The</strong> Eighth <strong>Regional</strong> <strong>Wheat</strong> <strong>Workshop</strong> for <strong>Eastern</strong>, Central and Southern Africa.<br />
Addis Ababa, CIMMYT.<br />
330
Impact ofcropping sequence and fertilizer application on soil parameters - Kamwaga et al.<br />
Table 1. Results of the ANOV A of the effects of rotation (R), nitrogen (N), and phosphorous (P) on key soil chemical parameters<br />
measured post-harvest 1994 at several depth intervals (cm) at Njoro, Kenya.<br />
Parameters a<br />
OM P N03 pH<br />
Factor 0-5 0-15 15~30 30-60 0-15 15-30 30-60 0-15 15;'30 30':60<br />
R NS NS NS NS *** ** ** NS NS NS<br />
N *** NS NS NS *** * NS NS NS NS<br />
RxN NS NS NS NS NS NS NS NS NS NS<br />
P * *** NS NS NS NS NS NS NS NS<br />
RxP NS NS NS NS NS NS NS NS NS NS<br />
NxP NS NS NS NS NS NS NS NS NS *<br />
RxNxP NS NS NS NS NS NS NS NS NS NS<br />
,<br />
C.V.(%) 10.8 10.3 16.5 15.1 7.1 12.6 14.2 1.7 1.9 1.9<br />
Mean 3.62 I 29.0 22.2 19.8 30.1 25.6 24.3 6.17 6.25 6.35<br />
*, **, ***: Significant at the 5, 1 and 0.1 % level, respectively.<br />
NS: Not significant. .<br />
aOM = Soil organic matter (%); P = Soil P (ppm); N03 = Soil N03 (ppm); pH = Soil pH.<br />
331
Impact ofcropping sequence and fertilizer application on soil parameters - Kamwaga et al.<br />
Table 2. Results of the ANOVA of the effects of rotation (R), nitrogen (N), and phosphorous (P) combined across soil depths (D) on key<br />
soil chemical parameters measured post-harvest 1994 at Njoro, Kenya.<br />
,=..<br />
, ', .<br />
NOj P ·.'pH'<br />
d.f. F Prob. F . Prot>. F - Prob.<br />
Rotation (R) 15 4.52 *** 0.41 NS 0.56 NS<br />
Nitrogen (N) 1 49.01 *** 0.05 NS 0.04 NS<br />
RxN 15 0.85 NS 1.73 NS 1.04 NS<br />
Phosphorous (P) 1 0.01 NS 25.21 *** 0.04 NS<br />
RxP 15 0.62 NS 0.95 NS 1.11 NS<br />
NxP 1 0.00 NS 0.27 NS 2.17 NS<br />
RxNxP 15 0.56 NS 0.81 NS 1.62 NS<br />
Depth (D) 2 264.1 *** 239.60 *** 176.38 ***<br />
RxD 30 1.57 * 1.67 * 1.80 ***<br />
NxD 2 36.60 *** , 0.33 NS 0.25 NS<br />
RxNxD 30 1.12 NS 0.33 NS 1.03 NS<br />
PxD 2 0.03 NS 17.03 *** 0.15 NS<br />
RxPxD 30 0.92 NS 0:67 NS 0.78 NS<br />
NxPxD 2 3.77 NS 0.04 NS 1.31 NS<br />
RxNxPxD 30 1.00 NS 0.52 NS 0.75 NS<br />
Mean 26.7 23.64 6.3<br />
C.V.(%) 9.82 18.07 1.45<br />
*, ***: Significant at the 5 and 0.1 % level, respectively.<br />
NS: Not significant.<br />
a N03 = Soil N03(ppm); P = Soil P (ppm); pH = Soil pH.<br />
332 <br />
Impact ofcropping sequence and fertilizer application on soil parameters - Kamwaga et al.<br />
Table 3. Soil organic matter (OM), P, N03 and pH as influenced by cropping sequence measured post-harvest 1994 at Njoro, Kenya.<br />
Crop rotation Parameter<br />
Treatment 1992 1993 1994 OM P N03 pH<br />
(%) (ppm) . (ppm)<br />
1 RP W W 3.86 23.3 25.9 defg 6.2<br />
2 W W RP 3.46 23.9 23.0 g 6.2<br />
3 W RP W 3.37 24.2 24.2 fg 6.3<br />
4 SOY W W 3.88 23.4 25.2 defg 6.2<br />
5 W W SOY 3.92 21.8 27.0 edef 6.2<br />
6 W SOY W 3.91 25.6 26.5 edef 6.4<br />
7 POT W W 3.56 26.7 27.7 bed 6.4<br />
8 W W POT 3.12 26.3 31.6 a 6.3<br />
9 W POT W 3.18 23.4 26.6 edef 6.3<br />
10 MAZ W W 3.23 21.8 26.2 edef 6.3<br />
11 W W MAZ 4.08 21.7 24.4 fg 6.2<br />
12 W MAZ W 3.55 22.8 26.7 edef 6.3<br />
13 MAZ POT W 3.71 22.7 29.3 abc 6.2<br />
14 POT W MAZ 3.57 22.3 27.6 bede 6.3<br />
15 W MAZ POT 3.83 25.0 30.3 ab 6.2<br />
16 W W W 3.74 23.4 24.5 efg 6.3<br />
Grand mean --- -<br />
3.62 23.6 26.7 6.3<br />
LSD(0.05) NS NS 3.12 NS<br />
C.V.(%) 10.8 18.0 9.8 1.45<br />
Within a column, values followed by the same letter(s) are not significantly different at the 5% level of the LSD test.<br />
RP = Rapeseed; SOY = Soybean; POT = potato; MAZ = Maize; W = <strong>Wheat</strong>.<br />
333
Impact ofcropping sequence and fertilizer application on soil parameters - Kamwaga et at.<br />
Table 4. Soil N03 (ppm) as affected by rotation and depth of sampling.<br />
Depth· Rotation sequence<br />
(cm) 1 2 . 3 4 5 6 7 8 9 10 11 12 13 14 . 15 16. Mea~:<br />
0-IS 29.1a 26.7a 27.9a 28.7a 29.2a 29.8a 31.0a 36.2a 32.4a 29.3a 27.0a 29.4a 32.8a 30.9a 34.0a 27.7a 30.1A<br />
IS-30 24.6b 21.7b 22.8b 24.0b 27.1b 2S.7b 2S.4b 31.3b 24.6b 24.9b 23.Sb 2S.8b 28.2b 26.1b 29.6b 24.4b 2S.6B<br />
30-60 24.1b 20.Sb 21.8b 22.9b 24.7c 24.1b 26.7b 27.2c 22.8b 24.4b 22.7b 2S.0b 26.9b 26.0b 27.4c 21.4c 24.3C<br />
LSD(O.OS) 2.11 0.S3 I<br />
--- --- -<br />
Within each column, values followed by the same letter are not significantly different at the S% level of the LSD test.<br />
Table 5. Soil P (ppm) as affected by rotation and depth of sampling .<br />
. . "<br />
, .... ,<br />
'.'<br />
DeJ.!th RQtation sequence .<br />
.- ..;.'<br />
, (em) . ~.' : 1 2., ·' .,3 4 ' 5 ' .6 7 8 9 10 11 12 . .13 14 . 15- 16. ',' ;:Mea~:.<br />
0-lS 28.0a 27.3a 28.0a 27.8a 29.0a 31.2a 31.7a 32.~a 30.7a 26.8a 26.9a 2S.7a 28.7a 29.8a 31.0a 28.3a 29.0A<br />
IS-30 21.4b 23 .2b 23.3b 21.3b 19.8b 2S.1b 2S.1b 26.9b 21.8b 20.7b 19.3b 21.3b 20.9b 21.1b 22.6b 21.8b 22.2B<br />
30-60 20.4b 21.3b 21.3b 21.3b 16.6b 20.7c 23.3b 19.1c 17.7c 18.0b 18.8b 21.Sb 18.Sb 16.0c 21.8b 20.3b 19.8C I<br />
LSD(O.OS) 3.43 0.8s91<br />
---- - -<br />
Within each column, values followed by the same letter are not significantly different at the S% level of the LSD test.<br />
Table 6. Soil pH as affected by rotation and depth of sampling.<br />
~Depth Rotation sequence . !<br />
. (cm) :. . '. 1 ; :'2 3: 4 5 6 7 8 9 lO ' 11 ' 12: 13 . 14 . 15 16 .<br />
. . : .... ;Meai{1<br />
0-lS 6.06c 6.11c 6.17c 6.18b 6.18b 6.26c 6.29c 6.26b 6.23c 6.18b 6.08c 6.19b 6.07c 6.24a 6.08b 6.19b 6.17C<br />
lS-30 6.13b 6.24b 6.30b 6.23ab 6.13b 6.38b 6.38b 6.28b 6.32b 6.24b 6.18b 6.29a 6.19b 6.2Sa 6.12b 6.2Sb 6.2SB<br />
30-60 6.29a 6.34a 6.40a 6.27a 6.28a 6.49a 6.47a 6.36a 6.4Sa 6.33a 6.30a 6.36a 6.31a 6.29a 6.2Sa 6.34a 6.3SA<br />
LSD(O.OS) 0.072 0.0181<br />
--<br />
Within each column, values followed by the same letter are not significantly different at the S% level of the LSD test.<br />
334<br />
.,<br />
"
Impact ofcropping sequence andfertilizer application on soil parameters - Kamwaga et al.<br />
Table 7. Nitrogen rate by depth interaction effects on soil N0 3 •<br />
N rate ~epth<br />
' .<br />
···.'SoirN03. <br />
. (kg ha- 1 ) (cin) (ppm) <br />
0 0-15 27.8 b <br />
15-30 25.1 d <br />
30-60 23.9 e <br />
60 0-15 32.6 a <br />
15-30 26.1 c <br />
30-60 24.7 d <br />
LSD(0.05) 0.75<br />
Mean 26.7<br />
Values followed by the same letter are not significantly different at the 5% level ofthe LSD test.<br />
Table 8. Phosphorous rate by depth interaction effects on soil P.<br />
PiOs rate. Depth Soil P<br />
Jkg ha- 1 ) (cm) - (ppm)<br />
0 0-15 26.7b <br />
15-30 22.2 c <br />
30-60 19.7 d <br />
46 0-15 31.2 a <br />
15-30 22.2 c <br />
30-60 19.8 d <br />
LSD(0.05) 1.21<br />
Mean 23.6<br />
Values followed by the same letter are not significantly different at the 5% level ofthe LSD test.<br />
335
THE INTRODUCTION OF DISEASE AND PEST RESISTANT <br />
WHEAT CULTIV ARS TO SMALL-SCALE FARMING SYSTEMS <br />
IN THE HIGHLANDS OF LESOTHO <br />
John Tolmayi, M.L. Rbsenblum 2 , M. Moletsane 2 , M. Makula 2 and T. Pederson 2<br />
IARC-Small Grain Institute, Private bag X29, Bethlehem, 9700, South Africa<br />
2GROW, P.O. Box 74, Mokhotlong, 500, Lesotho<br />
ABSTRACT<br />
Summer wheat is one of the major crops planted by farmers in the highlands<br />
of Lesotho. <strong>The</strong> crop is used by subsistence farmers for food, roofing material,<br />
fuel and seed. Currently, farmers are using "farmer varieties" dating back to<br />
the early 1960s and 80s. No adoption of new cultivars with modern traits such<br />
as Russian wheat aphid or yellow rust resistance has taken place in the area. A<br />
partnership was forged between the ARC-Small Grain Institute and GROW, a<br />
development agency operating in the Mokhotlong Valley, to introduce and<br />
evaluate new varieties utilizing nurseries of the agency's Seeds of Wellbeing<br />
project. New cultivars look promising in terms of yield increase, but they have<br />
not yet been sufficiently evaluated with regards to stability and adaptation to<br />
the environment. Suitability of new cultivars to farmers' needs will be<br />
determined through farmer participation in the trials and by testing selected<br />
cultivars in farmers' own field plots: It is foreseen that research capacity in the<br />
area and the linkages between research, the development agency and farmers<br />
in the field, will be strengthened as a result of this partnership.<br />
INTRODUCTION<br />
Summer wheat is one of the major crops planted by farmers in the Highlands of Lesotho. <strong>The</strong><br />
crop provides food, roofing material, fuel and seed to subsistence farming households<br />
(Collinson, 1989; Rosenblum, Ts'iu and Moletsane, 1999) who grow the crop at elevations of<br />
2100-2300 m. <strong>The</strong> crop is typically established with carryover seed from the previous season<br />
soon after the onset of the spring rains. According to Rosenblum et al. (1999), varieties used<br />
by farmers are not pure and can be divided into six different types or "farmer varieties".<br />
Though mixing of varieties may be purely accidental, genetic variation within the local wheat<br />
populations could contribute to sustainability of production by reducing risks of specific<br />
threats to overall harvest (Worede and Mekbib, 1993 as quoted by Rosenblum et al. (1999».<br />
<strong>The</strong> same authors point out that modern high yielding genotypes rarely outperform farmers'<br />
traditional varieties and they quote Majoro and Holland (1986) who stated that this had been<br />
the case in Mokhotlong as modern varieties released there in the past had not significantly<br />
increased yields.<br />
According to a survey performed by Rosenblum et at. (1999), farmers described the three<br />
wheat varieties most commonly used as Bolane, Mants' a 17ala and Mohohlotsane. Bolane is<br />
a tall variety that was included in cultivar trials in Maseru during the sixties (Weinmann,<br />
1966). As a variety it did not show much potential for yield and was consistently<br />
outperformed by other cultivars during that time. It has a low tillering capacity and prominent<br />
336
Introduction ofdisease and pest re~istant wheat cu/tivars to Lesotho - To/may et al.<br />
awns with long spikes. <strong>The</strong> variety is used for baking bread and the tall straw is ideally suited<br />
for roofing.<br />
<strong>The</strong> variety named Mants' a Tlala was released as Tugela in South Africa in 1985 and<br />
promoted in Lesotho afterwards. <strong>The</strong> variety has an intennediate canopy with high tillering<br />
capacity. It has brown seeds and is considered to have "heavy flour" for baking bread. This<br />
observation by fanners is consistent with the well-known fact that the cultivar Tugela has a<br />
longer than average mixing time. Although not verified on-site, the cultivar should also have<br />
genetic resistance to current strains of yellow (stripe) rust (Puccinia striiformis Westend. F.<br />
sp. trifici Eriks.).<br />
Mohohlotsane is an awnless variety of medium canopy height and unknown origin. It has<br />
very dense spikes and the grain is easily threshed from the spikelets, making it very prone to<br />
bird damage. <strong>The</strong> grain is sweet and used with peas to make a local dish. It is also milled into<br />
rough textured flour for baking bread.<br />
Fanners also plant a durum variety Telo Nts'o (Triticum durum) on a small scale. This<br />
variety has distinctive black spikes with prominent awns. <strong>The</strong> tall straw is very suitable for<br />
thatching, but fanners found the seed hard to mill in the past. Acceptance of the variety was<br />
low because of this. However, a survey to characterize and recover traditional varieties has<br />
sparked renewed interest in Telo Nts'o, especially as one community now has access to a<br />
mechanized mill.<br />
None of the "fanner varieties" were tested for Russian wheat aphid (RW A) resistance, but<br />
visual observations indicated that none of them has resistance to the aphid. Due to the high<br />
rainfall and low temperature regime in . the Mokhotiong Valley, Russian wheat aphid<br />
(Diuraphis noxia) is a sporadic pest in the area. It can however be devastating if high<br />
infestation levels occur during drought periods at sensitive growth stages. Heavy infestations<br />
of other aphid species such as the Oat aphid (Rhopalosiphum padi) are frequently observed.<br />
None of the "fanner varieties" except "Jants' a Tlala (Tugela) are considered to be resistant<br />
against current strains of yellow rust, which were first reported in Southern Africa in 1997<br />
(Boshoff, Van Niekerk and Pretorius, 1999).<br />
An improved version of Tugela with resistance to RWA was officially released by the ARC<br />
Small Grain Institute in 1994 with the name Tugela-DN (TUG*4/GANDUM I FASAI). This<br />
cuItivar was provided to Lesotho under the name Puseletso during 1992 (Moremoholo and<br />
Purchase, 1999). It is considered to have excellent agronomic attributes such as high yields<br />
and resistance to both acid soils and yellow rust. Having more than 90% of the original<br />
cultivars genetic makeup, it could easily replace its predecessor Mants' a Tlala (Tugela).<br />
Unfortunately, it was still unknown to fanners in the Lesotho Highlands in 1999.<br />
<strong>The</strong> conservation and further improvement of locally adapted, useful and reliable genetic<br />
resources should not be compromised by introducing modern high yielding cuItivars into<br />
environments to which they are not suited. Such interventions could have disastrous<br />
consequences for the small-scale resource poor fanners that rely on the crop as the main<br />
source of food. Pest and disease resistant cultivars do however offer fanners protection<br />
against major crop losses caused by newly introduced pests and diseases, previously<br />
unknown in the area such as yellow rust. All new technological interventions should be<br />
economically viable, environmentally sound, socially acceptable and politically supportable<br />
337
Introduction ofdisease and pest resistant wheat cu/tivars to Lesotho - To/may et al.<br />
(Reeves, 1999). <strong>For</strong> this reason, new cultivars should be introduced with caution without<br />
being prescriptive, and with full participation of fanners in the process.<br />
MATERIALS AND METHODS<br />
<strong>The</strong> need to check the usefulness of cultivars with resistance to Russian <strong>Wheat</strong> Aphid and<br />
yellow rust in the Mokhotlong Valley lead to a partnership between the ARC-Small Grain<br />
Institute and GROW a locally based Non-Governmental Organization. <strong>For</strong> this purpose, the<br />
development approach and nurseries of GROW were used as part of their "Seeds of Well<br />
being Project (SOW).<br />
As a first step, the new cultivars were planted in a nursery situated at Makoabateng within the<br />
Mokhotlong Valley with full participation of farmers. Here farmers work with, and get to<br />
know the material. After one or two research cycles, participating farmers can select cultivars<br />
they wish to include in their own on-farm experimental plots. During this stage, not only the<br />
agronomic traits such as yield and stability are evaluated, but also other criteria such as the<br />
usefulness of the straw for roofing and fuel as well as cooking and baking characteristics.<br />
During the 1999/2000 season, farmers' wheat varieties and new cultivars were included in<br />
tmreplicated plots in the Makoabateng nursery (Mokhotlong Valley). <strong>The</strong> altitude of the trial<br />
site is 2440 m. To simulate farmers' conditions, no external inputs such as fertilizers,<br />
pesticides or seed treatments were used. Two planting dates namely 8 October 1999 (early<br />
planting) and 23 November 1999 (late planting) were used. <strong>The</strong> later planting took place later<br />
than usual due to drought conditions prevalent at that time. <strong>The</strong> "farmers varieties" Bolane,<br />
Mants' a Tlala and Telo Nts'o were retained and the following new cultivars were included<br />
in the nursery:<br />
• Puseletso - a RW A Resistant version of Mants' a Tlala. Also has resistance against<br />
yellow rust and acid soils.<br />
• SST 333 - a fast growing RWA resistant cultivar similar to SST 124, suitable for late<br />
planting dates.<br />
• Elands a newly released cultivar with high yield potential and good RW A resistance. It<br />
was included to see if it's genetic potential could be realized under the environmental<br />
conditions in the area.<br />
RESULTS<br />
Good yields were obtained with the early planting of the crop (Table 1). As could be<br />
expected, 'SST 333' a cultivar with a short growth period, was the only cultivar that<br />
performed well when planted late in the season. Puseletso yielded well at the earlier planting<br />
date; Tugela and Puseletso yielded similarly at the later planting date. <strong>The</strong> data indicate that<br />
substantial improvement with regards to yield can be made with new varieties like Elands and<br />
SST 333 due to higher yield potential of such cultivars. Telo Nts' 0 the durum variety with tall<br />
straw, did not reach the yield level of the wheat cultivars, but it must be kept in mind that<br />
farmers plant it for dual purposes; as a source of food and for roofing.<br />
DISCUSSION AND CONCLUSION<br />
Inclusion of new culti vars in the Makoabateng nursery has indicated that there is potential for<br />
substantial wheat yield increase in the Mokhotlong Valley. <strong>The</strong> adaptability and stability of<br />
338
Introduction ofdisease and pest resistant wheat cultivars to Lesotho - Tolmay et al.<br />
these new cultivars to the particular environment could not be concluded due to insufficient<br />
data. Furthermore, farmers have not yet had the opportunity to evaluate the suitability of the<br />
new cultivars regarding purposes for which the crop is planted. It is therefore recommended<br />
that the evaluation of new useful cultivars be continued following this participatory on-farm<br />
approach. This can be achieved by strengthening both farmers' research capacities and the<br />
linkages between them, research agencies, and development organizations. Such an approach<br />
will aid the conservation of valuable locally adapted genetic resources and help farmers<br />
improve their position by I) gaining access to genetic resources that provide solutions for<br />
new threats and 2) expand their capacity to evaluate new cultivars and farming techniques.<br />
REFERENCES<br />
Boshoff, van Niekerk and Pretorius. 1999. Stripe rust: A new threat to wheat production in South Africa. In:<br />
Payne, T.S., D.G. Tanner, W. Mwangi, G. Varughese and H. van Niekerk, eds. Proceedings ofthe<br />
Tenth <strong>Regional</strong> <strong>Workshop</strong> for <strong>Eastern</strong>, Central and Southern Africa. 14-18 September 1998,<br />
Stellenbosch, South Africa.<br />
Collinson, M.P. 1989. Small farmers and technology in <strong>Eastern</strong> and Southern Africa. Journal ofInternational<br />
Development: 1:66-82.<br />
Moremoholo, L. and Purchase, 1.L. 1999. <strong>The</strong> release of Puseletso, a Russian wheat aphid (Diuraphis noxia)<br />
resistant cultivar in Lesotho. In: Proceedings ofthe Tenth <strong>Regional</strong> <strong>Workshop</strong> for <strong>Eastern</strong>, Central and<br />
Southern Africa. 14-18 September 1998, Stellenbosch, South Africa.<br />
Reeves, T.R. 1999. Sustainable intensification of agriculture. In: Sustainable Agricultural Solutions; the action<br />
report of the sustainable agriculture initiative. Ed: A.1. Fairclough, Novello Press Ltd., London.<br />
Rosenblum, M.L., Ts'iu, 1. and Moletsane, M., 1999. Farmer wheat (Triticum aestivum) varieties in the<br />
highlands of Lesotho. In: Participation and partnerships in extension and rural development.<br />
Proceedings of the 33 rd Annual Conference of the Society for Agricultural Extension, 11-13 May 1999,<br />
Bloemfontein, South Africa.<br />
Weinmann, H., 1966. Report on crop research in Lesotho 1960-1965. Ministry of Agriculture, Co-operatives<br />
and Marketing, Lesotho. Maseru, Lesotho.<br />
Questions and Answers:<br />
Colin Wellings: (1) I presume Tugela and Tugela-DN are closely related; (2) Have these<br />
cultivars been affected by the Hugenoot pathotype of yellow rust? (3) Comment: It will be<br />
important to monitor rust pathotypes in these highland summer cereal cropping locations.<br />
Perhaps trap nurseries could be considered for this.<br />
Answer: (1) Tugela and Tugela-DN are near isogenic lines differing only in RWA resistance;<br />
(2) <strong>The</strong> Tugela types are as yet not infected by the YR pathotypes present in Lesotho and<br />
RSA; (3) Due to the high altitude and weather conditions (ofthe site), it is an ideal location<br />
for rust traps - no fungicides are used in the area, allowing for natural epidemic development.<br />
Ravi P. Singh: <strong>The</strong> environment of Lesotho is completely different from South Africa, so are<br />
you planning to evaluate genotypes adapted to highlands that are similar to the Lesotho<br />
environment?<br />
Answer: Yes. Collaboration with international breeders to evaluate suitable entries is needed<br />
to improve the chances of finding successful introductions. Agreements among local<br />
stakeholders need to be reached on all interventions.<br />
339
Introduction ofdisease and pest resistant wheat cultivars to Lesotho - Tolmay et al.<br />
Ravi P. Singh: It will be better not to grow one of the main South African cultivars in the<br />
Lesotho highlands to avoid the evolution of a new race that can cause a problem in South<br />
Africa.<br />
Answer: Yes, we agree. Better adapted and more suitable lines to introduce are being sought.<br />
Table 1.<br />
Yield (t/ha) of six wheat cultivars, at two planting dates in Makoabateng,<br />
Lesotho.<br />
Yield (tlha)<br />
Cultivar<br />
Early planting<br />
····L~te planting<br />
. . "",. .'<br />
8 October 1999 23 Noveiriber 1999<br />
Elands 3.93 3.50<br />
SST 333 3.60 4.00<br />
Puseletso 3.75 2.45<br />
Tugela - 2.40<br />
Bolane - 3.00<br />
Telo Nts'o - 2.60<br />
340
REDUCING MECHANICAL HARVESTING LOSSES OF WHEAT <br />
UNDER LARGE-SCALE PRODUCTION IN THE GEZIRA SCHEME, SUDAN <br />
Mamoun I. Dawelbeit<br />
Agricultural Engineering Research Program, Agricultural Research Corporation (ARC),<br />
P.O. Box 126, Wad Medani, Sudan<br />
ABSTRACT<br />
About 168,000 ha in the Gezira Scheme are sown annually to wheat (Triticum<br />
aestivum L.). <strong>Wheat</strong> production is fully mechanized, and harvesting usually<br />
occurs during March and April. About 300 combine harvesters are involved in<br />
wheat harvesting, and almost all of these machines are privately owned. <strong>The</strong> most<br />
common type is the self-propelled combine harvester equipped with a 4.5 m wide<br />
grain header. One of the most serious problems of using combine harvesters is<br />
the high harvesting losses: an estimated 18-20% of the produced crop is lost<br />
during harvesting. This high harvest loss costs the farmer, the scheme<br />
management, and the country. <strong>The</strong> objectives of this research project were to<br />
investigate causal factors affecting wheat harvest losses in the Gezira, to<br />
quantify these losses, and to propose a plan to minimize such losses. Research<br />
was conducted at the Gezira Research Station at Wad Medani for two seasons<br />
(1991/92-1992/93) to estimate the effect of time of harvesting on wheat<br />
harvesting losses. Also, a project to reduce wheat harvest losses was started in<br />
1993/94, involving four approaches: the first approach targeted farmers and<br />
involved extension, educational and media activities; the second approach<br />
targeted combine operators; the third approach involved regulatory activities;<br />
the fourth approach included field surveys to estimate actual harvest losses<br />
and to detect of losses sources. <strong>The</strong> project ideas and efforts were highly<br />
accepted by the Gezira Scheme Management and the farmers, and adoption rates<br />
were very high. Results of the technical surveys showed excellent progress in<br />
reducing wheat harvest losses. Before the project, losses were estimated to be<br />
about 20%. Survey results showed the majority of these losses were due to<br />
machinery operational factors and management of the combine harvesters. <strong>The</strong><br />
total decrease in harvesting losses in the first three seasons was about 13.2%<br />
equal to about 96,100 t of wheat. <strong>The</strong> value of the amount of wheat saved could<br />
be estimated to be about 38.4 billion Sudanese pounds or about US$25.6 million.<br />
INTRODUCTION<br />
<strong>The</strong> Gezira Scheme is one of the largest agricultural projects in the world under one<br />
management. With a total area of about 800 thousand hectares, this scheme is divided into 18<br />
administrative groups. <strong>The</strong> scheme is located in central Sudan between the Blue Nile and the<br />
White Nile. <strong>The</strong> irrigation systems cover all the cultivated area in a hierarchical manner. Water is<br />
delivered from Sennar Dam on the Blue Nile to main canals, major canals, minor canals and ends<br />
in field ditches. Gezira Scheme is divided administratively into 18 groups and 112 blocks. <strong>The</strong><br />
scheme follows a five-course rotation. <strong>The</strong>re are about 114 thousand tenants each with a holding<br />
341
Reducing mechanical harvesting losses ofwheat - Dawelbeit<br />
ranging from 6.3 to 8.4 hectares.<br />
<strong>Wheat</strong> is one of the crop rotation crops. It is preceded by cotton and followed by groundnut and<br />
sorghum. About 168 thousand hectares are cultivated annually with wheat. <strong>Wheat</strong> production is<br />
fully mechanized (Dawlbeit, 1996). Disc harrows and ridgers are used for seedbed preparation<br />
while seed drills and wide level disc harrows equipped with seeder boxes are used for seeding.<br />
Land preparation starts usually during the rainy season in September while seeding is during<br />
November. Private service companies and individuals execute the mechanized operations of<br />
seedbed preparation and seeding. <strong>The</strong>re are about three large service companies, about ten<br />
medium companies and a large number of individually owned machines. <strong>Wheat</strong> yields are low<br />
with a mean of 1.26 tlha (Faki and Ismail, 1994).<br />
Harvesting is usually during March and April. About 300 combine harvesters are involved in<br />
wheat harvesting. Almost all of these machines are privately owned. <strong>The</strong> most common type is<br />
the self-propelled combine harvester equipped with 4.5m wide grain header.<br />
One of the most serious problems of using combine harvesters is high harvesting losses. It is<br />
estimated that about 18-20% of the produced crop is·lost during harvesting.<br />
Previous Research<br />
A study was conducted at Gezira Research Station at Wad Medani for two seasons (1991/92<br />
1992/93) to estimate the effect of time of harvesting on wheat harvesting losses (Dawelbeit,<br />
1996). Results, as depicted in Table 1, showed that the average total losses amounted to 2.6% in<br />
the first season and 2.3% in the second season. Results also showed that delayed harvesting<br />
could result in very high losses since the rain showers start as early as May. <strong>The</strong> table also shows<br />
that in 1992/93 season the last harvest date (May 29) which occurred after a rain shower resulted<br />
in very high grain losses.<br />
<strong>Wheat</strong> Harvesting System in Gezira<br />
Due to the importance of wheat harvesting, a special system was developed to manage wheat<br />
harvesting in the Gezira Scheme. A high committee for wheat harvesting at the headquarters<br />
assisted by committees on the group level is responsible for management of harvesting. This<br />
committee sets wheat harvesting regulations and prices, contracts combines, secures inputs,<br />
follows up harvesting operations, delivers wheat to flour mills and collects loans and taxes from<br />
the tenants. <strong>The</strong> committee usually starts its activities in January and ends its activities in June of<br />
every year.<br />
.0<br />
All the area is harvested by harvesting contractors. <strong>For</strong> those contractors, wheat harvesting is a<br />
special season. A combine harvester usually works about 18 hours per day in two shifts. Every<br />
shift has six laborers. <strong>The</strong>se include a driver, an assistant in addition to four laborers responsible<br />
for sack stitching and handling: all combine harvesters in the Sudan are equipped with a special<br />
handling system that uses j ute sacks rather than bulk handling. Those laborers are temporary<br />
employed for the harvesting period only. <strong>The</strong>y are paid by the area they harvest. Most of the<br />
combine operators are not trained and have a very low standard of education.<br />
Usually, at mid wheat production season (December), a survey is made to estimate the number of<br />
available harvesting machines in the area. <strong>The</strong> number of combine harvesters that is required to<br />
342
Reducing mechanical harvesting losses ofwheat - Dawelbeit<br />
harvest the area in a period of one month is estimated to be about 300. Nonnally there is a<br />
shortage and great efforts are usually made to bring combine harvesters from other agricultural<br />
production areas.<br />
Estimation of <strong>Wheat</strong> Harvesting Losses<br />
Total wheat harvesting losses are generally divided into pre-harvest, gathering and processing<br />
losses. <strong>Wheat</strong> yield is divided into collected yield and gross yield. <strong>The</strong> following definitions are<br />
adopted:<br />
1. Pre-harvest losses: <strong>The</strong>se are the wheat seeds and spikes, which are lost on the ground and<br />
can not be collected by the combine. <strong>The</strong> reason for this pre-harvest loss could be due to crop<br />
lodging, weather factors such as wind or rains, or could be due to damage of wheat by pests such<br />
as rodents or termites.<br />
2. Gathering losses: <strong>The</strong>se are usually wheat seeds and spikes that are missed by the combine<br />
header and were lost on the ground. <strong>The</strong> main reason for gathering losses is combine operation.<br />
Research results showed that gathering losses increased with over speeding and unskilled<br />
operators.<br />
3. Processing losses: Processing losses are those wheat seeds which are lost in threshing and<br />
cleaning, broken seeds, unthreshed wheat heads and those lost with wheat straw. <strong>The</strong> main<br />
reason for wheat processing losses is mal-adjustment of the combine harvester.<br />
4. Total harvesting losses: Is the sum of pre-harvest, gathering and processing losses.<br />
5. Collected yield: Actual weight of wheat harvested.<br />
6. Gross yield: Is the sum of collected yield and total harvesting losses.<br />
7. Percent losses: <strong>The</strong> ratio of the specific loss to the gross yield multiplied by hundred.<br />
Minimizing Combine Harvester Losses Project<br />
<strong>The</strong> project for minimizing wheat harvesting losses was started in the season 1993/94. <strong>The</strong><br />
organization involved establishing a higher committee for the project. Its responsibility is to<br />
develop the annual work plans, establish committees in the different groups and to evaluate the<br />
overall performance. Members of the committee included the senior staff of the agricultural<br />
administration of the Sudan Gezira Board in addition to the agricultural engineering research<br />
scientists at Gezira Research Station.<br />
Before launching the project, literature was collected and two pamphlets were published. <strong>The</strong><br />
first was entitled "How to minimize wheat harvesting losses". It was written for fanners, and<br />
included infonnation about: when to stop irrigating the wheat crop, signs of wheat crop maturity,<br />
pH:;parations before harvesting, what to observe while the combine is working, and' what to<br />
observe when the combine finishes its work. <strong>The</strong> second pamphlet targeted combine operators. It<br />
was entitled "How to increase the efficiency of the combine harvester". It included instructions<br />
of how to maintain the combine, workshop and field adjustments of the combine harvester,<br />
patterns of combine harvesting, proper combine adjustments, critical factors of operation,<br />
343
Reducing mechanical harvesting losses ofwheat - Dawelbeit<br />
optimum speeds, the importance of combine operators in minimizing wheat harvesting losses, <br />
and advice about the use of fuel and oils. <br />
A) Project Strategy: <br />
<strong>The</strong> project strategy involved four approaches. <br />
<strong>The</strong> first approach: This approach targeted the farmers and involved extension, educational and <br />
media activities. <strong>The</strong> main objective was to increase farmers' awareness of the problem of high <br />
wheat harvesting losses and to show them what to do to solve this problem. <br />
<strong>The</strong> second approach: This approach targeted the combine operators. <strong>The</strong>re are about 600 of <br />
them working in wheat harvesting. <strong>The</strong> main objective was to increase operators' awareness and <br />
to improve their skills and increase their performance efficiency. <br />
<strong>The</strong> third approach: This approach involved regulatory activities. It proposed a system for <br />
suitability tests and checking combine performance. <br />
<strong>The</strong> fourth approach: This included field surveys to estimate actual harvesting losses and to <br />
detect their sources. This will help in diagnosing the causes and identifying the priorities for the <br />
following season. <br />
B) Project Activities: <br />
Great efforts had been put into the different approaches. <strong>The</strong> Sudan Gezira Board in addition to <br />
the Farmers' Bank and the Bank Consortium that was financing wheat crop production financed <br />
the Project. <br />
In the first approach, which involved extension, educational activities such as lectures, meetings <br />
and workshops were made at the Group level (18 Groups). <strong>The</strong> topics covered in these activities <br />
included: the wheat harvesting problem ~d its economic implications, technical information <br />
about minimizing the losses, farmers' responsibilities towards solving this problem. Farmer <br />
leaders and . extension agents conveyed these messages at the block level. <strong>The</strong>re are about 112 <br />
blocks in the Gezira Scheme. <strong>The</strong> farmers at the block level conveyed the same message, in tum, <br />
to production committees at the village level. <strong>The</strong>re was also full coverage of these activities by <br />
the media. In addition to these, radio and television messages were broadcast during the <br />
harvesting period. <br />
Training of combine operators involved meetings at five locations. In these meetings the wheat <br />
harvesting problem was discussed. Technical information and practical skill was delivered to the <br />
operators. <strong>The</strong> practical aspects included calibration and checking of the combines in addition to <br />
evaluation ofharvesting losses. <br />
<strong>The</strong> Gezira Scheme endorsed regulations regarding combine suitability tests and checking of <br />
combine harvesters was performed by the Agricultural Engineering Department of the Gezira <br />
Scheme. <br />
<strong>The</strong> field surveys were carried out during the harvesting season. <strong>The</strong>se covered all of the wheat <br />
production area. About 60 combine harvesters were covered each year. <strong>The</strong> Agricultural <br />
Engineering Research Program executed these surveys at Gezira Research Station. <br />
344
Reducing mechanical harvesting losses ofwheat - Dawelbeit<br />
RESULTS<br />
<strong>The</strong> project ideas and efforts were highly accepted and appreciated by the Gezira Scheme<br />
Management as well as the farmers. Adoption rates were very high. This was clear from the good<br />
follow-up of harvesting operations and in the increased awareness about the importance of<br />
solving this problem. Reducing wheat harvesting losses was the main topic in farmers' meetings<br />
and gatherings. This high interest was reflected in the decreased percent losses every year.<br />
Results of the field surveys showed excellent progress in reducing wheat harvesting losses. This<br />
decreasing trend is shown in Figure 1. Before the project, losses were estimated to be about 20%.<br />
In the first year of the project, this percent decreased to 13%. In the second year (1994/95) losses<br />
were further decreased to 9.3%. By the third year, the average loss was estimated to be about<br />
6.8%.<br />
<strong>The</strong> total decrease in harvesting losses over the three seasons was about 13.2%, saving an<br />
estimated 96,100 tons of wheat. <strong>The</strong> per capita consumption in Sudan is about 44 kg of wheat<br />
(Pingali, 1999). Thus, the amount saved is enough to feed about 2,200,000 person annually. <strong>The</strong><br />
value of the collected amount ofwheat has been ~stimated at about 38.4 billion Sudanese pounds<br />
or about US$25.6 million.<br />
REFERENCES<br />
Dawelbeit, M.I. 1996. Crop establishment and mechanization of wheat. In: Ageeb, OA.A., Elahmadi, A.B., Solh,<br />
M.B. and Saxena, Mohan C. (eds.). <strong>Wheat</strong> Production and Improvement in the Sudan. Proceedings of the<br />
National Research Review <strong>Workshop</strong>, 27-30 August 1995, Wad Medani, Sudan. ICARDAIAgricultural<br />
Research Corporation. ICARDA: Aleppo, Syr:ia. 262 pp.<br />
Faki , H.H.M. and M.A. Ismail. 1994. Some indicators for wheat production prospects in Sudan. In: Saunders, D.A.<br />
and G.P. Hettel. (eds.). <strong>Wheat</strong> in Heat Stressed Environments: Irrigated, Dry areas and Rice-<strong>Wheat</strong><br />
Farming Systems. Mexico, D.F. : CIMMYT.<br />
Pingali, P.L. (ed.). 1999. CIMMYT 1998-99 World <strong>Wheat</strong> Facts and Trends. Global <strong>Wheat</strong> Research in a Changing<br />
World: Challenges and Achievements. Mexico, D.F.: CIMMYT.<br />
Questions and Answers:<br />
Amanuel Gorfu: It is reported that wheat production in the Gezira Scheme is fully mechanized,<br />
irrigated and crop rotation is also practical. Regardless ofcrop losses after maturity (pre- and<br />
post-harvest losses), what are the major reasons for the low yields obtained from wheat in this<br />
area?<br />
Answer: <strong>The</strong> major reasons for the low productivity of wheat under Gezira conditions is bad<br />
crop management. Some farmers « 5%) generally produce more than 5 tlha using the package<br />
produced by ARC of Sudan. <strong>The</strong> rest have the problem ofpoor management.<br />
345
Reducing mechanical harvesting losses a/wheat - Dawelbeit<br />
-<br />
25<br />
20<br />
-~ 0<br />
U) 15<br />
U)<br />
0 <br />
"'ffi 10<br />
-0<br />
I<br />
5<br />
0<br />
92/93 93/94 94/95 95/96<br />
Season<br />
Figure 1. <strong>Wheat</strong> harvesting losses, Gezira Scheme, seasons 1992/93-95/96.<br />
Table 1.<br />
Effect of harvesting date on total grain losses in Gezira.<br />
. ..' .<br />
199L/92 · l992/93<br />
Date . Total Joss (%) , Date· .- TotaUoss (%,) •..<br />
I<br />
March 31 , 1992 0.9 March 20, 1993 1.1<br />
April 6 3.1 March 27 2.3<br />
April 13 2.4 April 3 1.2<br />
April 20 2.8 April 10 1.3<br />
April 27 3.7 April 17 2.1<br />
May 4 2.3 April 24 1.7<br />
May 13 2.9 May 1 2.6<br />
May 8 2.4<br />
May 15 6.4<br />
May 29 28<br />
Mean 2.6 Mean 2.3<br />
346
EFFECTS OF CROP ROTATION, TILLAGE METHOD AND N APPLICATION <br />
ON WHEAT YIELD AT HANANG WHEAT FARMS, TANZANIA<br />
P.L. Antapa 1 and W.L. Mariki 2<br />
l HWC-CMSC, P.O. Box 96, Katesh, Tanzania<br />
2SARI, P.O. Box 6024, Arusha, Tanzania<br />
ABSTRACT<br />
Crop management options which optimize tillage, residue management and<br />
herbicide practices are likely to provide more sustainable and efficient farming<br />
systems, especially in relatively marginal environments like those prevailing at<br />
the Hanang <strong>Wheat</strong> (HWC) farms. A crop rotation trial was established at the<br />
HWC from 1994/95-1999/2000 to determine whether wheat yields at the<br />
HWC farms could be improved through crop rotation with soybean and pigeon<br />
pea; rotations were compared in factorial combination with tillage practice and<br />
N application. Across four years of experimentation, rotations of wheat with<br />
soybean or wheat with pigeon pea, both under minimum tillage, resulted in the<br />
highest wheat yields, 2.82 and 2.80 t/ha, respectively. Soybean-wheat or<br />
pigeon pea-wheat rotations are recommended for improved and sustainable<br />
wheat yields at the HWC farms. However, further research is needed to<br />
determine optimal rotation frequencies. Use of N fertilizer alone is not<br />
recommended to increase wheat production at the HWC farms. However, N<br />
application of 30 kglha is recommended in conjunction with minimum tillage<br />
to increase wheat production at the HWC farms.<br />
INTRODUCTION<br />
Crop management options which optimize tillage, residue management and herbicide<br />
practices are likely to provide more sustainable and efficient farming systems especially in<br />
marginal environments like the Hanang wheat farms in northern Tanzania.<br />
In areas where soil moisture limits plant growth, zero till (ZT) systems have been reported to<br />
produce crop yields similar to (Carter and Rennie, 1985) or higher than (Tessier et al., 1990)<br />
conventional tillage (CT). However, in relatively humid environmental conditions, crop yield<br />
for ZT systems were comparable to (Carter et al., 1988) or lower than (Parsons and Koehler,<br />
1984) those obtained under CT systems. Crop response to ZT was found to be inversely<br />
proportional to the risk of compacting the soils (Rydberg, 1992). It has been found that the<br />
grain yield potential ofCT practices is generally site specific (van Doren et al., 1976).<br />
Adapting crop rotation at the Hanang wheat farms can be a long-term and sustainable<br />
solution to the existing weed, soil fertility and plant disease problems which currently prevail.<br />
Alternate crops could also help in spreading the risk involved in the mono-cropping system<br />
which is the conventional practice at the HWC. Through research programs carried out at<br />
HWC farms, some crops which perform very well have already been identified that could be<br />
grown in rotation with wheat. <strong>The</strong>se include: soybeans, sunflower, safflower, common beans,<br />
maize and flax. However, availability of a market for these various crops has been the major<br />
347
Effects ofcrop rotation, tillage method and N application on wheat yield - Antapa and Mariki<br />
factor limiting the HWC from adopting the various rotational crops in the wheat production<br />
system. Due to mono-cropping and other factors, wheat yield has been dropping<br />
considerably. Average wheat yield over the past five years is approximately 1.01 t/ha.<br />
MATERIALS AND METHODS<br />
Experimental Design and Treatments<br />
An RCBD with split-split plot layout with 3 replications was used.<br />
Rotational sequences (as main plots):<br />
W = <strong>Wheat</strong> (control); Soy = Soybeans; PP = Pigeon peas<br />
RS1 = Soy W Soy W Soy (for 1994/95 - 1996/97 growing seasons) <br />
RS1 PP W PP W PP (for 1997/98 - 1998/99 growing seasons) <br />
RS2 W Soy W Soy W <br />
RS3 W W W W W <br />
Tillage methods (as sub-plots): <br />
T1 = Conventional tillage using chisel, sweeps and sweeps (CSS) (control treatment) <br />
T2 Reduced tillage using chisel, followed by Roundup application then sweeps (CRS) <br />
T3 Zero tillage - spray with Roundup (R). This treatment was excluded in the 1997/98 <br />
and 1998/99 growing seasons<br />
N fertilizer application levels (top dressed as urea, as sub-sub-plots):<br />
N1 = 0 kg N/ha (control); N2 = 30 kg N/ha; N3 =60 kg N/ha.<br />
Two sites were used at the Hanang wheat farms from 1994/95-1999/2000; one was on a<br />
Mollisol and the other on a Vertiso!. Two more sites were established in 1999.<br />
Before planting, soybean seed was treated with rhizobial inoculant (Nitrosua) collected from<br />
Sokoine University, Morogoro, to induce nodulation during the early growing stages of the<br />
soybean plants.<br />
Grass weeds in soybean wC?re controlled by using herbicides (Fusilade at l.0 lIha) while the<br />
broadleafweeds were controlled with Flex at 5.0 l/ha.<br />
Stomp at 3.0 IIha was used to control grass and broadleaf weeds in wheat; when necessary,<br />
2,4-D amine or Buctril MC was used to control broad leaf weeds in wheat.<br />
<strong>Wheat</strong>, soybeans and pigeon peas were all hand seeded. <strong>Wheat</strong> was seeded at 30 g of seed per<br />
10 m length row (i.e., 120 kg seed/ha) while soybeans and pigeon pea were seeded at 35<br />
kglha (i.e., 25 cm x 20 cm x 2 plants per hill and 50 cm x 30 cm x 2 plants per hill,<br />
respectively). This was mainly due to lack of a good seeder for such small plots at the HWC<br />
farms.<br />
348
Effects ofcrop rotation, tillage method and N application on wheat yield - Antapa and Mariki<br />
Post-harvest tillage operations were done with a chisel plough fitted with sweeps during the<br />
third week of Augustl September - just after the combining operation.<br />
Roundup application at 1.0 llha was done after the first rains when the first weeds to emerge<br />
were at about the 3-4 leaf stage. When necessary, a second Roundup application was done.<br />
No appropriate herbicides were available for weed control in pigeon peas, therefore, as an<br />
alternative, hand weeding was done on the small plots.<br />
Source ofN was urea (46% N).<br />
Net plot (harvest plot area): 3 m x 3 m<br />
Sub-sub-plot (fertilizer plots): 10 m x 5 m<br />
Sub-plot size (rotational sequence plots): 10 m x 15 m<br />
Main plot size (tillage system plots): 10 mIx 45 m<br />
Data collected were as follows: straw yield (glplot), number of wheat seedlings per m 2 , plant<br />
height (cm), grain yield (tlha) , harvest index, total biomass and precipitation (rainfall and<br />
rainy days).<br />
RESULTS AND DISCUSSION<br />
Overall, there was a significant wheat yield difference resulting from rotation sequences.<br />
<strong>Wheat</strong> after soybean and wheat after pigeon pea gave the highest wheat yields when<br />
compared to continuous wheat plots resulting in 2.52, 2.50 and 1.80 tlha, respectively (Table<br />
1).<br />
<strong>Wheat</strong> yield differences due to tillage methods were also significantly different. Overall,<br />
minimum tillage plots gave the highest wheat yields, 2.75 tlha, followed by conventional,<br />
2.13 tlha, and finally zero till plots, 1.33 tlha (Table 1).<br />
As regards N fertilizer application, wheat yields obtained were not significantly affected by N<br />
rate; however, 30 kg N/ha gave a slightly higher yield (2.31 tlha) than the other two levels<br />
(2.28 and 2.25 tlha); however, all differences were not significant.<br />
Treatment interactions of crop rotation x tillage methods or tillage methods x N-fertilizer<br />
levels or crop rotation x N rate or crop rotation x tillage methods x N-fertilizer application<br />
level were significant.<br />
<strong>Wheat</strong> after soybean or wheat after pigeon pea, both on minimum tillage, were the best<br />
treatments as they resulted in the highest wheat yield, 2.82 and 2.80 tlha, respectively. Also,<br />
wheat after soybean or wheat after pigeon pea with minimum tillage and application of 30<br />
kglha of N resulted in significantly higher wheat yield per unit area, 2.57 and 2.54 tlha<br />
compared to the wheat after wheat option which gave 1.05 tlha.<br />
CONCLUSIONS AND RECOMMENDATIONS<br />
From the discussion above, it has been observed that crop rotation and N rate alone will not<br />
significantly improve wheat grain yields at the Hanang wheat complex farms.<br />
349
Effects ofcrop rotation, tillage method and N application on wheat yield - Antapa and Mariki<br />
Crop rotation at the HWC fanus wilt playa significant role in sustaining wheat production at<br />
the fanus. <strong>Wheat</strong> after soybean or wheat after pigeon pea, both on minimum tillage, are the<br />
best treatments as they resulted in the highest wheat yield of 2.82 and 2.80 t/ha, respectively.<br />
Also, when crop rotation is practiced (i.e., wheat after soybean or wheat after pigeon pea)<br />
with minimum tillage and application of 30 kglha ofN, wheat yield per unit area significantly<br />
increased to 2.57 and 2.54 t1ha.<br />
REFERENCES<br />
Antapa, P.L. and Mwakosya, G.M. 2000. Afforestation programs for environmental rehabilitation in sustaining<br />
wheat production at Hanang wheat farms, northern Tanzania. Paper presented to the Agroforestry<br />
workshop for extension facilitators on the promotion of indigenous Agroforestry systems and species<br />
for sustainable land management, held in Arusha on 19-23 June 2000.<br />
Carter, M.R. and Rennie, D.A. 1985. Spring wheat growth and '5N studies under zero and shallow tillage on the<br />
Canadian Prairies. Soil Tillage Res. 5: 273'-288.<br />
Carter, M.R., Johnston, H.W. and Kimpinski, J. 1988. Direct drilling and soil loosening for spring cereals on a<br />
fine sandy loam in Atlantic Canada. Soil Tillage Res. 12: 365-384.<br />
Parson, B.C. and Kochler, F.E. 1984. Fertilizer use by spring wheat as affected by placement. Proc. 35 th Annual<br />
Northwest Fertilizer Conference, Pasco, W A Department of Plant and Soil, University of Idaho,<br />
Moscow, pp. 101-105.<br />
Rydberg, T. 1992. Plough less tillage in Sweden. Results and experiments from 15 years of field trials. Soil<br />
Tillage Res. 22: 253-264.<br />
Tessier, S., Peru, M., Campbell, c.A., Zentner, R.P. and Dyck, F.B. 1990. Conservation tillage for spring wheat<br />
in semi-arid Saskatchewan. Soil Tillage Res. 18: 73-90<br />
Van Licrop, W. 1988. Determination of available phosphorus in acid and calcareous soils with the Kelowna<br />
multiple element extractant. Soils Sci. 146: 284-291.<br />
Questions and Answers:<br />
Hugo van Niekerk: How long has wheat growing (continuous) been practiced at the HWC<br />
farms?<br />
Answer: <strong>Wheat</strong> production under monocropping system (without rotation) has been<br />
practiced at the Hanang wheat farms for over the last thirty years (since the 1967/68 season).<br />
Asefa Taa: As far as the weed spectrum is concerned, were there any differences noticed in<br />
your rotation trial?<br />
Answer: No significant weed spectrum differences have been noticed during the four years<br />
of rotation.<br />
Mamoun Ie Dawelbeit: Results showed that there were significant differences between<br />
tillage treatments. <strong>The</strong> question is what is the main objective of tillage in the experiment?<br />
Also what are the main differences between the two tillage treatments?<br />
Answer: <strong>The</strong> main objective ofthe tillage treatments was to determine a tillage method that<br />
would enhance soil moisture levels in the soil. Tillage methods were conventional, minimum<br />
and zero.<br />
350
Effects ofcrop rotation, tillage method and N application on wheat yield - Antapa and Mariki<br />
Table 1.<br />
<strong>Wheat</strong> yields (tJha) from crop rotation trial at Hanang <strong>Wheat</strong> Complex<br />
(1994-99).<br />
., <br />
Treatwent .' ,<br />
. '.<br />
"<br />
' " .-Season '<br />
Level ;: 1994/95, ,' 1~P519 .6 . 1997198 11998/99 " M~aQ<br />
"' - •.. .-.; r •• :" .::, i.~ . <br />
.. ,., - ~<br />
, ..,;<br />
Rotation sequence Pigeon pea/<strong>Wheat</strong> 0.83a 2.82a 0.87a 5.37a 2.52a<br />
Soyl<strong>Wheat</strong> 0.79a 2.82a 1.00a 5.57a 2.50a<br />
<strong>Wheat</strong>l<strong>Wheat</strong> 0.84a 2.71a 0.89a 2.77b 1.80b<br />
C.V.(%) 27.15 13.55 21.4 9.69 17.95<br />
LSD(0.05) 0.1454 0.2907 0.3793 0.5904 0.35<br />
Tillage method Conventional till 0.82b 2.36a 0.87a 4.48 2.13a<br />
Minimum till 1.83a 3.55a 0.97a 4.66 2.75a<br />
Zero tillage 0.47c 2.19a N/A N/A 1.33b<br />
C.V.(%) 27.15 13.55 21.4 9.69 17.95<br />
LSD(0.05) 0.2028 1.586 0.2483 0.4793 0.63<br />
N rate (kglha) 0 0.82a 2.85a 0.81b 4.63a 2.28a<br />
30 0.84a 2.79a 1.00a 4.59a 2.31a<br />
60 0.82a 2.72a O.96a 4.49a 2.25a<br />
C.V.(%) 27.15 13.55 21.4 9.69 17.95<br />
LSD(0.05) 0.1234 0.2080 0.1359 0.3046 0.19<br />
Table 2.<br />
Soil N status before initiation of the trial at the Gidagamowd site<br />
(Mollisol) in 1994.<br />
Soil depth Total N ..' N0 3 -N SQil.moisture . <br />
, .<br />
(em) (%) (ppm)<br />
(O~r <br />
0-30 0.11-0.19 8.8 - 22.0 14.25 - 21.79 <br />
30-60 0.08 - 0.13 8.0 - 16.0 21.26 - 23.69<br />
60-90 0.07 - 0.11 5.6 - 12.4 23.50 - 27.26<br />
Table 3.<br />
Soil N status before initiation of the trial at the Basotu site (Vertisol) in<br />
1994.<br />
Soil·depth TotalN ' N0 3 -N :SoiLmois'ture<br />
.. . ,<br />
.'. (cm) J%) : ... (ppm) .' ('Yo) ' . <br />
0-30 0.11 - 0.16 10.3 - 24.6 28.91 - 35.32 <br />
30-60 0.10 - 0.15 04.4 - 22.6 32.92 - 36.49<br />
60-90 0.09 - 0.13 02.1 - 14.6 34.06 - 38.90<br />
351
ON-FARM EVALUATION OF THE RESPONSE <br />
OF FOUR BREAD WHEAT VARIETIES TO NITROGEN FERTILIZER <br />
IN KARATU DISTRICT IN NORTHERN TANZANIA <br />
H.A. Mansoor 1 , R.V. Ndondi l , D.O. Tanner2, P. Ndakidemi l and R.T. Ngatokewa 1<br />
ISelian Agricultural Research Institute, P.O. Box 6024, Arusha, Tanzania <br />
2CIMMYT/CIDA <strong>Eastern</strong> Africa Cereals Program, P.O. Box 5689, Addis Ababa Ethiopia <br />
ABSTRACT<br />
<strong>Wheat</strong> research in Tanzania has been dominated by on-station research with an<br />
orientation for large-scale mechanized farms. This approach failed to address the<br />
real problems and constraints facing small- to medium-scale wheat fanners.<br />
Thus, an on-farm trial was established in 1997 at Rhotia and Mbulumbulu<br />
villages in Karatu district in the Northern Zone of Tanzania to evaluate the<br />
performance of three improved wheat varieties and their response to applied N<br />
fertilizer. <strong>The</strong> wheat varieties included Mbayuwayu, Kware, Tausi and a local<br />
fanners' variety; the N rates used were 0, 30, 60 and 120 kg Nlha. Combined<br />
analysis across locations and years indicated significant variety and N effects; the<br />
two- and three-way interactions were all non-significant. Across the range of<br />
wheat seed and grain prices considered in the economic analysis, the wheat<br />
variety Kware was economically optimal. Application of 30 kg Nlha was also<br />
economically optimal across a range of fertilizer and wheat grain prices. <strong>The</strong><br />
current results provide a sound basis for recommending the wheat variety K ware<br />
and an N rate of30 kglha for small-scale wheat farmers in northern Tanzania.<br />
INTRODUCTION<br />
Agricultural research in Tanzania has been dominated by on-station research, and the results<br />
generated by this research have often been translated into recommendations for small-scale farm<br />
production under varied environments. This approach failed to account for the actual constraints<br />
confronting the small-scale farming community. <strong>The</strong> majority of the fanners in Tanzania can be<br />
described as small-scale resource poor farmers, and these have gained little from the process of<br />
technology transfer. New technologies should be evaluated and verified under farmers'<br />
management condi'tions prior to making recommendations either on a national or a regional<br />
scale. Tanzanian scientists have yet to fully understand the diverse and complex environments in<br />
which resource poor farmers operate. In order to increase the relevance and, hence, adoption of<br />
agricultural interventions such technologies must be developed under fanners' conditions.<br />
During the period between 1970 to 1994, several bread wheat varieties were released by the<br />
Selian Agricultural Research Institute (SARI) for large-scale mechanized wheat farms based at<br />
the Hanang <strong>Wheat</strong> Complex. As a result, wheat yields increased from an average of 0.5 to 8<br />
bags/acre (Nyaki et at., 1993). However, small- and medium-scale farn1ers have not benefited<br />
from the released wheat varieties, as well as the other components of the production package<br />
developed during that period, because there was no evaluation under the relevant environments .<br />
..<br />
Low soil fertility, exacerbated by sub-optimal farming practices such as the removal of crop<br />
352
Response offour bread wheat varieties to N fertilizer - Mansoor et at.<br />
residues, overgrazing and poor soil management practices, also contributes to low wheat yields<br />
in northern Tanzania (Stonehouse and Duff, 1973). Chemical fertilizers can be used at least in<br />
part to alleviate soil fertility constraints. However, due to the rising cost of imported fertilizers,<br />
efficient nutrient sources, optimal methods of application, and wheat cultivars with high<br />
fertilizer use efficiency must be identified to minimize the cost ofproduction.<br />
Previous research revealed a significant response of wheat grain yield to N fertilizer in some<br />
locations in Hanang District in northern Tanzania (Nyaki et at., 1993). However, the influence<br />
of N fertilizer and the relative efficiency of uptake of different wheat cultivars have not been<br />
evaluated in Karatu district. Thus, a collaborative on-farm trial, involving soil scientists and<br />
wheat breeders, was initiated in Karatu District to evaluate the performance of three recently<br />
released bread wheat varieties and their response to N rates.<br />
<strong>The</strong> objectives of this trial included the evaluation of three improved bread wheat varieties under<br />
farmers' management conditions, the determination of an optimal rate of N fertilizer (from<br />
urea), and to promote adoption of new varieties by farmers in Karatu District based on their<br />
involvement during the growing season. This paper, therefore, presents the agronomic and<br />
economic analysis of grain yield results generated during three years of a study conducted at two<br />
locations in a major bread wheat production zone of northern Tanzania.<br />
MATERIALS AND METHODS<br />
<strong>The</strong> trial was initiated during 1997 and was conducted for three consecutive years at the Rhotia<br />
(3°18'28"S and 35°44'32"E ) and Mbulumbulu (3°16'66"S and 35°47'08"E) villages in Karatu<br />
district of northem Tanzania. <strong>The</strong> soils in the two villages are classified as ferric Nitisols, and<br />
andic Nitisols. <strong>The</strong> soils have a mean pH of6.5, available P of25 ppm, total N of 0.24%, C.E.C.<br />
of 40 meq/100 g soil, and clay content of approximately 45%. Total annual precipitation is 800<br />
mm, and that received during the growing season is approx. 550 mm. <strong>The</strong> villages are situated at<br />
altitudes of 1550 and 1500 m a.s.l., respectively.<br />
<strong>The</strong> trial was laid out in an RCBD with a 4 2 factorial arrangement of treatments. <strong>The</strong> two factors<br />
were wheat cultivars and N rates - each having four levels. <strong>The</strong> four wheat cultivars in the trial<br />
were Mbayuwayu, Kware, Tausi - all improved and officially released cultivars - and a local<br />
farmers' variety used as a check treatment. <strong>The</strong> four N rates used were 0, 30, 60 and 120 kg<br />
Nlha in the form of urea. <strong>The</strong> trial was laid out in three replications, and the gross plot size for<br />
each treatment was 25 m 2 .<br />
Host farmers provided the necessary tillage for this trial; tillage was based on the use of tractors<br />
and sometimes ox ploughs; crop protection practices simulated farmers' practices in wheat (i.e.,<br />
use of herbicides to control weeds). Pre-weighed amounts of seed (i.e., at a rate of 150 kglha <br />
the mean farmers' practice) and fertilizer were broadcast applied on the soil surface of the<br />
appropriate plots after tillage, and were subsequently incorporated imitating the traditional<br />
practice. Sowing dates followed farmers' practices (i.e., sowing from the first week of April to<br />
the last week of April as soon as sufficient rain was received to saturate the surface).<br />
At crop maturity, a net plot of 9 m 2 was harvested by sickle at ground level from each plot for<br />
grain and biomass yield determination. Grain moisture contents were determined and yields<br />
adjusted to a 12.5% moisture basis.<br />
Statistical analysis of agronomic results. Agronomic data were subjected to analysis of<br />
353
Response offour bread wheat varieties to N fertilizer - Mansoor et al.<br />
variance (ANOVA), analyzing the effects of four wheat cultivars and fow- N rates at each site. A<br />
combined analysis over sites and years was used to identify main and interaction effects.<br />
Economic analysis. Grain yield data for the variety and fertilizer main effects were subjected to<br />
economic analysis, using the CIMMYT (1988) partial budget methodology. <strong>Wheat</strong> yields were<br />
adjusted downwards by 10% to more closely approximate yields on farmers' fields. <strong>Wheat</strong><br />
cultivars and N rates were analyzed separately by calculating Gross Field Benefit (GFB), Total<br />
Costs that Vary (TCV), Net Benefit (NB), Marginal Net Benefit (MNB), Marginal Cost (MC)<br />
and the Marginal Rate of Return (MRR) for each treatment (i.e., relative to the local check in the<br />
variety analysis, and relative to the next lowest cost or non-dominated treatment for the N rate<br />
analysis).<br />
<strong>The</strong> wheat cultivar and N treatments were also subjected to sensitivity analysis using a range of<br />
wheat seed and grain prices and wheat grain price and fertilizer prices, respectively.<br />
RESUL TS AND DISCUSSION<br />
Results of Agronomic Analysis<br />
Rainfall data over the three seasons in Karatu (Figw-e 1) reveal that the 1997 season received the<br />
highest amount of precipitation which was well-distributed up to mid July. <strong>The</strong> 1999 season<br />
exhibited a similar trend but with less total precipitation. In contrast, the 1998 season not only<br />
had the lowest precipitation dw-ing the growing season (April-August), but the rains stopped<br />
during June (i.e., before grain filling stage of the crop - contributing to terminal drought stress).<br />
l<br />
700 I<br />
- E 500<br />
600 I<br />
-E • 1997<br />
400<br />
I<br />
---.- -- 1998<br />
co<br />
'to- 300<br />
- -A- - 1999<br />
. c<br />
co<br />
0::: 200<br />
100<br />
0<br />
)~~ «~,fCf' ~(i~ ~~... )~~0 )~... ~~~ C:J0Q'- 0
Response ojjour bread wheat varieties to N jertilizer - Mansoor et al.<br />
evident in 1997 at both sites; however, the response was not evident in the individual analyses<br />
for 1998 and 1999 mainly due to moisture stress caused by insufficient soil moisture during the<br />
grain filling stage. In the combined analysis for the three years and over the two sites, wheat<br />
variety and nitrogen main effects showed highly significant effects on wheat grain yield. All of<br />
the two-way and three-way interactions were non-significant (Table 1).<br />
<strong>The</strong> grain yield response of the four wheat varieties to N rates over the two sites and three years<br />
are presented in Figure 2. In general, the grain yield of the four wheat varieties responded<br />
positively to 30 kg Nlha; application of N at higher rates resulted in relatively low yield<br />
responses. <strong>The</strong> wheat variety Kware gave the highest grain yield across all N rates, while the<br />
local variety produced the lowest yield; the superior performance of Kware reflects its<br />
superiority for yield potential and presumably nitrogen use efficiency.<br />
3500<br />
3000<br />
2500 •<br />
2000<br />
_....... -<br />
Mbayuwayu<br />
•<br />
Kw are<br />
--.-<br />
---Ali.--- Ta u s I<br />
Loc a I<br />
1500<br />
o 30 60 90 120<br />
N rate (kg/ha)<br />
___ _ ____~__ I<br />
I<br />
Figure 2. Grain yield response of four wheat varieties to four N rates.<br />
Results of Economic Analysis<br />
<strong>For</strong> the economic analysis of the four wheat varieties, it was assumed that seed of the<br />
farmers' local variety cost the same as the price of wheat grain (i.e., farmers retain their own<br />
seed), while the new varieties were priced at the cost of purchased conunercial seed. This, in<br />
effect, assesses the profitability of the initial purchase of seed of the new varieties; in<br />
subsequent years, farmers would be able to retain harvested seed of the new varieties for the<br />
next season's seed requirement (i.e., until seed contamination and admixtures necessitated the<br />
purchase of "fresh" seed).<br />
<strong>The</strong> MRR analysis of the four wheat vanetles was repeated under three different price<br />
scenarios (Tables 2a, 2b and 2c). In the first scenario, an average wheat grain price (140<br />
Tshs/kg) and an average price of wheat seed (300 Tshs/kg) were used. In the second scenario,<br />
a low wheat grain price (120 Tshs/kg) and a high price of wheat seed (350 Tshs/kg) were<br />
used. In the third scenario, an average wheat grain price (140 Tshs/kg) and a low price of<br />
wheat seed (200 Tshs/kg) were used. <strong>The</strong> results of the economic analyses were consistent<br />
with the agronomic superiority of Kware: across all three scenarios, the MRR for Kware was<br />
355
Response offour bread wheat varieties to N fertilizer - Mansoor et al.<br />
close to or exceeded 100%. This indicates that it would be economically optimal for smallscale<br />
wheat producers to shift from their local wheat variety by purchasing commercial seed<br />
of Kware. On the other hand, the other two improved wheat varieties would only be<br />
economically attractive, but not optimal, if wheat seed prices are reduced to approx. 200<br />
Tshs/kg (Table 2c).<br />
<strong>The</strong> MRR analysis of the four N rates was repeated under four different price scenarios,<br />
varying the price of N and wheat grain (Tables 3a, 3b, 3c and 3d). <strong>The</strong> results of the MRR<br />
analysis were consistent with the agronomic analysis of N rates: across the four price<br />
scenarios, the rate of 30 kg N/ha proved to be the economic optimum. Only in the most<br />
unfavorable scenario (i.e., Table 3d - wheat grain price low and N price high) did the<br />
application of 30 kg N/ha result in an MRR below 100%; however, even under this scenario,<br />
the 30 kg N rate provided an MRR of 67% relative to nil application. In all scenarios,<br />
treatments receiving N at higher rates (i.e., 60 and 120 kg N/ha) were dominated by the 30 kg<br />
N/ha treatment (CIMMYT, 1988); that is these treatments cost more and produced a lower<br />
net benefit. Thus, the application of 30 kg N/ha appears to be a "robust" technology to<br />
recommend to small-scale wheat farmers.<br />
CONCLUSIONS<br />
<strong>The</strong> improved wheat varieties, particularly the variety Kware, had a marked effect on wheat<br />
grain yields across the two sites and three seasons included in the current study. <strong>Wheat</strong> grain<br />
yield increments with Kware, Tausi and Mbayuwayu varieties were 32, 14, and 7%,<br />
respectively, of the yield of the farmers' local variety. By comparison, the incremental wheat<br />
grain yields when 30, 60 and 120 kglha ofN was applied were 18, 15, and 23%, respectively,<br />
of the yield with nil N applied.<br />
Of the three new wheat varieties, Kware was economically optimal across a range of wheat<br />
grain and seed prices. <strong>The</strong> other two varieties were sensitive to changes in prices, and would<br />
only be attractive to small-scale farmers if wheat seed prices were significantly reduced from<br />
the current level. Application of 30 kg N/ha in the fom1 of urea was economically optimal<br />
relative to the nil application treatment.<br />
Small-scale wheat farmers in Karatu District should be advised to adopt the wheat variety<br />
Kware and to apply 30 kg of N/ha in the form of urea. By adopting this recommendation,<br />
farmers will increase their total wheat production and economic profits.<br />
Further research may be required to address the anticipated long-term impact of mining soil<br />
P. On-farm studies of wheat grain yield response to P application are proposed for this area.<br />
REFERENCES<br />
CIMMYT. 1988. From Agronomic Data To Farmer'Recommendations: An Economics Training Manual.<br />
Completely Revised Edition. CIMMYT, Mexico, D.F., Mexico.<br />
Nyaki, A.S., Mansoor, H.A. and Ngatoluwa, R.T. 1993. Soil Fertility And Chemistry. Report Presented To<br />
Annual <strong>Wheat</strong> Coordinating Committee Meeting. Arusha, Tanzania, 11-12 Nov., 1993. Selian ARl,<br />
Arusha, Tanzania<br />
Stonehouse, H.B and Duff, J.P. 1973. Soils OfKaratu-Oldeani Area OfTanzania. A Report <strong>For</strong> <strong>The</strong> Agronomic<br />
Research Project Sponsored By <strong>The</strong> Canadian International Development Agency. Agriculture Canada,<br />
Ottawa, Canada.<br />
356
Response offour bread wheat varieties to N fertilizer - Mansoor et at.<br />
Table 1. Results of ANOV A of effects of wheat varieties and N levels on wheat grain yield<br />
over sites and years.<br />
'.<br />
,-'---', 'RbQtia ';'" ":., "MbuliiffibuliL 'combined<br />
..<br />
· 1997 19'98 ,: 1999 19'tii"' 'f9'98 i 999<br />
Variety (V) ** ** * * * NS ***<br />
Nitrogen (N) *** NS NS ** NS NS ***<br />
VxN NS NS NS NS NS NS NS<br />
V x location<br />
NS<br />
N x location<br />
NS<br />
V x N x location<br />
NS<br />
Mean yield (kglha) 3585 1525 3226 2802 1522 2482 2513<br />
C.V.(%) 14.6 47.6 17.8 19.1 47.9 28.0 25.5<br />
*, **, ***: Slgmficant at the 5, 1, and 0.1 % level, respectIvely.<br />
NS: Not significant (P> 0.05).<br />
Table 2a. MRR analysis for the four wheat varieties at Rhotia and Mbulumbulu (1997<br />
1999): Scenario 1.<br />
Variety Adj. GFB TCV NB '. MNB a MC a MRR~<br />
yield (%)<br />
Local 2000 280000 21000 259000<br />
Mbayuwayu 2149 300860 45894 254966 -4034 24894 D<br />
Tausi 2271 317940 46626 271314 12314 25626 48<br />
Kware 2631 368340 48786 319554 60554 27786 218<br />
Assumptions: Price of wheat grain = 140 Tshs/kg; Price of wheat seed = 300 Tshs/kg;<br />
Additional cost for each 100 kg wheat over local yield = 600 Tshs (cost of bag and labor).<br />
aMNB, MC and MRR calculated by comparing each test variety with the local variety.<br />
Table 2b. MRR analysis for the four wheat varieties at Rhotia and lVlbulumbulu (1997<br />
1999): Scenario 2.<br />
Variety, Adj. GFn ' '. TCV NR MNB a "' MC a 'MRR a '<br />
yield<br />
.. . , (o/C)<br />
Local 2000 240000 18000 222000<br />
Mbayuwayu 2149 257880 53394 204486 -17514 35394 D<br />
Tausi 2271 272520 54126 218394 -3606 36126 D<br />
Kware 2631 315720 56286 259434 37434 38286 98<br />
Assumptions: Price of wheat grain = 120 Tshs/kg; Price of wheat seed = 350 Tshs/kg;<br />
Additional cost for each 100 kg wheat over local yield = 600 Tshs (cost ofbag and labor).<br />
aMNB, MC and MRR calculated by comparing each test variety with the local variety.<br />
357
Response offour bread wheat varieties to N fertilizer - Mansoor et al.<br />
Table 2c. MRR analysis for the four wheat varieties at Rhotia and Mbulumbulu (1997<br />
1999): Scenario 3.<br />
Var:4ely ~d}. MC a . ' MRR: a<br />
". ','" ,, ' (Olor·<br />
• .yield<br />
Local 2000 280000 21000 259000<br />
Mbayuwayu 2149 300860 30894 269966 10966 9894 111<br />
Tausi 2271 317940 31626 286314 27314 10626 257<br />
Kware 2631 368340 33786 334554 75554 12786 591<br />
Assumptions: Price ofwheat grain = 140 Tshs/kg; Price ofwheat seed = 200 Tshs/kg;<br />
Additional cost for each 100 kg wheat over local yield = 600 Tshs (cost of bag and labor).<br />
aMNB, Me and MRR calculated by comparing each test variety with the local variety.<br />
Table 3a. MRR analysis for the four N rates at Rhotia and Mbulumbulu (1997-1999):<br />
Scenario 1.<br />
N-rate Adj. GFB " TCV'·" NB' , MNB· MC MRR<br />
(k~h~) yield --<br />
r< •• ':~ {<br />
..<br />
(0/0')<br />
. y<br />
0 1972 276080 0 276080<br />
30 2335 326900 16490 310410 34330 16490 208<br />
60 2276 318640 32780 285860 -24550 16290 D<br />
120 2418 338520 65360 273160 -12700 32580 D<br />
Assumptions: Price of wheat grain = 140 Tshs/kg; Price of 50 kg bag ofurea including<br />
transport = 12,500 Tshs; Application cost = 200 Tshs.<br />
Table 3b. MRR analysis for the four N rates at Rhotia and Mbulumbulu (1997-1999):<br />
Scenario 2. .<br />
"Nrate Adj. GFB T€.Y NB.' MNB. 'MC ';l\1RR<br />
:,..;.. :<br />
(kWba) yieht . . ." \ ~ '(0/0:)<br />
.~ , '<br />
;. ,<br />
.<br />
0 1972 236640 0 236640<br />
30 2335 280200 19100 261100 24460 19100 128<br />
60 2276 273120 38000 235120 -25980 18900 D<br />
120 2418 290160 75800 214360 -20760 37800 D<br />
Assumptions: Price of wheat grain = 120 Tshs/kg; Price of 50 kg bag ofurea including<br />
transport = 14,500 Tshs; Application cost = 200 Tshs.<br />
358
Response offour bread wheat varieties to N f ertilizer - Mansoor et al.<br />
Table 3c. MRR analysis for the four N rates at Rhotia and Mbulumbulu (1997-1999):<br />
Scenario 3.<br />
N rate AdJ. GFB TCV NB MNB Me' MRR <br />
(kwha)<br />
, yield<br />
". "<br />
(0/0) <br />
0 1972 276080 0 276080<br />
30 2335 326900 13910 312990 36910 13910 265<br />
60 2276 318640 27620 291020 -21970 13710 D<br />
120 2418 338520 55040 283480 -7540 27420 D<br />
Assumptions: Price of wheat grain = 140 Tshs/kg; Price of 50 kg bag of urea including<br />
transport = 10,500 Tshs; Application cost = 200 Tshs.<br />
Table 3d. MRR analysis for the four N rates at Rhotia and Mbulumbulu (1997-1999):<br />
Scenario 4.<br />
,, -<br />
N rate Adj. GFB TCV NB MNB MC MRR<br />
(kglha) yield (9/ 0 )<br />
0 1972 197200 0 197200<br />
30 2335 233500 21710 211790 14590 21710 67<br />
60 2276 227600 43220 184380 -27410 21510 D<br />
120 2418 241800 86240 155560 -28820 43020 D<br />
Assumptions: Price ofwheat grain = 100 Tshs/kg; Price of 50 kg bag of urea including<br />
transport = 16,500 Tshs; Application cost =200 Tshs.<br />
359
TIMING NITROGEN APPLICATION TO ENHANCE WHEAT GRAIN YIELDS <br />
IN NORTHERN TANZANIA<br />
M.L. Mugendi, C. Lyamchai, W.L. Mariki, and M. Israel<br />
SARI, P.O. Box 6024, Arusha, Tanzania<br />
ABSTRACT<br />
Previous research on wheat production in northern Tanzania indicated that<br />
there was no grain yield response to fertilizer application during seeding.<br />
However, the reported mean wheat yield obtained by small-scale farmers was<br />
only 1.2 tJha. In the current study, four rates of N were applied to 3 wheat<br />
varieties either during seeding or mid tillering to determine the effect of timing<br />
and rate of nitrogen application on wheat grain yield. <strong>The</strong> variety Selian 87<br />
outyielded Viri and Mbayuwayu during one wet season. <strong>The</strong> maximum grain<br />
yield was produced by an N rate of 120 kg/ha followed by the 60 and 30 kg/ha<br />
N treatments. At Mbulumbulu, grain yield was higher with the application of<br />
all 3 fertilizer rates during mid tillering vs. seeding. Results from economic<br />
analysis indicated that farmers can produce wheat profitably by applying 30<br />
kg/ha N at mid tillering when moisture is not limiting at that stage of<br />
development, and 60,kg/ha N during seeding when moisture is limiting.<br />
INTRODUCTION<br />
Nitrogen (N) plays a central role in plant biochemistry as an essential constituent of cell walls,<br />
cytoplasmic proteins, nucleic acids, chlorophyll, and a vast array of other cell components<br />
(Salisbury and Ross, 1990). Consequently, a deficient supply of N has a profound influence<br />
upon crop growth and may lead to a great loss in grain yield (Russel, 1973; Hay, 1981).<br />
Crop response to N application varies with rate and timing of N application in relation to plant<br />
development. <strong>For</strong> wheat grown in temperate countries, grain yield response is generally<br />
maximized when N is applied prior to stem elongation (Darwinkel, 1993). This common<br />
response has been linked to the observation that crop N demand increases sharply just prior to<br />
onset of the most rapid phase of crop growth that is stem elongation. Shortage of N during this<br />
period and subsequent shoot development, lead to increased shoot mortality, and smaller spike<br />
size which limit the final number of kernels per unit area (Hay and Walker, 1989). Thus,<br />
application of N relatively early in the life cycle of wheat tends to enhance grain yield more<br />
than applications after heading. Some evidence (Darwinkel, 1993) suggests that N application<br />
should occur immediately prior to period of peak N demand or onset of stem elongation. Hay<br />
and Walker (1989) speculated that this will result in minimizing N losses from leaching.<br />
<strong>The</strong> research work done on wheat N fertilizer in northern Tanzania has indicated that there was<br />
no grain yield advantage from N application, either applied in the seedbed or combine drilled<br />
with the seed (Nyaki et aI., 1993). Because of lack of consistent significant responses from<br />
fertilizer N application at the research level, wheat production in Tanzania does not utilize any<br />
supplementary N. However, the reported average wheat yield obtained by small-scale fmmers<br />
360
Timing N application to enhance wheat grain yield - Mugendi et al.<br />
was 1.2 tlha (Nyaki et ai., 1993). Nitrogen applied early may not be utilized by the plant but<br />
rather lost through leaching and or run off if there are heavy rains immediately after sowing.<br />
<strong>The</strong> relationship of timing N application to grain yield for wheat grown in the Northern Zone of<br />
Tanzania is not well known.<br />
Based on the above, a project was proposed with the following objectives: <br />
1) To determine the effect of timing ofN fertilization on wheat gTain yield in northern Tanzania <br />
2) To determine the optimum rate and timing of N feltilizer application to increase production <br />
at minimal cost. <br />
MATERIALS AND METHODS<br />
A split plot experiment with 3 replications was tested at Rhotia and Mbulumbulu in Karatu<br />
district, northern Tanzania for three years: 1997, 1998 and 1999. Three Tanzanian-developed<br />
wheat cultivars namely Viii, Mbayuwayu, and Selian 87 representing maturity ranges i) 80-90<br />
days, ii) 110-120, and iii) 120-130, respectively, were used in the trial. <strong>The</strong> 3 varieties were<br />
broadcast at a seed rate of 150 kglha in 3 x 3m plots, and then incorporated into the soil by<br />
rakes. Weeds were controlled by the application of Stomp immediately after seeding and<br />
Buctril MC at mid-tillering.<br />
<strong>Wheat</strong> cultivars used were: Al Viri, A2 Mbayuwayu, and A3 Selian 87. Rates of N application<br />
were: BI 0 kglha, B2 30 kglha, B3 60 kglha, and B4 120 kglha. Times ofN application were: CI<br />
All at seeding and C2All at mid-tilleling.<br />
Data collected included: i) Number of wheat plants and weeds/m 2 at 30 days after emergence,<br />
ii) biomass and iii) grain yield in t/ha. <strong>The</strong> data were subjected to statistical analyses using<br />
MSTA TC computer software. Significant treatments were separated using the Least Significant<br />
Difference (LSD) procedure.<br />
RESULTS AND DISCUSSION<br />
<strong>The</strong> wheat varieties tested at Rhotia, namely Viri, Mbayuwayu, and Selian 87, produced<br />
statistically similar mean grain yields of 2.28, 2.37, and 2.28 tiha, respectively (Table 2). This<br />
was not expected in a good environment where rainfall is not limiting like Karatu, especially in<br />
1997 and 1998 when this site received uniform rainfall (Table 5). In such an environment,<br />
Selian 87 is known to out yield Viri and Mbayuwayu because it is late maturing and utilizes the<br />
extra moisture efficiently. However, in 1997, a wet season, Selian 87 tended to outyield both<br />
Viri and Mbayuwayu. Higher grain yield was harvested in 1997 than in 1988 (Table 2).<br />
Although enough moisture was received in 1998, the 3 varieties were infected by Barley<br />
Yellow Dwarf Virus (BYD), which affected grain yield. <strong>The</strong> low grain yield in 1999 was<br />
attributed to moisture stress before grain filling. Under moisture stress, Salisbury and Ross<br />
(1990), found that abscisic acid, ABA, increased markedly in plant leaves and promoted root<br />
growih at the expense of the photosynthetic factory. In addition, Reddy (1983) reported that<br />
crop plants hastened maturity when moisture stress commenced after flowering leading to the<br />
reduction of crop duration. <strong>The</strong>se two factors of reduction of photosynthetic factory and crop<br />
duration of wheat during the dry season probably had a significant effect of reducing the mean<br />
grain yield of the varieties.<br />
361
Timing N application to enhance wheat grain yield - Mugendi et al.<br />
<strong>The</strong> grain yield from 4 fertilizer rates used was significantly different. Maximum grain yield<br />
was produced by the application of 120 kglha followed by 60 and 30 producing 2.79, 2.42, and<br />
2.21 tlha, respectively (Table 3). Optimum response to fertilizer application on grain yield was<br />
achieved by the application of 60 kglha. This is also supported by the economic analysis during<br />
the dry season (Table 1a). Biomass yield was highest with the application of 120 N followed by<br />
60 kglha N with mean biomass yields of 5.04 and 4.72 tlha, respectively (Table 3). Nitrogen<br />
influences wheat grain yield through its effects upon increased leaf size and longevity (Hay and<br />
Walker, 1989). This increased biomass can be well correlated with increased grain yield as it<br />
increases the photosynthetic factory.<br />
At Mbulumbulu site, the 3 varieties produced comparable mean grain yield. Mbayuwayu<br />
followed by Viri and Selian 87 produced 1.74, 1.65, and l.65 tlha, respectively. At this site, the<br />
4 fertilizer rates showed a positive interaction with the 2 periods of N application. <strong>The</strong> mean<br />
grain yields from each of 4 rates of N application during mid-tillering and seeding were<br />
comparable. However, examining the yield for the wet seasons in 1997 and 1998 and dry<br />
season in 1999 separately, indicated that moisture was the major factor in determining wheat<br />
yield. <strong>The</strong> grain yield was higher when fertilizer was applied during mid-tillering during the<br />
wet seasons. <strong>The</strong> optimum yield advantage of 0.26 tlha was achieved when 30 kglha N was<br />
applied during mid-tillering as compared to at seeding (Table 4). Grain yield response to higher<br />
rates of N fertilizer application during the wet seasons was a consequence of prolonged rainfall<br />
intensity, which caused leaching of nitrates beyond the root zone. <strong>The</strong> loss of nitrates was<br />
higher when the fertilizer was applied at seeding than at mid tillering, which was reflected in<br />
grain yield (Table 4).<br />
In contrast, when moisture was limiting as in 1999, the grain yield from each of 4 fertilizer<br />
rates during seeding was higher than at mid-tillering. <strong>The</strong> optimum yield advantage of 0.31 tlha<br />
was achieved when 60 kglha was applied at seeding as compared to mid-tillering (Table 4).<br />
Moisture is needed as a medium in which dissolved nutrients can be moved to the crop roots.<br />
When moisture was limiting, the applied N at mid-tillering was not effectively used by the<br />
plant because after flowering wheat plants hasten their maturity and crop duration is reduced.<br />
When fertilizer was applied during seeding, moisture was not limiting and it was efficiently<br />
utilized by the crop (Table 4).<br />
Nitrogen is important in determining the final grain yield of wheat during the rapid phase of<br />
crop development because it is required for higher rates of spikelet initiation, improvement of<br />
spikelet fertility, and increasing grains per fertile spikelet (Frank and Bauer~ 1982) and for<br />
biomass formation (Peterson and Frye, 1989). Although 120 kglha N was enough for spikelet<br />
fertility, this amount might have been excessive which could have created lodging and tiller<br />
mortality decreasing the final biomass yield for mid-tiller N application (Table 4).<br />
<strong>For</strong> economic analysis of applied N, a wheat farm gate price of 120 TShs/kg of wheat was<br />
used; 610 TShs/kg N; labor for fertilizer application on 1 ha cost 125 TShs.<br />
<strong>For</strong> the farmer to accept the technology (applying fertilizer to wheat), the MRR should not be<br />
less than 70%. <strong>The</strong> highest MRR was obtained by the application rate of 30 kglha N during<br />
seeding (Table la). However, for farmers who use 0 N, investing in 30 kglha N gives a very<br />
high return, but if these farmers stopped at 30 kglha N, they would miss the opportunity for<br />
further earnings at an attractive rate of return by investing in an additional 30 kglha N. <strong>The</strong>se<br />
farmers will continue to invest as long as the return to each extra unit of N invested, as<br />
measured by the MRR, are higher than the cost of extra unit invested. Based on the above,<br />
362
Timing N application to enhance wheat grain yield - Mugendi et al.<br />
fanners of Mbulumbulu will invest profitably by applying 60 kgllia N to wheat production<br />
when moisture is limiting. However, when moisture is not limiting, applying 30 kglha N during<br />
mid-tillering is profitable (Table 1 b).<br />
REFERENCES<br />
Darwinkel, A 1993. Ear fonnation and grain yield ofwinter wheat as affected by time ofN supply. Netherlands J.<br />
Agric. Sci. 31 :211-225.<br />
Frank, AB. and A Baeur. 1982. Effect of temperature and fertilizer N on apex development in spring wheat.<br />
Agronomy Journal 74:504-9.<br />
Hay, R.K.M. 1981. Chemistry for Agriculture and Ecology. Blackwell Scientific Publications, New York.<br />
Hay, R.K.M. and AJ. Walker. 1989. An Introduction to Physiology ofCrop Yields. John Wiley and Sons, New<br />
York.<br />
Nyaki, AS., Mansoor, M. and R. Ngatoluwa. 1993. Soil fertility and chemistry. Annual <strong>Wheat</strong> Coordinating<br />
Meeting. Arusha, Tanzania. 11-12 Nov. 1993.<br />
Peterson, G.A, and W.W. Frye. 1989. Fertilizer Nitrogen Management. In: R.F. Follet (ed.). Nitrogen<br />
Management and Ground Water Protection. Elsevier, Amsterdam.<br />
Reddy, SJ. 1983. Crop Water Use Study using Lysimeters. ICRISAT, Patancheru, AP., India.<br />
Russel, E.W. 1973. Soil Conditions and Plant Growth. Longman Publishing Company, New York.<br />
Salisbury, F.B., and C.W. Ross. 1990. Plant Physiology. Wadsworth Publishing Company, Belmont, California.<br />
Questions and Answers:<br />
Wolfgang H. Pfeiffer: (1) With 30 kg Nlha, biomass increased by 0.4 tlha; moving from 30<br />
60 N produced +0.6 tlha. Since straw is of economic value, should the value of straw + grain<br />
be taken into account for N recommendation and in economic analysis? (2) Why no split<br />
application ofN, e.g. 25%175%?<br />
Answer: (1) Straw in Karatu district does not have any economic value. After harvesting,<br />
straw is left to be eaten by free-range animals. (2) Split N application currently being tested<br />
by my colleague.<br />
Orner H. Ibrahim: In studies addressing timing of fertilizer N application, it is essential to<br />
define the soil type to reach solid recommendations.<br />
Answer: Yes. I agree with you! <strong>The</strong> soil type of the sites where the experiment was<br />
conducted was Nitosol.<br />
Izzat S.A. Tahir: Your economic analysis showed that using 60 kglha N at seeding under<br />
moisture-stressed conditions is the best. Do you advise fanners to use more nitrogen under<br />
these conditions rather than the 30 kglha N under nonnal conditions?<br />
Answer: No! I don't advise fanners to use more N under stressed conditions: 60 kg/ha N<br />
during seeding in this experiment yielded higher probably because moisture was available<br />
after seeding, but was not available at mid-tillering.<br />
363
Timing N application to enhance wheat grain yield - Mugendi et al.<br />
Table la. Economic analysis of applying nitrogen to wheat during dry season 1999.<br />
Nrate Grain ~FB 'F€W:;' " "" NB, MC "MNB: %<br />
(kg/ha) (kg/ha) , (TShs) . (TShs) ".(18I1s) ,(TShs) " (a:'Shs) -MM<br />
0 Seeding 1190 142800 0 142800 NA NA<br />
0 TiUering 1170 140400 0 140400 NA NA<br />
30 Seeding 1620 194400 18425 175975 18425 33175 180<br />
30 Tillering 1350 162000 18425 143575 18425 3175 17<br />
60 Seeding 1880 225600 36725 188875 18300 12900 70<br />
60 Tillering_ 1472 176640 36725 139915 18300 D<br />
120 Seeding 1930 231600 73325 158275 36600<br />
120 TillerinR 1570 188400 73325 115075 36600<br />
Table lb. Economic analysis of applying nitrogen to wheat during wet season in 1998.<br />
N rate Grain FB TCV . NB MC MNB 0/0<br />
(kglha) (kWba) (TShs) (TShs) ITShs) . (TShs) (TSbs) MRR<br />
0 Seeding 1370 164400 0 164400 NA NA<br />
0 Tillering 1370 164400 0 164400 NA NA<br />
30 Seeding 1790 214800 18425 196375 18425 31975 173<br />
30 Tillering 1860 223200 18425 204775 18425 40375 219<br />
60 Seeding 1910 229200 36725 192475 18300 D<br />
60 Tillering 1970 236400 36725 199675 18300 D<br />
120 Seeding 2150 258000 73325 184675 36600<br />
120 TillerinR 2280 273600 73325 200275 36600<br />
Table 2.<br />
Mean grain yield (t/ha) of 3 wheat varieties over 3 years at Rhotia<br />
averaged over 4 rates of Nand 2 application timings .<br />
' .<br />
V:~r:iety 1997 . '1998:' - ' 1999 .·1\1ean<br />
Viri 3.36 1.90 1.58 2.28<br />
Mbayuwayu 3.28 2.00 1.82 2.37<br />
Selian 87 3.44 1.80 1.61 2.28<br />
Mean 3.36 1.9 1.67 2.31<br />
LSD(0.05) 0.68 0.63 0.45 0.66<br />
C.V.(%) 8.21 21.49 13.91 19.43<br />
364
Timing N application to enhance wheat grain yield - Mugendi et al.<br />
Table 3.<br />
Mean biomass and grain yield (t/ha) over 3 years at Rhotia averaged over<br />
3 varieties and 2 application timings.<br />
Nrate f?9'Z 1998 '. . f999.,, ". Me~n<br />
(kg/ha) Grain'·: .'J3iQWass Grain' ':BI~JPa~s Grain' BiQmass Crain<br />
0 2.19 3.33 1.53 4.02 1.54 3.68 1.75<br />
30 3.35 3.95 1.70 4.22 1.59 4.09 2.21<br />
60 3.71 5.07 2.01 4.37 1.55 4.72 2.42<br />
120 4.19 5.32 2.44 4.75 1.75 5.04 2.79<br />
Mean 3.36 4.42 1.92 4.34 1.60 4.38 2.29<br />
LSD 0.51 0.85 0.33 0.38 0.32 0.55 0.52<br />
C.V.(%) 8.21 18.71 21.49 13.16 13.91 19.44 13.46<br />
Table 4.<br />
Mean biomass and grain yield (t/ha) over 3 years at Mbulumbulu<br />
averaged over 3 varieties.<br />
N'rate 1997 19,8 1999 Mean<br />
(kglha)<br />
"<br />
Grain Biomass Grain' Bioma~s' Grain' . Biomass Grain<br />
0 Seeding 3.04 3.47 1.38 3.20 1.19 3.34 1.87<br />
0 Tillering 3.00 3.94 1.39 3.26 1.24 3.60 1.88<br />
30 Seeding 4.10 4.46 1.79 4.11 1.62 4.29 2.50<br />
30 Tillering 4.55 4.71 1.86 3.66 1.34 4.19 2.58<br />
60 Seeding 4.51 4.58 1.91 4.87 1.78 4.73 2.73<br />
60 Tillering 4.56 4.83 1.97 4.00 1.47 4.42 2.67<br />
120 Seeding 4.60 6.29 2.15 5.01 1.93 5.65 2.89<br />
120 Tillering 4.77 5.80 2.28 4.20 1.57 5.00 2.87<br />
Mean 4.14 4.76 1.84 4.04 1.52 4.40. 2.49<br />
LSD 0.24 1.38 0.36 0.38 0.10 0.14 0.22<br />
C.V.(%) 5.76 29.81 20.16 19.38 9.44 24.54 17.88<br />
Table 5.<br />
Rainfall data (mm) for 3 years at Rhotia; Karatu District, Northern<br />
Tanzania.<br />
M9nth 1997 '1998, 11999<br />
January 0 159.8 11.8<br />
February 24.5 91.6 58.5<br />
March 122.5 105.5 32.5<br />
April 347.8 237.9 252.9<br />
May 154.4 158.9 232.4<br />
June 62.9 0 59.3<br />
July 13 0 22.1<br />
August 0 0 0<br />
September 0 0 0<br />
October 70.6 0 0<br />
November 189.6 0 0<br />
December 638.6 0 11.5<br />
365
DELAYED NITROGEN APPLICATION AND LATE TILLER PRODUCTION <br />
IN WHEAT GROWN UNDER GREENHOUSE CONDITIONS <br />
I.A. Adjeteyl and L.c. Campbe1l 2<br />
IDept. of Crop Science, National University of Lesotho, P.O. Roma 180, Lesotho<br />
2School of Crop Sciences, University of Sydney, NSW 2006, Australia<br />
ABSTRACT<br />
Delaying application ofN to wheat until the time ofheading or beyond increased<br />
grain protein content rather than grain yield. In a previous unreported glasshouse<br />
experiment by the current authors, application of high amounts ofN (700 mg N<br />
porI of 2 1 volume) at the time of anthesis stimulated the production of fresh<br />
tillers in the post-anthesis period in spring wheat. This phenomenon is not of<br />
common occurrence. <strong>The</strong> current study examined the levels of tissue N<br />
concentration in the post-anthesis period that triggered late tiller production; it<br />
also examined the grain production potential of these late tillers, by providing<br />
them with adequate moisture under glasshouse conditions even after early season<br />
tillers had reached maturity. In two treatments in the glasshouse, N was applied<br />
at 250 and 700 mg poC I at sowing. In six other treatments, 250 mg N porI was<br />
applied at sowing and a second dose of450 mg N porI was applied at 0, 5, 10,<br />
15,20 and 30 days after anthesis. Stimulation oflate tiller production occurred<br />
when N was applied at any time during the first 30 days after anthesis. However,<br />
the contribution of late tillers to grain yield planC I declined as the time of N<br />
application was delayed post-anthesis. Also, the leafN concentration at which the<br />
production of late tillers was stimulated varied according to the time of N<br />
application in the post-anthesis period. Of all the split treatments, application of<br />
N at anthesis produced the largest grain yield per plant due to a 36% contribution<br />
from late tillers. We conclude that late tillers can make a useful contribution to<br />
grain yield plane l under glasshouse conditions. However, the long time lag<br />
between the maturity of early and late season tillers may pose practical<br />
difficulties to harvesting, even if the same phenomenon were to be duplicated<br />
under field conditions.<br />
INTRODUCTION<br />
Application ofN fertilizer generally increases the grain yield ofwheat (Ellen and Spiertz, 1980;<br />
Benzian and Lane, 1981) and the responses are high ifthe N is applied early in the season, e.g.,<br />
up to the time of tillering and commencement of stem elongation when crop demand is greatest<br />
(Mossedaq and Smith, 1994). When applied around anthesis, with adequate moisture under field<br />
conditions, however, grain protein is increased (Strong 1982; Smith et al., 1989; Randall et al.,<br />
1990), but yield responses are poor (Mossedaq and Smith, 1994). Previous unreported glasshouse<br />
observations by the current authors, showed that high rates of N application near the time of<br />
anthesis, stimulated the production of fresh tillers in the post-anthesis period, in a spring wheat<br />
cultivar 'Hartog' grown in pots. As these late tillers were presumed to be nonproductive,<br />
watering was terminated when the early season tillers senesced, and hence the late tillers did not<br />
366
Delayed N application and late tiller production in wheat - Adjetey and Campbell<br />
contribute to grain yield. <strong>The</strong> importance of these late tillers to grain· development, which was<br />
not examined in that experiment, forms the basis for this study, in view of the reported poor grain<br />
yield responses to N applied late in the season (Mossedaq and Smith, 1994).<br />
In this study a serial application ofN at anthesis and the 30 day period thereafter was examined.<br />
<strong>The</strong> objectives were:<br />
a) to establish the levels of post-anthesis shoot N concentration that stimulate the<br />
production of late tillers, and<br />
b) to examine the contribution of late tillers to grain yield under well-watered conditions<br />
in the glasshouse.<br />
MATERIALS AND METHODS<br />
Free draining 2.5 I plastic bags were filled to within 2 cm of the top with a mixture of peat moss<br />
and sand (2:3 v/v) and a nutrient solution which excluded only N. Calculated amounts of<br />
ammonium nitrate, dissolved in water, were added during mixing, according to the N treatments<br />
below.<br />
<strong>Wheat</strong> cv. Hartog was grown in a greenhouse at a controlled day/night temperature of 18/13 DC<br />
and eight N treatments were imposed. In two treatments, N was applied at 250 and 700 mg pori<br />
at the time of sowing. In the other six treatments, 250 mg was applied at the time of sowing, and<br />
the second dose of 450 mg N pori was applied at 0,5, 10, 15,20 and 30 days after anthesis.<br />
<strong>The</strong>se treatments are subsequently referred to as AO, A5, AlO, A15, A20 and A30, respectively.<br />
<strong>The</strong> experiment was set up as a randomized complete block design with 3 replicates. Each<br />
treatment within a block comprised eight pots. Six seeds were sown pori and thinned to three<br />
plants one week after seedling emergence. A series of harvests was made at anthesis, 10, 15,20,<br />
25,30,40 and 54 days after anthesis (DAA) and at maturity (including maturity of late tillers at<br />
114 DAA). <strong>The</strong> first harvest of treatments AO through to A30 was made 10 days after each<br />
treatment commenced. Plants were adequately watered until the final harvest.<br />
Determination of Dry Matter and Nitrogen Concentration<br />
At each harvest, plant samples were separated into green leaf, culm and grain (where applicable).<br />
All plant parts were dried separately at 70 DC for 48 h, weighed and their N concentrations<br />
determined using a micro-Kjeldahl procedure. Only leaf N concentration is reported in this text.<br />
RESUL TS AND DISCUSSION<br />
Nitrogen Concentration in Shoot and Tiller Production<br />
Stimulation of late tillers occurred when N was applied at any time during the first 30 days after<br />
anthesis. Also, the leafN concentration at which the late tillers were stimulated varied according<br />
to the time ofN application in the post-anthesis period (Table 1). Indeed, tissue Nat 15 DAA<br />
in the green leaf in treatment AO, for example, was 4.2% in comparison with values less than 3%<br />
in N250. With the last N application (A30), green leaf N was only about 2.8% at 55 DAA,<br />
corresponding to 15 days after N application in that treatment, yet tillers were still produced.<br />
Again, by that time N250 had almost completely senesced. Thus, with delayed N applications,<br />
the leaf N concentration at which late tiller formation was stimulated, was lower than similar<br />
applications close to the time of anthesis.<br />
367
Delayed N application and late tiller production in wheat - Adjetey and Campbell<br />
Tiller Production<br />
Late tiller production occurred when N was applied at any time during the first 30 DAA. Also,<br />
in the split N treatments, the time of N application had little influence on the number of late<br />
tillers produced. However, there were more productive late tillers when N was applied at<br />
anthesis. (Table 2).<br />
Grain Yield<br />
When N was applied at sowing, total grain yield per plant increased from 3320 mg in N250 to<br />
5934 mg in N700 (Table 3). Such responses to N are commonly reported (Spiertz and Ellen,<br />
1978; Strong, 1982). With split treatments, application of N from anthesis until 15 DAA<br />
produced the highest grain yield per plant due to the relatively large contribution of grain by late<br />
tillers (Table 3), which provided up to 36% of the total yield per plant as in AO. However, the<br />
percentage contribution by the late tillers declined in A30. Such grain yield production by late<br />
tillers is not commonly reported. Instead, late application of N has been associated with<br />
increased grain N content - which was also observed in this study. <strong>The</strong> contribution by main<br />
stems or early productive tillers generally did not differ between the split treatments (P>0.05).<br />
Production of late tillers has reportedly occurred when wheat plants were recovering from water<br />
deficits (Talukder et al. j 1987). In this experiment and that of Talukder et al. (1987), it is less<br />
likely that increase in water or N supply would cause differentiation of cells in the stem into tiller<br />
initials. Instead, it is possible that the tiller initials were present in a latent state and were<br />
stimulated to grow in response to the extra assimilates from photosynthesis.<br />
CONCLUSION<br />
We conclude that plants can absorb N that is applied late in the growing season. This N can<br />
increase tissue N concentration when applied within 30 days after anthesis. Nitrogen application<br />
after anthesis is also capable ofstimulating the production of late tillers, perhaps when the plant<br />
reaches a critical N concentration after anthesis; these tillers can contribute up to a 36% increase<br />
in grain yield in pots. Such a response to an anthesis or post-anthesis N application does not<br />
appear to be of common occurrence in wheat, which is characterized as a determinate crop. If<br />
the greenhouse results were duplicated in the field, the long time lag, up to 40 days, between<br />
maturity of early and late season tillers would pose practical problems to mechanical harvesting.<br />
REFERENCES<br />
Benzian, B. and Lane, P. 1981. Interrelationship between nitrogen concentration in grain, grain yield and added<br />
fertilizer nitrogen in wheat experiments in south-eastern England. J. Sci. Food Agric. 32: 35-43.<br />
Ellen, J. and Spiertz, J.H.J. 1980. Effect of rate and timing of nitrogen dressing on grain yield formation of<br />
winter wheat (Triticum aestivum L.). Fert. Res. I: 177-190.<br />
Mossedaq, F. and Smith, D.H. 1994. Timing nitrogen application to enhance spring wheat yields in a<br />
Mediterranean Climate. Agron. J. 86: 221-226.<br />
Randall, P.l, Freeney, lR., Moss, H.J., Wrigley, C.W. and Galbally, L.E. 1990. Effects of addition of nitrogen<br />
and sulphur to irrigated wheat at heading on grain yield, composition and milling and baking quality.<br />
Aust. J. Agric. Res. 30: 95-101.<br />
Smith, C.J., Whitfield, D.M., Gyles, A.G. and Wright, G.c. 1989. Nitrogen fertilizer balance of irrigated wheat<br />
grown on a red-brown earth in south-eastern Australia. Field Crops Res. 21: 269-275.<br />
Spietz, J.H.J and Ellen, J. 1978. Effects of nitrogen and crop development and grain growth of winter wheat in<br />
relation to assimilation and utilization of assimilates and nutrients. Neth. J. Agric Sci. 25: 210-231.<br />
Strong, W.M. 1982. Effect of late application of nitrogen on yield and protein content of wheat. Aust. J. Expt.<br />
368
Delayed N application and late tiller production in wheat - Adjetey and Campbell<br />
Agric. Anim. Hus. 22: 54-6l.<br />
Talukder, M.S.V., Mogensen, V.O. and Jensen, H.E. 1987. Grain yield of spring wheat in relation to water stress<br />
I Effect of early drought on development of late tillers. Cereal Res. Commun. 15: 101-107.<br />
Table 1.<br />
Nitrogen concentration (%) of green leaf of wheat 10-15 days after<br />
fertilizer application for a particular treatment during the post anthesis<br />
period.<br />
Tre'atment<br />
Hays after anthe'~is<br />
0 10 15<br />
.,<br />
20 3.0 40 54<br />
N250 2.8<br />
N700 4.8 3.0 2.6 2.8 1.7 1.5 -<br />
AO 4.8 4.5 4.2 4.2 3.9 2.3 2.3<br />
A20 - 4.0 4.2 4.1 3.5 2.3 2.7<br />
A30 - - - - - 2.2 2.8<br />
Table 2.<br />
Effect of nitrogen on the number of productive tillers and late tillers of<br />
wheat cv. Hartog under controlled temperature greenhouse conditions.<br />
<br />
<br />
Treatment , Tiller numbers<br />
Main.stem + Late productive Total late tillers<br />
early tillers<br />
tillers<br />
N250 2.1 -<br />
N700 3.2 -<br />
AO 2.2 2.7 2.7<br />
A5 2.2 1.9 1.9<br />
AlO 2.1 1.4 1.4<br />
A15 2.0 1.7 1.4<br />
A20 2.1 2.1 1.9<br />
A30 2.0 1.4 2.5<br />
LSD(o.o5) 0.52 NS NS<br />
Table 3.<br />
Effect of nitrogen on the grain yield of main stems, early productive<br />
tillers and late tillers of wheat cv. Hartog grown under controlled<br />
temperature greenhouse conditions.<br />
Treatmep.t<br />
..,<br />
Grahi ' Y(el(l '~·nigplant"': l j<br />
······MS . "EPT .... ' LPT ... 'Total<br />
N250 1896 1425 0 3320<br />
N700 2338 3596 0 5934<br />
AO 2804 1833 2595 7232<br />
A5 2456 2078 1238 5773<br />
A10 2850 2138 728 5786<br />
A15 2704 1913 1132 7544<br />
A20 2761 2086 501 5344<br />
A30 2244 1507 642 4392<br />
I LSD {Q
RESPONSE OF WEED INFESTATION AND GRAIN YIELD OF WHEAT <br />
TO FREQUENCY OF TILLAGE AND WEED CONTROL METHODS <br />
UNDER RAINFED CONDITIONS AT ARSI NEGELLE, ETHIOPIA <br />
Tenaw Workayehu<br />
P.O. Box 366, Awassa, Ethiopia<br />
ABSTRACT<br />
Weed infestation results from poor land preparation, often as a result of a<br />
shortage of labor and/or oxen. Research was conducted at Arsi Negelle in<br />
southern Ethiopia to evaluate the effect of repeated tillage and weed control<br />
methods on weed infestation and grain yield of wheat for three consecutive<br />
seasons from 1996-1998. Five tillage practices (zero-till, one, two, three, and<br />
four pIowings) were compared under four weed control methods (Duplosan at<br />
2.5 l/ha, Duplosan together with one handweeding at 30 DAE, one<br />
handweeding at 30 DAE, an.d two handweedings at 30 and 60 DAE).<br />
Broadleaf weeds. comprised 73% of the total weed population. Repeated<br />
tillage reduced weed infestation and increased the grain yield of wheat. Weed<br />
density was 79 and 34% higher under zero-till and three plowings in<br />
comparison to four plowings. <strong>The</strong> yields from two (1257 kg ha- 1 ) and three<br />
plowings (1795 kg ha- 1 ) were 42 and 18% lower, respectively, than four<br />
plowings. Weed infestation was negatively correlated with tillage frequency<br />
(r=-0.96) and grain yield (r=-0.98). Multiple regression analysis indicated that<br />
83, 88 and 61 % of the total variation in yield. during 1996, 1997 and 1998,<br />
respectively, was attributable to tillage. Handweeding twice reduced weed<br />
populations and increased grain yield, while plots treated with Duplosan alone<br />
had 49% more weeds. In conclusion, the highest frequency of tillage reduced<br />
weed infestations and increased grain yield.<br />
INTRODUCTION<br />
<strong>Wheat</strong> is a major crop in the Arsi Negelle and Shashemene areas at altitudes near 1,990 m<br />
a.s.1., and covers about 13.7% of the total cultivated area. Shortage of oxen and labor<br />
constrain wheat production. A pair of oxen is needed to till the land well, but many farmers<br />
own only a single ox and fail to prepare the land well. Often farmers practice 2 to 3 plowings<br />
for wheat planting (Yohannes, 1982), and this has increased infestation of both broad leafand<br />
grass weeds resulting in low productivity of wheat. Under such condition, wheat grain yield<br />
ranges from 600 to 2500 kg ha- 1 , in fact, depending on soil type, weather conditions and crop<br />
management factors. Tillage practices vary with prevailing weather conditions and influence<br />
soil moisture (Kamwaga, 1989; Johnson et al., 1989). Various studies indicate that repeated<br />
tillage creates conducive conditions for better plant growth and grain yield. Getinet (1988)<br />
reported four plowings either on red or dark gray soil produced higher grain yield of wheat.<br />
<strong>The</strong> study by Dhinam and Sharma (1986) as cited by Majid et al. (1988) showed that six<br />
plowings in comparison with five and no-till resulted in a higher grain yield of wheat.<br />
Jongdee (1994) and Dawelbeit and Salih (1994) reported similar results. <strong>The</strong> reason for<br />
higher yield of wheat, according to Jongdee (1994), was due to lower bulk density and<br />
370
Response ofweed infestation and grain yield to frequency oftillage and weed control- Tenaw<br />
superior root growth, which indirectly increased grains/spIke, biomass and grain yields.<br />
Repeated tillage stimulates weed seed germination before the final tillage and reduces the<br />
seed bank and subsequent weed densities (Johnson et aI, 1989). <strong>The</strong> findings of Dorado et al.<br />
(1998), Thompson and Whitney (1998) and ICARDA (1984) showed that weed density was<br />
more in no-till plots than from repeated plowings. Weed infestation due to repeated tillage<br />
was reduced by more than 50% compared with zero tillage (ICARDA, 1984).<br />
<strong>The</strong> result achieved by Thompson and Whitney (1998) showed poor crop stands from no-till<br />
plots. Similarly, Kreuz (1993) in his investigation has obtained lower seedling density,<br />
number of spikes m- 2 , and straw yields from zero-till plots. Wallace and Bellinder (1989)<br />
found decreased potato stand by 16% with reduced tillage when averaged over seasons. <strong>The</strong><br />
report of the above-mentioned researchers showed that the yield of potato in reduced plots<br />
decreased an average of 22% compared to yields in conventionally tilled plots while in other<br />
years no difference was detected between tillage systems. On the contrary, reduced tillage<br />
and zero-till can produce a similar yield as that of repeated tillage provided that straw mulch<br />
is applied. Aulakh and Gill (1988) reported that zero tillage, due to retention of crop residue<br />
on top of the soil, had more yield and lower bulk density than conventional tillage. Zero<br />
tillage applied with straw mulch had more grains/spike and gave similar grain yields of wheat<br />
as compared to repeated tillage of 6 to 8 plowings (Majid et al. (1988). <strong>The</strong> reason for the<br />
better performance of zero till was due mainly to uniform placement of seeds, which resulted<br />
in better plant emergence and less weed infestation than the conventional. Brecke and<br />
Shilling (1996) indicated higher yield from zero till due to reduced weed competition. Stobbe<br />
(1989) and Jongdee (1994) advocated the importance of straw mulch in minimum (zero)<br />
tillage for better performance and grain yield of wheat. Other researchers (Aulakh and Gill,<br />
1988) also confirmed that due to retention of crop residue on the soil, yields from zero tillage<br />
were higher and soil bulk density was lower than the conventional tillage.<br />
Minimum tillage can cost less since the power and time requirement is minimal (Dawelbeit<br />
and Salih, 1994; Stobbe, 1989). In addition, minimum tillage allows earlier plahting, reduces<br />
soil erosion and there can be less potential for pesticide contam~nation of surface water<br />
(Brecke and Shilling, 1996). <strong>The</strong> result achieved by Macharia et al. (1997) showed that<br />
significant difference was not detected on wheat yield due to tillage systems in the first three<br />
consecutive seasons. Kamwaga (1989) found no significant variation in yield between the<br />
conventional and other tillage practices for two years at various locations because of well<br />
distributed precipitation. He noted that with erratic rainfall, minimum tillage could produce<br />
higher grain yield of wheat.<br />
<strong>The</strong> overall objective of this study was, therefore, to investigate the effect of repeated tillage<br />
and weed control on weed infestation, growth and grain yield of wheat.<br />
MATERIALS AND METHODS<br />
<strong>The</strong> study was conducted at Arsi Negelle in the Southern Region of Ethiopia for three<br />
consecutive years, 1996-98. <strong>The</strong> wheat variety, Dashen, was sown at a seed rate of 125 kg<br />
ha- I . Diammonium phosphate was applied at planting to supply 18 and 20 kg ha- I nitrogen<br />
and phosphorus, respectively. Tillage was with the traditional ox-drawn plow. Glyphosate<br />
was applied at 4.5 I ha- 1 15 to 20 days before sowing for the zero-tillage plots. Seed was<br />
drilled with 20 cm row spacing. <strong>For</strong> the zero-tillage, seed was sown in furrows made using<br />
hoes, and fertilizer was side banded. Planting dates were 22 July 1996 and 1997, and 4 Aug.<br />
371
Response ofweed infestation and grain yield to frequency oftillage and weed control - Tenaw<br />
1998.<br />
<strong>The</strong> treatments were: plowing frequency (no-till, 1, 2, 3,and 4 pi owings at an interval of 15<br />
days for the repeated plowings); and weed control methods (D2.5 = Duplosan at 2.5 llha,<br />
D2.5 +1 HW = Duplosan plus one hand weeding at 30 days after emergence (DAE); 1 HW =<br />
one hand weeding, and 2HW = Two hand weedings at 30 and 60 DAE). <strong>The</strong> plot size was 15<br />
rows with 0.2 m row spacing by 5 m length. Data on weed types and population m- 2 , plant<br />
height, spike length, grains per spike, kernel weight, biomass and grain yields were taken. A<br />
quadrat of 25 by 25 cm was used for weed count and the population was averaged over four<br />
throws for each plot.<br />
DMRT was used to differentiate treatment means (Gomez and Gomez, 1983). Simple<br />
correlation and multiple regression analysis were made. <strong>The</strong> model used for mUltiple<br />
regression analysis was:<br />
where Y = grain yield (kg ha- I ), T = tillage frequency, and W = weed control method.<br />
RESULTS<br />
Moisture stress was severe during 1998 crop season with intermittent shortages of rainfall<br />
beginning at sowing time, and this seriously affected the crop. Precipitation was plentiful in<br />
1996 and adequate in 1997. Under the moisture stress conditions of 1998, plots plowed three<br />
and four times had relatively better growth and grain yield, possibly due to conservation of<br />
soil moisture and reduced weed competition.<br />
Weed type and population density: Broadleafweeds dominated and comprised about 73%<br />
of the total weed population. <strong>The</strong> major weeds observed were Galinsoga parvijlora, Bidens<br />
pilosa and Nicandra physalodes (Table 1). Weed population varied behveen the two years of<br />
this study. <strong>The</strong> reduction in weed density with increased tillage was significant in 1997. <strong>The</strong><br />
respective mean increases of weed population in zero-till and two plowings over four times<br />
were 79 and 59%. Four plowings had the lowest weed infestation in each level of weed<br />
control. Frequency of plowing is negatively correlated with weed population (Fig. 1). <strong>The</strong><br />
lowest weed population density was observed on plots weeded twice. Weed density was 49<br />
and 24% more in plots treated with Duplosan (D2.5 and D2.5 + IHW) as compared with two<br />
weeding, respectively (Fig. 4).<br />
Plant height (cm): Plant height increased as the number of piowings increased, and the mean<br />
height was 16 and 6 cm more with four piowings as compared to two and three, respectively.<br />
This was consistent across seasons and is attributed to better seedbed preparation and reduced<br />
weed competition in all growing seasons. Plant height had a positive and significant<br />
association with spike length, biomass and grain yields but a negative correlation with density<br />
of weeds (Table 2). With greater plant height, spikes were longer and more biomass was<br />
produced.<br />
Spike length (cm): In 1997 and 1998, spike length increased with the number of plowings.<br />
<strong>The</strong> mean spike length was 42, 33 and 14% greater for four pIowings as compared to no-till,<br />
one and two plowings, respectively (Fig. 2).<br />
372
Response ofweed infestation and grain yield to frequency oftillage and weed control - Tenaw<br />
Thousand-kernel weight (TKW) and grains/spike: Kernel weight was more in one and two<br />
hand weedings during 1997. Number of plowings did affect TKW. Grains per spike were<br />
more with four plowings and grains/spike were 50, 25, and 11 % less in zero till, two and<br />
three plowings, respectively.<br />
Biomass yield: <strong>Wheat</strong> biomass increased with more plowing. Even under serious moisture<br />
stress (1998), repeated plowing increased the biomass both in the three and four plowings<br />
(Fig. 2). <strong>The</strong> average increases in biomass from four and three plowings over two were 154<br />
and 92%, respectively.<br />
Grain yield: In all seasons, yield increased as frequency of plowing increased even under<br />
low moisture conditions of 1998. Significant yield variations among zero-till, one and two<br />
pi owings were not observed in 1997 and 1998. Yields were 58, 54, 42 and 18% less in no-till,<br />
one, two and three plowings, respectively, in comparison to four plowings, which gave,<br />
averaged over weed control and seasons, 2180 kg ha'i (Fig. 3). Grain yield was positively<br />
correlated with plant height, spike length, grains per spike and biomass yield, while density<br />
of weeds was negatively correlated with grain yield (Table 2). Frequency of tillage was<br />
linearly associated with grain yield and 83, 88 and 61 % of the total variation in grain yield<br />
during 1996, 1997,and 1998, respectively, was mainly attributed to frequency of tillage<br />
(Table 3). <strong>The</strong> highest yield (1517 kg ,ha- I ) was obtained from plots weeded twice (Fig. 4).<br />
<strong>The</strong> yields obtained from the application of Duplosan 2.5 I ha'i alone and its combination<br />
with one hand weeding were 9 and 5% less as compared to hand weeding twice while<br />
weeding once gave 1386 kg ha- I .<br />
DISCUSSION<br />
Repeated tillage created conducive conditions and favored plant establishment, growth and<br />
production. Dawelbeit and Salih (1994), Getinet (1988), and Chugunov et al. (1988) reported<br />
advantages of tillage frequency, including good seedbed preparation. Our results confirm that<br />
more plowing results in better growth and thus faster plant development probably because of<br />
reduced crop-weed competition and possibly better root growth. Weed density was less<br />
probably due to reduced weed seed numbers in the soil with repeated plowing. <strong>The</strong> reports of<br />
Thompson and Whitney (1998), Johnson et al. (1989), and ICARDA (1984) also showed low<br />
weed infestation in conventional (repeated) tillage. Thompson and Whitney (1998) reported<br />
high weed density, poor emergence and increased weed competition with zero-tillage. <strong>The</strong><br />
result of Majid et al. (1988), and Brecke and Shilling (1996), however, showed low weed<br />
population in minimum tillage. Brecke and Shilling (1996) indicated more weed biomass of<br />
sicklepod (45% greater) in conventional cf. no tillage. Weed population of redroot pigweed<br />
was found to increase in reduced tillage as compared to conventional tillage (Wallace and<br />
Bellinder, 1989).<br />
Hand weeding twice was found to be effective in controlling weed infestation and increased<br />
grain yield of wheat. Other findings (ICARDA, 1984) also detected that handweeding was<br />
most effective for weed control and reduced weed infestation and dry weight of weeds and<br />
was better than chemical weed control. However, significant variation in yield of wheat was<br />
not observed between hand weeding and chemical control. Chugunov et al. (1987) also<br />
reported reduced weed population and higher yield of wheat due to twice handweeding. <strong>The</strong><br />
negative association between tillage frequency and weed population shows the response to<br />
repeated tillage in reducing weed density, which negatively affected grain yield. Kreuz<br />
(1993) reported that no-till significantly reduced seedling density, spikes m'2, and straw yield<br />
373
Response ofweed infestation and grain yield to frequency oftillage and weed control - Tenaw<br />
and had no effect on grain yield of wheat which is contrary to our result, which showed<br />
significantly lower yield in no-tillage. Kreuz did find that biomass yield was significantly<br />
reduced in no-till plots. <strong>The</strong> result of this study shows that because of favorable conditions<br />
created by repeated plowing, there was greater plant . height, more biomass and less weed<br />
infestation and this had a positive effect on grain yield of wheat.<br />
This study is not in line with the findings of Aulakh and Gill (1988) where they reported the<br />
non-significance of tillage system (conventional and no tillage) on plant height and seed<br />
weight of wheat. In this study, repeated tillage helped in reducing weed competition for<br />
moisture which probably was important in 1997 and 1998 resulting in improved yield and<br />
yield-related characters of wheat. Probably repeated tillage, besides reducing weed<br />
competition, helped in situ soil moisture conservation, in particular in stress periods, which<br />
was utilized by wheat that produced higher grain yield. This is reflected by the positive<br />
response in plant height, spike length, grains/spike, and biomass yield which have positive<br />
significant correlations with yield. In contrast Dorado et al. (1998) obtained better barley<br />
yield under drier conditions with reduced tillage. <strong>The</strong> findings ofJongdee (1994) and Dhinam<br />
and Sharma (1986) indicated that repeated plowing increased the biomass of wheat. Because<br />
of reduced weed competition for moisture and soil nutrients and presumably in situ moisture<br />
conservation that resulted from repeated tillage, there were better seed emergence and more<br />
yields. In general, tillage frequency had a positive and significant effect on yiel d and yieldrelated<br />
characters of wheat.<br />
Weed infestation, which is the result of poor land preparation and unavailability of labor to<br />
weed on time, is one of the major production constraints in wheat field. This study showed<br />
that repeated tillage reduced weed infestation and· increased plant height, biomass and grain<br />
yields. Because of reduced crop-weed competition even during moisture stress periods, there<br />
was a positive crop response to frequency of tillage, which is reflected by an increase in<br />
yield. <strong>The</strong> yield loss decreased as frequency of plowing increased. Poor crop performance<br />
was observed on minimum tillage treatments (zero-till and one-time plow) that resulted in<br />
low yield particularly as moisture stress became severe.<br />
REFERENCES<br />
Aulakh, B.S. and Gill, K.S. 1988. Tillage effects on rain fed wheat production and soil bulk density: pp. 224<br />
231. In : van Ginkel, M. and D.G. Tanner (eds.). 1987. Fifth <strong>Regional</strong> <strong>Wheat</strong> <strong>Workshop</strong> for <strong>Eastern</strong>,<br />
Central, and Southern Africa and the Indian Ocean. Mexico, D.F.: CIMMYT.<br />
Brecke, BJ and Shilling, D.G. 1996. Effect of Crop Species, Tillage, and Rye Mulch on Sicklepod. Weed<br />
Science Journal 44(l): 133-136.<br />
Chugunov, Y., Sidorov, Y., Mathias Mekuria, and Ergano, S. 1987. Studying the influence ofploughings,<br />
weeding and fertilizer on weed infestation and wheat yield. pp. 210-213. In: Proceedings of 18 th<br />
National Crop Improvement Conference (NCIC). Institute of Agricultural Research (JAR). Addis<br />
Ababa, Ethiopia.<br />
Dawelbeit, M.L, and Salih, A.A. 1994. <strong>Wheat</strong> tillage system in the Gezira Scheme. pp. 199. In: Saunders, D.A.<br />
and G.P. Hettel (eds.). Proceedings on wheat in heat-stressed environments: Irrigated, dry areas and<br />
rice-wheat farming systems. Mexico, D.F.: CIMMYT.<br />
Dorado, J., Lopezfando, c., Delmonte, J.P. 1998. Barley yields and weed development as affected by crop<br />
sequence and tillage systems in a semiarid environment. In: Literature Update on <strong>Wheat</strong>, Barley, and<br />
Triticale: CIMMYT. 4(5): 5.<br />
Getinet Gebeyehu. 1988. Bread wheat improvement: Recommendations and Strategies. pp. 152-163. In:<br />
Proceedings of 19 th national crop improvement conference (NCIC), 22-26 April 1987. Institute of<br />
Agricultural Research (JAR), Addis Ababa, Ethiopia.<br />
Gomez, A.K., and Gomez, A.A. 1983. Statistical procedures for agricultural research. 2 nd edit. John Wiley and<br />
Sons. New York, Brisbane, Singapore.<br />
ICARDA. 1984. Annual Report. 1983. Aleppo, Syria.<br />
374
Response ojweed infestation and grain yield to Jrequency ojtillage and weed control - Tenaw<br />
Johnson, M.D., Wyse, D.L. and Lueschen, W.E. 1989. <strong>The</strong> influence of herbicide formulation on weed control<br />
in four tillage systems. Weed Science 37(2): 239-249.<br />
Jongdee, B. 1994. Tillage methods for wheat after rice in paddy soils in Thailand. pp. 272-275. In: Saunders,<br />
D.A. and G.P. Hettel (eds.). Proceeding on wheat in heat-stressed environments: irrigated, dry areas<br />
and rice-wheat farming systems. Mexico, D.F., CIMMYT.<br />
Kamwaga, J.N. 1990. Grain yield ofwheat as influenced by different tillage systems in Kenya. pp. 133-139. In:<br />
Tanner, D.G., M. van Ginkel and W. Mwangi (eds.). Sixth regional wheat workshop for <strong>Eastern</strong>,<br />
Central, and Southern Africa. Mexico, D.F.: CIMMYT.<br />
Kreuz, E. 1993. <strong>The</strong> influence of no-plough tillage for winter wheat in a three-course rotation on its yield and<br />
yield structure. Maize Abstract 9(6): 436.<br />
Macharia, CN., Palmer, A.F.E., Shiluli, M.C, Kamau, A.W., Musandu, A.A.O., and Ogendo, J.O. 1997. <strong>The</strong><br />
effect of crop rotation, tillage system and inorganic phosphorus on productivity of wheat based<br />
cropping system in the cool season highlands of Kenya. pp. 188-190. In: Ransom, J.K. A.F.E. Palmer,<br />
B.T. Zambezi, Z.O. Mduruma, S.R. Waddington, K.V. Pixley, and D.C Jewell (eds.). Maize<br />
Productivity Gains Through Research and Technology Dissemination. Proceedings of the Fifth <strong>Eastern</strong><br />
and Southern Africa <strong>Regional</strong> Maize Conference.<br />
Majid, A., Aslam, M., Hashmi, N.I. and Hobbs, P.R 1988. Potential use of minimum tillage in wheat after rice.<br />
pp. 71-77. In: Klatt, A.R. (ed.). Proceedings on wheat production constraints in Tropical Environments.<br />
Mexico, D.F.: CIMMYT.<br />
Stobbe, E.H. 1990. Conservation tillage. pp. 120-\32. In: Tanner, D.G., M. van Ginke1 and W. Mwangi (eds.).<br />
Sixth regional wheat workshop for <strong>Eastern</strong>, Central, and Southern Africa. Mexico, D.F.: CIMMYT.<br />
Thompson, CA., and Whitney, D.A. 1998. Long-term tillage and nitrogen fertilization in a west central Great<br />
Plains wheat-sorghum-fallow rotations. Literature update on: <strong>Wheat</strong>, Barley, and Triticale: 4(6).<br />
Wallace, RW. and Bellinder, R.R 1989. Potato yields and weed populations in conventional and reduced tillage<br />
systems. Weed Technology: 3 (4): 590-595.<br />
Yohannes Kebede. 1982. Informal Survey Report on Arsi Negelle and Shashemene maize and wheat growing<br />
areas. Addis Ababa, Ethiopia.<br />
Table 1.<br />
Weed species observed during the experimental seasons, 1996-1998, Arsi<br />
Negele, Ethiopia.<br />
.. Weed speCies 199'6 '. 1997 · 1998<br />
Broad leaf weeds<br />
Plantago lanceolata * * <br />
Galinsoga parvi/lora * * * <br />
Eidens pi/osa * * * <br />
Commelina benghalensis * * <br />
Nicandra physalodes * * *<br />
Guizotia scabra * *<br />
Anagalis arvensis * *<br />
Grassy weeds<br />
Eragrostis spp. * * *<br />
Couch grass *<br />
* = Weeds observed during the season.<br />
375
Response ofweed infestation and grain yield to frequency oftillage and weed control - Tenaw<br />
Table 2.<br />
Simple-correlation analysis of grain yield .with yield-related components.<br />
- '., .<br />
.'. (. '. , . .. ... ,~ , R.. vallie (n= 5)<br />
' Parameter ," :- .. , Sea,son; .,<br />
:,'::. ~-<br />
',:'<br />
,(" , '<br />
: ,.'1996: J997 1998·,<br />
.~. ,<br />
.,' -- ,. . . ,.<br />
Plant height (cm) 0.906* 0.990* 0.926*<br />
Weeds m- 2 -0.119 -0.982* <br />
Seed weight (g) -0.717 0.863 -0.581<br />
Spike length (cm) - 0.881 * 0.831<br />
Seeds/spike (no.) - 0.936* <br />
Total biomass (kg m- 2 ) - 0.997** 0.969**<br />
*, ** IndIcates slgmficance at the 5 and 1% probabIhty levels, respectively.<br />
Table 3.<br />
Multiple regression analysis of tillage by weed control method experiment<br />
on grain yield (kg ha- I ).<br />
Note:<br />
R Z . '<br />
" Season :Regr::ession' equatior,<br />
1996 Y = 1948+302.5x)-14.3x2 0.827<br />
1997 Y = 65. 7+600.9x)+ 108.8x2 0.875<br />
1998 Y = 166.6+84.6x)+0.4x2 0.613<br />
Xl=tIilage frequency<br />
X 2 =weed control method<br />
376
300<br />
120<br />
250 100<br />
Weed<br />
number<br />
200 80<br />
Pia n t<br />
150 60 height<br />
100 40<br />
50 20<br />
n 0<br />
0 2 3 4<br />
Plowing frequency (no.)<br />
I'---W-e-e-d- d-e-n- s ity -+-p la nth e ig h t (c m >1<br />
. (n 0 . m .2> . ----.--J<br />
Fig. 1. Response of weed density and plant height (1996-97) to<br />
frequency of tillage, Arsi Negelle, Ethiopia.<br />
0,7 6,2<br />
6<br />
0,6<br />
5,8<br />
0,5 <br />
Biomass yield 5,6 Spike length<br />
0,4 5,4<br />
0,3 5,2<br />
0,2<br />
0,1<br />
°<br />
°<br />
Plowing frequency<br />
2 3 4<br />
1--Spike length {cm} -+- Biomass yield (kg m'~j<br />
I<br />
.~._____.._....___.____._____<br />
5<br />
4,8<br />
4,6<br />
4,4<br />
Fig. 2. Response of spike length and above-ground biomass yield (kg m- 2 ) of<br />
wheat to frequency of tillage, Arsi Negelle, Ethiopia.<br />
377
Response ofweed infestation and grain yield to frequency oftillage and weed control - Tenaw<br />
3500<br />
~1300<br />
3000 250<br />
Yield (kg ha"') 2500<br />
200<br />
2000 "<br />
1500<br />
150<br />
1000<br />
100<br />
500 - 50<br />
o - 0<br />
0 2 3 4<br />
Weed density<br />
Plowing frequency (no.)<br />
-----Grain yield (kg ha·'r-+-Weed density (no.1<br />
Fig. 3. Effect of tillage frequency on weed density and grain<br />
yield of wheat (1996-97), Arsi Negelle, Ethiopia.<br />
300 1550<br />
250<br />
1500<br />
Weed no.<br />
200<br />
150<br />
100<br />
1450<br />
1400<br />
Yield (kg ha"l)<br />
50<br />
1350<br />
o 1300<br />
02,5 02,5+1HW 1HW 2HW<br />
Weed control<br />
[ Weed number m"2 -+- Grain yield I <br />
Fig. 4. Effect of weed control on weed density and grain yield of<br />
wheat, 1996-98, Arsi Negelle.<br />
378
GLOBALIZATION OF THE WHEAT MARKET AND THE EMERGING TRENDS <br />
IN WHEAT RESEARCH AND TECHNOLOGY GENERATION<br />
Prabhu L. Pingali <br />
Director, Economics Program, <br />
CIMMYT, Apdo. Postal 6-641, 06600, Mexico, D.F., Mexico <br />
ABSTRACT<br />
<strong>The</strong> Green Revolution in wheat had a tremendous impact on food security in<br />
the developing world. <strong>The</strong> development of modem varieties, their free global<br />
exchange, and improved production practices were the cornerstones of wheat<br />
productivity growth, along with infrastructural investments and a conducive<br />
policy environment. <strong>The</strong> demand for wheat in 2020 is expected to be 40%<br />
greater than today's 552 million tons as per IFPRI's projections, but the<br />
resources available for wheat production are expected to be significantly<br />
lower, hence the challenge for increasing wheat supplies is as great today as it<br />
was three decades ago and the current sense of complacency is misplaced.<br />
Global food markets are increasingly becoming integrated, and the premium<br />
given in the past to food self-sufficiency is being replaced by an emphasis on<br />
economic competitiveness and comparative advantage. Agricultural resources<br />
devoted to cereal crop production are increasingly diverted to _other<br />
agricultural and nonagricultural activities. Research systems, national as well<br />
as international, are facing declining budgets and uncertain futures. <strong>The</strong> free<br />
international movement of germplasm and information, which was an<br />
important factor in the success of the Green Revolution, is becoming<br />
increasingly restricted due to increasing quarantine restrictions and concerns<br />
of intellectual property protection. All of the factors discussed above lead to<br />
the central question examined in this paper: What should the global wheat<br />
research system do in this changing world? <strong>The</strong> research system ought to<br />
focus on sustaining the competitiveness ofwheat production in the developing<br />
world. This can be achieved through a dramatic shift in the yield frontier, a<br />
constant drive to stabilize yields, and enhanced input use efficiency and<br />
responsiveness. <strong>The</strong> emphasis on profitability should not be restricted to the<br />
irrigated, favorable environments alone. Similar opportunities ought to be<br />
explored for marginal, rainfed environments. This paper highlights the role<br />
that wheat research and germplasm exchange can play in sustaining global<br />
wheat productivity growth over the next two decades. Technologies on the<br />
shelf and in the pipeline that will help meet the demand for wheat through<br />
2020 are identified and evaluated.<br />
379
FARMER PARTICIPATORY EVALUATION OF PROMISING BREAD WHEAT <br />
PRODUCTION TECHNOLOGIES IN NORTH-WESTERN ETHIOPIA <br />
Aklilu Agidie l , D.G. Tanner 2 , Minale Liben l , Tadesse Dessalegne l and Baye Kebede l<br />
IAdet Research Center, P.O. Box 8, Bahir Dar, Ethiopia <br />
2CIMMYT/CIDA <strong>Eastern</strong> Africa Cereals Program, P.O. Box 5689, Addis Ababa, Ethiopia <br />
ABSTRACT<br />
Three promising bread wheat (Triticum aestivum) genotypes were compared<br />
with two released check varieties by farmers' research groups using both<br />
researcher and farmer-selected crop management practices. Agronomic and<br />
economic data and farmers' assessment criteria were collected during the<br />
conduct of the trials on four host farmers' fields during 1999. <strong>The</strong> statistical<br />
analysis across the four sites indicated that there were significant grain yield<br />
differences due to genotype and crop management level; however, interactions<br />
between genotype by site and , genotype by management level were nonsignificant.<br />
Mean' grain yields for the farmer- and researcher-managed plots<br />
were 1802 and 2148 kg/ha, respectively. One advanced line, HAR-2258, was<br />
high yielding and preferred by farmers on the basis of its crop stand, spike<br />
size, disease resistance, maturity class and crop uniformity. HAR-2258 and the<br />
check variety Abolla were both preferred by farmers for their quality in<br />
making staple food products. <strong>The</strong> improved crop management package for<br />
bread wheat was highly profitable for peasant farmers in N.W. Ethiopia: the<br />
researcher-managed production package increased wheat grain yields by an<br />
average of 19% across the four locations, and exhibited a marginal rate of<br />
return of 210% in comparison with the farmer-managed production practices.<br />
INTRODUCTION<br />
<strong>The</strong> highland of north-western Ethiopia (i.e., Gojam and Gonder zones) constitutes one of the<br />
important wheat (Triticum spp.) growing areas of the country (Aleligne and Regassa, 1992;<br />
Aleligne et al., 1992), and is considered to have a high potential for the expansion of bread<br />
wheat production (Hailu, 1991). In fact, the production of wheat in N.W. Ethiopia has more<br />
than doubled over the past 17 years, due to the introduction of high yielding varieties<br />
(HYVs), policy reforms in 1990, a higher market price for wheat, and increased consumption<br />
of wheat by farm households (Alemu et al., 1999).<br />
In N.W. Ethiopia, wheat grain is used in the preparation of a range of products (Aleligne and<br />
Regassa, 1992): the traditional staple pancake ("injera"), bread ("dabo"), local beer ("tella"),<br />
local spirit ("areki"), and several other local food items (i.e., "kollo", "genfo" and "nitro"). In<br />
addition, wheat straw is frequently used in house construction, especially as a roof thatching<br />
material, and as feed for livestock. <strong>Wheat</strong> is the second most important cash crop after tef<br />
(Eragrostis tej) for peasant farmers in this area.<br />
380
Fanner participatory evaluation ofbread wheat production technologies - Aklilu et ai,<br />
Historically, the fanners in N. W. Ethiopia produced a range of low yielding durum wheat (T.<br />
durum) landraces and an ancient bread wh'eat variety, "Israel" - known under several<br />
different local names (Alemu et al., 1999). A number of improved bread wheat HYVs have<br />
been released by the national bread wheat research program over the last two decades, and<br />
these varieties dramatically increased the yield potential of wheat throughout Ethiopia<br />
(Am sal et al., 1995). However, due to the rapid evolution of stripe rust (Puccinia striiformis)<br />
and stem rust (P. graminis f.sp. trifici) pathotypes, several of the most popular wheat<br />
varieties have been withdrawn from production (Bekele and Tanner, 1995). <strong>The</strong>refore,<br />
particularly in Ethiopia, it is important that new wheat varieties be released frequently in<br />
order to minimize the risk of yield loss from the rust diseases; additionally, deployment of a<br />
range of varieties across the country will diversify resistance genes at the field level (Bekele<br />
and Tanner, 1995). A previous study revealed that the rate of varietal turnover for wheat in<br />
N.W. Ethiopia was 11 years (Alemu et al., 1999) - a relatively slow rate of turnover in<br />
comparison to the global average of seven years.<br />
<strong>The</strong> Ethiopian bread wheat HYVs respond dramatically to improved crop management<br />
practices (Amsal et al., 1997, 1999). In particular, the profitability of wheat yield response to<br />
the application of Nand P fertilizer for improved crop nutrition and 2,4-D for weed control<br />
has been verified under fanners' conditions across a range of soil types in N.W. Ethiopia<br />
(Asmare et al., 1995; Minale et al., 1999). However, some fanners still express reservations<br />
concerning the use of purchased crop inputs (Asmare et al., 1995; Minale et al., 1999).<br />
To ensure that released varieties satisfy fanners' multiple and often complex objectives, it is<br />
important to actively involve fanners in the evaluation and selection process prior to varietal<br />
release (Heinrich, 1993). A fanner participatory approach to the evaluation of potential wheat<br />
production technologies should enhance the relevance of research by taking direct<br />
cognizance of fanners' conditions and needs, by choosing new technologies in cooperation<br />
with fanners, and by testing technologies under local conditions (Mutsaers et al., 1997).<br />
During the past two decades, the national bread wheat research program of Ethiopia has made<br />
progress concerning the inclusion of fanners in the varietal release process. Beginning in the<br />
mid to late 1980s, on-fann verification of released varieties was conducted under both<br />
recommended and farmers' crop management practices on representative farmers' fields<br />
(Dereje et al., 1990). Several years later, candidates for'varietal release were tested using a<br />
similar trial design throughout the country (Asmare et al., 1997). In each case, fanners were<br />
invited to assess both genotypic characteristics and the alternate crop production practices.<br />
<strong>The</strong> current study involved the establishment of fanners' research groups at four sites in<br />
N. W. Ethiopia with the following objectives:<br />
• to assess fanners' preferences for wheat genotypes and evaluation criteria, with a gendersensitive<br />
perspective, extending from crop establishment to end use of harvested grain;<br />
• to incorporate farmers' comments and reactions into the variety release process;<br />
• to understand the implications of production technologies for roles and responsibilities<br />
within the fann household.<br />
MATERIALS AND METHODS<br />
Farmers' research groups (FRGs) were established in four localities across South Gonder and<br />
West Gojam zones in N.W. Ethiopia (viz., Geregera, Debre Mawi, Aba Aregay and Ata Seifatra)<br />
early in 1999 (i.e., at least two months prior to the normal commencement of wheat sowing).<br />
381
Farmer participatory evaluation ofbread wheat production technologies - Aklilu et al.<br />
Each FRG consisted of from 25-30 fanners, representing both inale- and female-headed<br />
households, and a range of socio-economic characteristics and age groups. <strong>The</strong> FRGs met at<br />
agreed intervals with a multi-disciplinary team of research staff (i.e., a breeder, agronomist,<br />
economist, pathologist, and extension officer) from the Adet R.c. At these meetings, the<br />
members of the FRG shared their experiences with the research team, and were queried<br />
concerning characteristics desired in bread wheat varieties; questions for discussion were of the<br />
open-ended type.<br />
Each of the four FRGs identified a member farmer with a representative field as a host for a<br />
wheat technology evaluation trial. <strong>The</strong> trial design consisted of three advanced bread wheat lines,<br />
viz., HAR-2469, HAR-1884 and HAR-2258, and two released varieties "Abolla" and "ET-13"<br />
as checks under two crop management levels. <strong>The</strong> three advanced bread wheat lines exhibited<br />
high yield potential and an adequate to high level of disease resistance in on-station trials during<br />
1996-98; during 1999, all three lines were simultaneously included in the final year of the<br />
<strong>Regional</strong> Variety Trial (RVT) conducted at multiple station sites by staff ofthe Adet R.c.<br />
<strong>The</strong> FRGs developed the levels of the component crop management practices comprising the<br />
farmer-managed (FM) package during their periodic meetings with research staff; however,<br />
research staff made a conscious effort not to influence the levels selected by the FRGs.<br />
Subsequent to the finalization of the FM packages by each FRG, the research staff informed<br />
the farmers of the levels to be included in the researcher-managed (RM) package. <strong>The</strong><br />
components of each package are listed below:<br />
..<br />
' "<br />
Factor Researcher-mana2~d Farnier-mana2ed<br />
Seed rate 175 kglha 150-200 kglha<br />
Fertilizer - type DAP and urea DAP and urea<br />
- rate 100 and 161 kglha, respectively 100 and 100 kglha, respectively<br />
- application all DAP at planting and N split (at all DAP at planting and N split<br />
timing planting and early tillering) (at planting and early tillering)<br />
Herbicide 2,4-D (1 l/ha at 25-30 DAE) Not used<br />
Weeding One supplementary hand weeding Two times hand weeding<br />
<strong>The</strong> trial design used was an RCBD in split plot layout with two replications per site. <strong>The</strong> two<br />
crop management packages were assigned to main plots and the five wheat genotypes were<br />
assigned to sub-plots. <strong>The</strong> gross sub-plot size was 5 x 5 m (= 25 m 2 ).<br />
Non-experimental factors such as time, method and frequency of land preparation, and time<br />
and method of sowing, seed covering, and harvesting were all implemented in accordance<br />
with the host farmers' customary practices and preferences.<br />
<strong>The</strong> FRGs met at the trial sites several times during the growing season to evaluate the five<br />
genotypes and the management packages on the basis of the pre-harvest criteria identified<br />
previously during group meetings. Research staff collected detailed labor, agronomic and yield<br />
component data during the crop cycle. A net plot of 4 x 4 m (= 16 m 2 ) was harvested from each<br />
sub-plot by research staff to enable an accurate determination of grain yield.<br />
Post-harvest assessment of the harvested wheat grain was conducted by three of the four FRGs<br />
(i.e., excluding the Ata Seifatra FRG). Each FRG identified several women, usually wives, from<br />
the group to grind the grain according to local practice, and then prepare two of the principal<br />
end-use dishes, injera and local bread, from the flour. <strong>The</strong> women were assigned the<br />
382
Farmer participatory evaluation ofbread wheat production technologies - Aklilu et at.<br />
responsibility to assess the quality of each wheat genotype from grinding up to the end of the<br />
baking process. Subsequently, the FRG met as a group to assess the palatability of each product.<br />
Numeric scores were used to record the qualitative data arising from the FRG assessments.<br />
<strong>The</strong> agronomic data were analyzed separately for each site, and were also subjected to a<br />
combined analysis of variance across the four sites.<br />
Economic analysis of the crop management packages was conducted in accordance with<br />
CIMMYT's partial budget methodology (CIMMYT, 1988). Nutrient prices used were 2.53 and<br />
2.19 Ethiopian Birr (EB)/kg of DAP and urea, respectively. Daily wages were set at 3.50<br />
EB/work-day. Grain was valued at 1.67 EB/kg for threshing and 1.72 EB/kg for planting.<br />
Labor estimates for the various operations were 0.4 work-days/ha for fertilizer application,<br />
7.0 work-days/ha for herbicide application, 13 work-days/ha for hand weeding, and 20.0<br />
work-days/ha for harvesting.<br />
RESULTS AND DISCUSSION<br />
Agronomic Analysis<br />
Grain yield data obtained by the four individual FRGs are presented in Table 1. <strong>The</strong> grand<br />
mean grain yield across the four FRGs was 1975 kg/ha, while individual site means ranged<br />
from 1614 to 2434 kg/ha. At each site, the highest grain yield was obtained from the<br />
researcher-managed plots since the farmer-managed plots received a lower level of urea<br />
fertilizer and sub-optimal weed control. However, the Ata Seifatra FRG practiced more<br />
thorough hand weeding relative to the other FRGs; as a consequence, the grain yields<br />
obtained under both FM and RM were quite high and similar at this location. <strong>The</strong> lowest<br />
grain yields were obtained at the Aba Aregay site due to unreliable rainfall during the 1999<br />
growmg season.<br />
<strong>The</strong> analysis of variance (ANOYA) of grain yields at individual sites (Table 2) indicated an<br />
absence of significant d~fferences among the five genotypes tested, except at the Aba Aregay<br />
site (P
Farmer participatory evaluation o/bread wheat production technologies - Aklilu et al.<br />
Considering mean grain yields across the two management levels; HAR-2258 significantly<br />
out yielded all of the other genotypes except HAR-1884 (Table 3). Conversely, Abolla was<br />
lower yielding than all of the other genotypes except HAR-2469.<br />
Mean grain yield under FM was 1802 kglha, ranging from 1344 kg/ha at Aba Aregay to 2421<br />
kglha at Ata Seifatra. By contrast, the mean yield of wheat under RM was 2148 kg/ha, and<br />
ranged from 1859 kglha at Aba Aregay to 2448 kg/ha at Ata Seifatra. <strong>The</strong> smallest increment<br />
due to the improved management practices (i.e., 27 kg) occurred at Ata Seifatra. Expressed as<br />
a percentage of yield under FM, the grain yield responses to improved management ranged<br />
from 1 to 38% across the four FRGs; mean response was 19%.<br />
Differences in plant height were observed among the five genotypes (Table 3), but there was<br />
no effect of crop management practices. ET -13 was significantly taller than all of the other<br />
genotypes, and Abolla was shorter than the others.<br />
Economic Analysis of the Management Levels<br />
Partial budget analysis was carried out for the two crop management levels, according to<br />
CIMMYT (1988) methodology (Table 4).<br />
Using the standard prices for inputs and outputs as described in the Materials and Methods<br />
section, the marginal rate of return (MRR) for RM vis-a-vis FM was 210%, well in excess of<br />
the 100% level generally considered to be the minimum acceptable rate of return to motivate<br />
Ethiopian farmers to adopt a new technology (As mare et a!., 1997; Amsal et al., 1999).<br />
In the current study, improved crop management increased wheat grain yields by an average<br />
of 19% across the four locations. <strong>The</strong> results of the partial budget analysis agreed with a<br />
previous report that improved crop management practices for bread wheat are profitable for<br />
farmers in N.W. Ethiopia (As mare et al., 1997).<br />
Farmers' Assessments<br />
Prior to sowing the trials, the members of the FRGs were' asked to list all of the criteria that<br />
they consider important for an overall assessment of wheat genotypes. <strong>The</strong> FRG members<br />
then collectively narrowed down the list so that it finally included only the highest priority<br />
criteria. Subsequently, each FRG was asked to compare all of the criteria in a pair-wise<br />
fashion; a trait scored" 1" for each pair-wise comparison in which it was considered to be of<br />
greater importance, and the sum was calculated for each trait (Table 5). Clearly, disease<br />
resistance was considered to be of paramount importance by all FRGs, reflecting the serious<br />
threat that rust diseases, in particular, present to wheat production in Ethiopia (Bekele and<br />
Tanner, 1995). However, there were apparent differences between the FRGs in South Gonder<br />
and West Gojam zones: for example, being situated in a higher altitude area, in general, the<br />
FRGs in South Gonder attached a high priority to "frost tolerance", while this criterion was<br />
not considered important in West Gojam. Furthermore, in West Gojam, injera quality and<br />
market demand ranked in the top five criteria, suggesting that farmers in West Gojam may be<br />
more market-oriented vs. subsistence-oriented than their counterparts in South Gonder.<br />
Farmers' assessments of the five wheat genotypes were elicited both pre- and post-harvest. In<br />
the pre-harvest assessment, yield potential and disease resistance were reported by most<br />
384
Farmer participatory evaluation ofbread wheat production technologies - Aklilu et al.<br />
fanners in both zones as important pre-harvest criteria detennining'their varietal preferences.<br />
Fanners considered seedling emergence and vigor, tillering ability and spike size as<br />
indicators of grain yield potential (Table 6). Although grain yield was the primary concern of<br />
most fanners, a sizable minority stated their preference for taller varieties to provide the raw<br />
material for roof thatching and to be more capable of suppressing in-crop weeds. Seed size<br />
and seed filling were considered important factors by some fanners.<br />
When the FRGs viewed the genotypes during the soft/hard-dough stage of grain filling, spike<br />
length, spike density, low levels of disease on leaves and spikes, maturity class and crop<br />
unifonnity were the main selection criteria considered. Fanners reiterated their concerns<br />
regarding wheat susceptibility to disease; specifically, they characterize as "dangerous" any<br />
disease that attacks the spike or the peduncle, causing a failure of grain filling. Fanners<br />
appreciated ET -13 for its high level of resistance to all foliar diseases, but were disappointed<br />
with its relatively small and short spikes (Table 6).<br />
Regarding crop maturity, fanners expressed a preference for genotypes in the intennediate<br />
maturity class. <strong>For</strong> example, HAR-1884 was earlier than the other genotypes (Table 6);<br />
fanners appreciated its plant architecture, but worried about pre-harvest sprouting in a year of<br />
extended rainfall. Early crops are also subject to a greater degree of damage by foraging<br />
birds. Fanners cited a local proverb [in Amharic]: "Mejemeria yetenagerewun sew yitelawal,<br />
tolo yederesewun wef yibelawal" - which translates to "the first speaker or witness is hated,<br />
the early crop is eaten by birds". In contrast, genotypes in the late maturity class are disliked<br />
because of the risk of tenninal drought stress and a ,greater risk of frost damage (i.e., in the<br />
high altitude areas).<br />
Concerning weed management, the members of the FRGs voiced a preference for hand<br />
weeding vs. the use of 2,4-D, expressing concerns that 2,4-D exhibited some side effects on<br />
crop leaves (i.e., causing a transient yellowing) and did not effectively control all weeds in<br />
their fields. Hand weeding was considered most suitable for the wheat crop by the majority of<br />
the fanners, because it removed all types of weeds; hoeing after hand weeding improved crop<br />
vegetative perfonnance, according to the FRGs. However, within the FRGs, some fanners<br />
favored the use of2,4-D'because ofthe resultant savings in weeding labor.<br />
Seed characteristics, particularly seed color, and end-use quality, particularly for making<br />
bread and injera, were considered by most fanners to be important post-harvest criteria. Seed<br />
color also had price implications in local markets with white wheat grain receiving a<br />
premium. <strong>The</strong> women identified by each FRG to process the harvested grain into bread and<br />
injera rated the five genotypes on their relative quality in tenns of ease of grinding, the flour<br />
volume produced per unit of grain, the water absorption ability of the flour, and elasticity and<br />
extensibility of the dougb (Table 7). Bread and injera quality was also assessed for each<br />
wheat genotype; fanners ranked the bread and injera based on "eye" size, and product color<br />
and elasticity (Tables 7 and 8). Summarizing all of the component factors, HAR-2258 and<br />
Abolla were the most highly rated genotypes for bread and injera quality (Table 8).<br />
CONCLUSIONS<br />
<strong>The</strong> test line HAR-2258 was significantly higher yielding than all of the other bread wheat<br />
genotypes included in the trial except for HAR-1884 - which was disliked by fanners due to its<br />
early maturity. Furthermore, HAR-2258 received a favorable evaluation by the members of the<br />
385
Farmer participatory evaluation ofbread wheat production technologies - Aklilu et al.<br />
FRGs for most pre- and post-harvest evaluation criteria, including its' quality for the production<br />
of bread and injera. Thus, HAR-2258 should be given a high priority for release for the peasant<br />
fann corrununities of N.W. Ethiopia. <strong>The</strong> results of the current study will be forwarded to the<br />
national wheat variety release committee for their consideration. This study also verified the<br />
profitability of the recommended wheat crop management production package under fanners'<br />
circumstances in N.W. Ethiopia.<br />
ACKNOWLEDGMENTS<br />
We gratefully acknowledge the CIMMYT/CIDA EACP for funding this study. <strong>The</strong> authors<br />
wish to sincerely thank the fanners' research groups and the research staff of the Adet R.c.<br />
for assistance in executing the trials. Special thanks are extended to the late Alemu Hailye<br />
who proposed this study and established the fanners' research groups. We also thank Kessete<br />
Muhe, Kinfemichael Wassie, Melese Awoke and Mulu Gashu for monitoring the trials,<br />
collecting the necessary data, and typing the manuscript.<br />
REFERENCES<br />
Aleligne Kefyalew and Regassa Ensermu. 1992. Bahir Dar Mixed Farming Zone: Diagnostic Survey Report.<br />
Research Report No. 18. IAR, Addis Ababa.<br />
Aleligne Kefyalew, Tilahun Geleto and Regassa'Ensermu. 1992. Initial Results ofan Informal Survey ofthe<br />
Debre Tabor Mixed Farming Zone. Working Paper No. 12. IAR, Addis Ababa.<br />
Alemu Hailye, Verkuijl, H., Mwangi, W. and Asmare Yallew. 1999. Farmers' sources of wheat seed and wheat<br />
seed management in Enebssic area, Ethiopia. pp. 96-105. In: <strong>The</strong> Tenth <strong>Regional</strong> <strong>Wheat</strong> <strong>Workshop</strong> for<br />
<strong>Eastern</strong>, Central and Southern Africa. CIMMYT, Addis Ababa, Ethiopia.<br />
Amsal Tarekegne, Tanner, D.G. and Getinet Gebeyehu. 1995 . Improvement in yield of bread wheat cultivars<br />
released in Ethiopia from 1949 to 1987. African Crop Science J. 3( 1): 41-49.<br />
Amsal Tarekegne, Tanner, D.G., Amanuel Gorfu, Tilahun Geleto and Zewdu Yilma. 1997. <strong>The</strong> effects of<br />
several crop management factors on bread wheat yields in the Ethiopian highlands. African Crop<br />
ScienceJ. 5: 161-174.<br />
Arnsal Tarekegne, Tanner, D.G., Taye Tessema and Chanyallew Mandefro. 1999. A study of variety by<br />
management interaction in bread wheat varieties released in Ethiopia. pp. 196-212. In: <strong>The</strong> Tenth<br />
<strong>Regional</strong> <strong>Wheat</strong> <strong>Workshop</strong> for <strong>Eastern</strong>, Central and Southern Africa. CIMMYT, Addis Ababa.<br />
Asmare Yallew, Tanner, D.G" Mohammed Hassena and Asefa Taa. 1997. On-farm verification of five<br />
advanced bread wheat lines under recommended and farmers' crop management practices in the<br />
Ethiopian highlands. pp. 159-171. In: Sebil Vol. 7. Proceedings ofthe Seventh Annual Conference of<br />
the Crop Science Society ofEthiopia. 27-28 April, 1995. CSSE, Addis Ababa, Ethiopia.<br />
Asmare Yallew, Tanner, D.G., Regassa Ensermu and Alemu Hailye. 1995. On-farm evaluation of alternative<br />
bread wheat production technologies in northwestern Ethiopia. African Crop Science J. 3: 443-450.<br />
Bekele Geleta and D.G. Tanner. 1995. Status of cereal production and pathology research in Ethiopia. pp. 42<br />
50. In: Danial, D.L. (ed.). Breedingfor Disease Resistance with Emphasis on Durability. Wageningen<br />
Agricultural University, Wageningen, <strong>The</strong> Netherlands.<br />
CIMMYT. 1988. From Agronomic Data to Farmer Recommendations: An Economics Training Manual.<br />
Completely Revised Edition. CIMMYT, Mexico, D.F. 79 pp.<br />
Dereje Dejene, Tanner, D.G. and W. Mwangi. 1990. On-farm verification offour bread wheat varieties under<br />
high and farmers' weed management levels. pp. 96-102. In: Tanner, D.G., van Ginkel, M. and W.<br />
Mwangi (eds.). Sixth <strong>Regional</strong> <strong>Wheat</strong> <strong>Workshop</strong>for <strong>Eastern</strong>, Central and Southern Africa. CIMMYT,<br />
Mexico, D.F.<br />
Hailu Gebre-Mariam. 1991. <strong>Wheat</strong> production and research in Ethiopia. pp. I-IS. In: Hailu Gebre-Mariam,<br />
Tanner, D.G. and Mengistu Hulluka (eds.). <strong>Wheat</strong> Research in Ethiopia: A Historical Perspective.<br />
IARICIMMYT, Addis Ababa.<br />
Heinrich, G.H. 1993. Strengthening Farmers' PartiCipation Through Groups: Experiences and Lessons from<br />
Botswana. OFCOR Discussion Paper No.3. ISNAR, <strong>The</strong> Hague.<br />
Minale Liben, Alemayehu Assefa, Tanner, D.G. and Tilahun Tadesse. 1999. <strong>The</strong> response of bread wheat to N<br />
and P application under improved drainage on Bichena Vertisols in north-western Ethiopia. pp. 298<br />
386
Farmer participatory evaluation o/bread wheat production technologies - Aklilu et al.<br />
308. In: <strong>The</strong> Tenth <strong>Regional</strong> <strong>Wheat</strong> <strong>Workshop</strong>/or <strong>Eastern</strong>, Central and Southern A/rica. CIMMYT,<br />
Addis Ababa, Ethiopia.<br />
Mutsaers, H.l.W., Weber, G.K., Walker, P. and N.M. Fisher. 1997. A Field Guide/or On-Farm<br />
Experimentation. lITAJCTAJISNAR.<br />
Table 1.<br />
Mean grain yield (kglha) of five bread wheat genotypes under researcher<br />
and farmer crop management levels at four sites in north-western<br />
Ethiopia.<br />
Site<br />
Geregeia DebreMawj Aba Aregay Ata,Seifatra .. Mean<br />
Genotype RM FM ·RM · FM .. ~ ·, RM FNi ·· RM Fl\1 RM FM<br />
HAR-2469 2056 1592 2399 1671 1287 1148 2294 2447 2009 1714<br />
HAR-1884 2264 1754 2057 1874 2264 1377 2117 2795 2176 1950<br />
HAR-2258 2703 1671 2100 2063 1927 1706 2627 2488 2339 1982<br />
AbaBa 1856 1326 1917 1658 1559 1023 2423 1953 1939 1490<br />
ET-13 2125 1613 2081 1867 2259 1466 2648 2558 2278 1876<br />
Mean 2201 1591 2111 1827 1859 1344 2448 2421 2148 1802<br />
C.V.(%) 13.4 13.1 ' 13.7 18.5 15.6<br />
RM: Researcher-managed; FM: Farmer-managed.<br />
Table 2.<br />
Effects of genotype and crop management level on wheat grain yield<br />
(kglha) at four sites in north-western Ethiopia.<br />
Site<br />
Gere~era DebreMawi ' AbaAre~ay At~ Seifatra<br />
Genotype NS NS P=0.057 NS<br />
HAR-2469 1824 2035 1218 2327<br />
HAR-1884 2009 1966 1820 2456<br />
HAR-2258 2187 2082 1816 2557<br />
Abolla 1591 1787 1290 2188<br />
ET-13 1869 1974 1862 2601<br />
Mana~ement P
Farmer participatory evaluation o/bread wheat production technologies - Aklilu et al.<br />
Table 3.<br />
Effects of genotype and crop management level on wheat grain yield<br />
(kg/ha) and plant height (cm) from the combined analysis.<br />
' "<br />
GraIn yield'<br />
"',' . Pl~nfbeight "<br />
Site ** NS<br />
Genotype (G) ** ***<br />
HAR-2469 1862 BC 79 C<br />
HAR-1884 2063 AB 84B<br />
HAR-2258 2161 A 81 BC<br />
Abolla 1714 C 75 D<br />
ET-13 2077 AB 98 A<br />
LSD(O,os) 219 3.8<br />
Management (M) * NS<br />
High 2148 A 85<br />
Low 1802 B 82<br />
LSD(O.os) 271 NS<br />
Interaction (G x M) NS NS<br />
*, **, *** Significant at the 5, 1 and 0.01 % levels, respectively. <br />
NS: non-significant. <br />
Means within a column followed by the same letter are not significantly different <br />
at the 5% level of the LSD test. <br />
RM: Researcher-managed; FM: Farmer-managed. <br />
Table 4.<br />
Partial budget analysis for the two crop management levels across four<br />
sites in north-western Ethiopia.<br />
Researcher. managed .' ,,', Farmer ma,na2ed<br />
Mean yield (kg/ha) 2148 1802<br />
Adjusted yield (kg/hat 1933 1622<br />
Gross field benefit (bjrrlha) 3228 2710<br />
Fertilizer cost (birrlha)b 609 475<br />
Seed cost (birrlha) 301 301<br />
Labor cost (birrlha)C 194 161<br />
Total costs that vary (birr/ha) 1104 937<br />
Net benefit (birr/ha) 2124 1773<br />
Marginal cost (birr/ha) 167<br />
Marginal net benefit (birrlha) 351<br />
Marginal rate of return (%) 210<br />
aYield was adjusted downwards by 10% to more accurately reflect yields obtained under<br />
farmers' harvesting and threshing.<br />
bNutrients plus cost ofapplication.<br />
clnc1udes cost ofchemicals for weed control, application labor, hand weeding labor, and<br />
harvesting labor.<br />
388
.,<br />
00 •<br />
Farmer participatory evaluation o/bread wheat production technologies - Aklilu et at.<br />
Table 5.<br />
Ranking of the criteria established by farmers' research groups for the<br />
evaluation of bread wheat genotypes in two zones of north-western<br />
Ethiopia.<br />
,- ~, .; -<br />
><br />
:<br />
.-,. . ,,-<br />
..."<br />
'Sout~ i;~ 'oder 00<br />
", t<br />
~~'S,t Gojam<br />
, • .I.<br />
,<br />
Criterion<br />
.', SCQ~e<br />
"<br />
,<br />
~ 0<br />
Disease resistance 14 Disease resistance 12<br />
Frost tolerance 13 Injera quality 11<br />
Flour yield ("Bereket") 12 Market demand 10<br />
Maturi ty (earl iness) II Yield 8<br />
Yield 10 Flour x,ield i"Bereket") 8<br />
Lodging resistance 9 Bread quality 8<br />
Tillering ability 7 Seed color 5<br />
Spike size 6 Maturity (earliness) 5<br />
Seedling vigor 5 Tillering ability 4<br />
Injera quality 5 Seed size 4<br />
Market demand 5 Spike size 2<br />
Bread quality 4 Plant height 1<br />
Seed size 3 Seedling vigor 0<br />
Plant height<br />
I<br />
Seed color 0<br />
:-;' . ~ . ':' " . ""'1@r-iki-Ioll' , Score:<br />
Table 6.<br />
Farmers' subjective evaluation of specific field characteristics of five<br />
wheat genotypes.<br />
Geltotype.<br />
, . 0<br />
Cbarl,lcteristic IiAR~2469 , HAR:;.20258 ~~1884 '. Abolla ET-1'3<br />
"<br />
Emergence 3 2 3 3 2<br />
Seedling vigor 3 3 3 2 2<br />
Tillering ability 2 3 2 2 2<br />
Plant height 1 1 2 1 3<br />
Disease resistance 2 2 1 2 3<br />
Maturity 2 3 1 2 3<br />
Spike size 3 3 2 2 1<br />
Frost tolerance 2 2 2 2 3<br />
1 = undesirable (i.e., slow, low, short, susceptible, early, small). <br />
2 = intennediate (i.e., medium or moderate). <br />
3 = desirable (i.e., fast, high, tall, resistant, late, large). <br />
389
Farmer participatory evaluation o/bread wheat production technologies - .;!klilu et al.<br />
Table 7.<br />
Farmers' subjective evaluation of the attributes related to making injera<br />
and bread from the five tested wheat genotypes.<br />
, ..<br />
" ",Gen:6t¥pe " . " . ,."" , ' ... :~' ..:'.<br />
. ;Location HARH:~84 ·' ;Jt\R-2:258: ~ ; Abolla<br />
,<br />
>·ET-H,<br />
;/ ,',<br />
, ,<br />
- .. .<br />
Attribute<br />
:':lIAR-2469<br />
Ease of grinding Geregera Hard Very hard Very hard Soft Medium<br />
grain Debre Mawi Medium Hard Hard Soft Soft<br />
Aba Aregay Medium Hard Very hard Medium Soft<br />
Flour volume Geregera Medium High High Medium High<br />
("Bereket") Debre Mawi High High High High High<br />
Aba Aregay Medium High High High High<br />
Water Geregera High High High Very high High<br />
absorption Debre Mawi Medium Low Medium High Low<br />
ability Aba Aregay Medium Medium Medium High Medium<br />
Elasticity of Geregera High Very high High High High<br />
dough Debre Mawi High Medium Low High Medium<br />
Aba Aregay Medium Low Low Medium Low<br />
Extensibility Geregera High High High High High<br />
of leavened Debre Mawi Low High Medium High Medium<br />
mixture Aba Aregay Low Medium Medium Low High<br />
Bread Geregera 3 1 4 2 5<br />
(overall ranking) Debre Mawi 2 3 4 1 5<br />
Aba Aregay 4 5 2 1 3<br />
Injera Geregera 3 2 5 I 4<br />
(overall ranking) Debre Mawi 3 2 I 4 5<br />
Aba Aregay 5 3 1 2 4<br />
1 = best quality for bread or injera; 5 = lowest quality for bread or injera.<br />
Table 8.<br />
Rankinga of the farmers' subjective evaluation of the injera and<br />
bread making quality of the five tested wheat genotypes .<br />
Genotype .Bread'qua'lity ','," ", : '< In:)era·qualiiy<br />
HAR-2469 3 3<br />
HAR-1884 5 4<br />
HAR-2258 2 1<br />
Abolla 1 2<br />
ET-13 4 5<br />
a Ranking based on "eye" size, and product color and elasticity.<br />
1 = best quality for bread or injera; 5 = lowest quality for bread or injera.<br />
390
A CLIENT ORIENTED RESEARCH APPROACH TO THE TRANSFER <br />
OF IMPROVED DURUM WHEAT PRODUCTION TECHNOLOGY <br />
c<br />
Fasil Kelemework, Bemnet Gashawbeza, Teklu Tesfaye and Teklu Erkosa<br />
Debre Zeit Agricultural Research Center (EARO), P.O. Pox 32, Debre Zeit, Ethiopia<br />
ABSTRACT<br />
To have an impact on agricultural production, productivity and farmers'<br />
welfare, it is of vital importance to forge effective links between the<br />
in~titutions and relevant actors involved in the process including farmers.<br />
Cognizant of this fact, the Debre Zeit Agricultural Research Center (DZARC)<br />
financed by the Cool Season Food and <strong>For</strong>age Legumes Project and the Joint<br />
Vertisol Project (JVP) established a total of seven Farmer Research Groups<br />
(FRGs) in two woredas of <strong>Eastern</strong> Shoa Zone during the 1999 cropping<br />
season. Of these, the wheat variety FRG in the selected watershed area of<br />
Gimbichu woreda is discussed .. <strong>The</strong> objectives of this study were to form<br />
client-oriented alliances with farmers in the process of wheat variety<br />
development and transfer. Twenty-thr:ee members of the wheat variety FRG<br />
residing in the area were involved. Each farmer planted an improved durum<br />
wheat variety called 'Kilinto' and their local variety side by side using a ridge<br />
and furrow (RF) seed bed. <strong>The</strong> mean grain yield obtained by farmers from the<br />
improved variety was 2330 kglha cf. the local variety at 1930 kglha. <strong>The</strong><br />
marginal rate of return of the improved variety was found to be 1627%, which<br />
is economically profitable.<br />
INTRODUCTION<br />
Agricultural technology generation, development and transfer process as a system has<br />
different actors (researchers, farmers, extension workers, etc.) playing key roles in<br />
maintaining its holistic nature. <strong>The</strong> contribution of each of the actors will have a great impact<br />
on agricultural production, productivity and on farmers' welfare. To reach this goal, forging<br />
effective links between the institutions and relevant individual actors involved in the process<br />
including farmers is of vital importance.<br />
Cognizant of this fact, the DZARC, financed by the Cool Season Food and <strong>For</strong>age Legumes<br />
Project and the Joint Vertisol Project (JVP) established a total of seven Farmer Research<br />
Groups (FRGs) in two woredas of <strong>Eastern</strong> Shoa Zone during the 199912000 cropping season.<br />
<strong>The</strong> aim of establishing FRGs is to form strong alliances with farmers in the process of<br />
agricultural technology generation, development and transfer more demand driven and hence<br />
client oriented.<br />
A series of meetings was held with farmers during the course of forming FRGs. In the<br />
discussions held, farmers were allowed to enumerate their production constraints and<br />
elaborate upon them and group them accordingly based entirely on their willingness. <strong>The</strong><br />
major production constraints identified by farmers were:<br />
391
Client oriented research approach to transfer ofimproved durum wheat production technology - Fasil et al.<br />
• A foliar disease, rust, that affects all aerial parts and destroys lentil,<br />
• Lack of high yielding varieties of chickpea,<br />
• Lack of improved and high yielding varieties of wheat,<br />
• Water logging problem in wheat production,<br />
• Rate of fertilizer application in wheat,<br />
• Weed problem in wheat, and<br />
• Lack of fuel wood and feed shortage.<br />
Following the identification of these constraints, farmers were allowed to group themselves<br />
in one or more of these problem areas and the FRGs were named after the problems. Planning<br />
and review meetings with farmers were held where farmers decided on the type of<br />
experiment that they would like to undertake. <strong>The</strong> treatments in the experiments were also<br />
selected together with farmers and the role of researchers and extension workers in this<br />
regard was more as a moderator. Researchers were drawn from different disciplines ranging<br />
from breeders, agronomists, soil scientists and foresters to agricultural economists and<br />
research-extension professionals. <strong>Wheat</strong> FRG is one of the FRGs established with an aim to<br />
evaluate improved durum wheat technology on farmers' fields at Cheffe Donsa.<br />
<strong>Wheat</strong> is one of the major cereal crops' grown in the central highlands of Ethiopia, ranking<br />
fifth in production and fourth in yield (Hailu et al., 1992). Two wheat species are dominantly<br />
grown in the country. <strong>The</strong>se are bread wheat (Triticum aestivum) and durum wheat (T.<br />
turgidum var durum). Durum wheat is traditionally grown on. the heavy black soils<br />
(Vertisols) of the highlands at altitudes ranging between 1800-2800m, exclusively under<br />
rainfed agriculture (Tesfaye and Getachew, 1991). <strong>The</strong> country is recognized as a center of<br />
genetic diversity for durum wheat. <strong>The</strong> Ethiopian farmers have been growing this crop for<br />
millennia. During recent past, durum wheat used to occupy more than 60% of the total wheat<br />
area in Ethiopia (Hailu et al., 1991; Tesfaye and Getachew, 1991). Currently both bread and<br />
durum wheat occupies equal areas although bread wheat is on the increase.<br />
Chefe Donsa is one of the highland waterlogged Vertisol areas (2450 m a.s.l.) where durum<br />
wheat planting accounts for about 51 percent of total cereal production. However, yields of<br />
fanners' cultivars are low. Use of an adapted and high yielding variety is one of the important<br />
factors for yield increment. Thus, this experiment was initiated together with fanners to give<br />
them the opportunity to evaluate improved technologies of durum wheat for further adoption<br />
ofthe technology.<br />
MATERIALS AND METHODS<br />
Twenty-three members of the FRG residing in a selected watershed area of Gimbichu woreda<br />
were planted with an improved durum wheat variety called Kilinto and fanners local variety<br />
side by side using RF seedbed on the same plot size for the sake of comparison. <strong>The</strong><br />
improved wheat variety was planted at the recommended rate and in the recommended time<br />
(i.e., seeds were broadcast at the rate of 150 kglha and fertilizer was applied at the rate of<br />
150/50 kglha N/P 2 0 S ). Each variety was planted on a field size of 50x50 m 2 of land.<br />
Economic analysis was carried out according to CIMMYT methodology (CIMMYT, 1988).<br />
392
Client oriented research approach to transfer ofimproved durum wheat production technology - Fasil et al.<br />
RESULTS AND DISCUSSION <br />
<strong>The</strong> grain yields on the fields of the twenty-three participant fanners ranged between 1400 to<br />
3328 kg per hectare for improved wheat variety, and 800 to 3000 kglha for local wheat<br />
variety. <strong>The</strong> mean grain yields obtained by farmers who grew the improved packages were<br />
2329 kg/ha while farmers who grew the local variety obtained a mean grain yield of 1930<br />
kglha. It was also observed that the straw yields of the improved variety Kilinto outyielded<br />
that of the local variety (Table 1).<br />
<strong>The</strong> economic analysis revealed that the total variable cost of the local package was 675.27<br />
Birrlha while that of the improved wheat package was 723.33 Birr/ha for improved<br />
production package (Table 1). <strong>The</strong> marginal analysis also showed that the improved varieties<br />
had considerably higher marginal rate of return relative to the local variety package. Hence,<br />
the improved variety contributed greater amount of net benefits as compared to the local<br />
variety. <strong>The</strong> marginal rate of return of the improved variety was found to be 1627%, which is<br />
economically profitable and feasible (Table 2).<br />
In conclusion, the agronomic and economic analyses clearly indicated the superior<br />
performance of the improved variety as compared to the local variety. <strong>The</strong> results obtained<br />
from wheat varietal FRG revealed that the improved varieties out yielded the local variety.<br />
Members of the wheat FRG expressed their interest in growing durum wheat variety Kilinto.<br />
Farmers' criterion of selecting Kilinto in.cludes high yielding, desirable seed color,<br />
threshability and straw palatability. As a result, many fanners expressed a tremendous<br />
demand for the improved varieties.<br />
ACKNOWLEDGMENTS<br />
<strong>The</strong> authors gratefully acknowledge the contributions of farmers who have participated in the<br />
research undertaking, researchers, and extension workers who made tremendous effort in the<br />
establishment of the FRGs and carried out the experiment successfully. <strong>The</strong> financial support<br />
of ICARDA and the Joint Vertisol Project to conduct these experiments is also very much<br />
appreciated.<br />
REFERENCES<br />
CIMMYT. 1988. From Agronomic Data to Farmer Recommendations: An Economics Training Manual.<br />
Completely revised edition. Mexico, D.F.: CIMMYT.<br />
Hailu Beyene, Franzel, S. and W. Mwangi. 1992. Constraints to increasing wheat production in the smallholder<br />
section. pp. 201-211 . In: Franzel, S., and H. van Houten (eds.). Research with Fanners: Lessons<br />
from Ethiopia. Wallingford, UK: C.A.B International.<br />
Hailu Gebre Mariam. 1991. <strong>Wheat</strong> Production and Research in Ethiopia. pp. \-15. In: Hailu Gebre Mariam,<br />
Tanner, D.G. and Mengistu Hulluka (eds.). <strong>Wheat</strong> Research in Ethiopia: A Historical Perspective.<br />
Addis Ababa: IARICIMMYT.<br />
Tesfaye Tesemma and Getachew Belay. 1991. Aspects ofEthiopian tetraploid wheats with emphasis on durum<br />
wheat genetics and breeding research. pp. 47-71. In: Hailu Gebre Mariam, Tanner, D.G., and<br />
Mengistu Hulluka (eds.). <strong>Wheat</strong> Research in Ethiopia: A Historical Perspective. Addis Ababa,<br />
Ethiopia: TAR! CIMMYT.<br />
393
Client oriented research approach to transfer ofimproved durum wheat production technology - Fasil et al. <br />
Questions and Answers: <br />
Vicki Tolmay: What is the wheat straw used for in Ethiopia? <br />
Answer: It is generally used as animal feed. In some areas, it is used as a thatching material. <br />
Table 1.<br />
Partial budget of the improved and local durum wheat varieties,<br />
1999/2000.<br />
, ,"<br />
ECONOMICS OF FERTILIZER USE ON DURUM WHEAT<br />
Hailemariam T/Wold and Gezahegn Ayele<br />
Debre Zeit Agricultural Research Center (EARO), P.O. Box 32, Debre Zeit, Ethiopia<br />
ABSTRACT<br />
Farmers in wheat growing areas of Ethiopia rely on wheat production for various<br />
purposes. Even though the role played by fertilizer use is increasing, economic<br />
use of fertilizer is not well addressed due to a wide range of factors. Economic<br />
use of fertilizer consists of among other things, choosing the right kind and<br />
quantity of fertilizer including both input and output prices. <strong>The</strong> relation between<br />
fertilizer and wheat price determines the level of profitability in the use of<br />
fertilizer and thereby effective demand for fertilizer by farmers. <strong>The</strong> multiple<br />
regression analysis is used to derive the mathematical wheat yield function for<br />
different application of nitrogen and phosphorous fertilizers. In the two nutrient<br />
case, profit maximization requires the value of marginal physical productivity of<br />
each nutrient be' equal to its respective marginal nutrient cost times the<br />
investment cost. <strong>The</strong> economic optimum point is a dynamic concept, which is<br />
influenced by variation in relative price of input-output. This issue can be<br />
analyzed using sensitivity analysis. At the prevailing grain and nutrient prices,<br />
the study revealed that, using optimum rate of nutrients would give a 65%<br />
marginal rate of return over the traditional farmers' rate. As the ultimate success<br />
of fertilization of wheat depends on the prices of wheat and fertilizers, developing<br />
a fertilizer pricing policy that is based on cost-benefit analysis should be a<br />
prerequisite. Thus both policy makers and farmers should pay attention to the<br />
type and economic optimum use for fertilizer efficiency in durum wheat<br />
production.<br />
INTRODUCTION<br />
<strong>Wheat</strong> is one of the most important cereal crops largely grown by peasants in most parts of the<br />
country. Farmers in wheat growing areas of the country rely on wheat production for local<br />
consumption and a source of income.<br />
Ethiopia is the largest producer of wheat in sub-Saharan Africa. Currently wheat occupies about<br />
0.882 million ha ofland (CSA, 1996). <strong>The</strong> national mean wheat grain yield is low mainly due<br />
to suboptimal management practices. A substantial gap has been observed between yields on<br />
research stations and farmers' fields primarily due to inefficient transfer of technology and the<br />
lack ofnecessary inputs for wheat production (Bekele et al., 1994). This is the main reason why<br />
many people recommend that the best solution to the low agricultural productivity is to improve<br />
the system of farming practices and provide information to farmers on improved farm<br />
technology. Provision of fertilizers along with sufficient knowledge and information about<br />
fertilizer application is among the important factors for improving agricultural productivity.<br />
Even though the role-played by fertilizer use in increasing crop yield is well perceived, economic<br />
395
Economics offertilizer use on durum wheat - Hailemariam and Gezahegn<br />
use of fertilizer is not well considered due to a wide range of factors. According to Workneh<br />
(1989), fanners in Ethiopia apply fertilizer at a rate less than the rate commonly advised by some<br />
extension agents, as fam1ers are not convinced of the economic return from the recommended<br />
rate. Deresse (1985) also identified lack of location specific recommendation about fertilizer<br />
application rate as a major constraint on fertilizer use by peasants ofEthiopia. <strong>The</strong> economic use<br />
of fertilizers consists of among other things, choosing the right kind and the right rate of fertilizer<br />
and applying it in the right place at the right time including consideration ofprices of input and<br />
output. In addition lack ofprofitability in the use of fertilizer is assumed to be detennined by the<br />
unfavorable relation between fertilizer and crop price, which results in low effective demand for<br />
fertilizer by fam1ers. Nevertheless, to justify the effect of such crop and fertiiizer price<br />
relationship on profitability by empirical studies, it is important to analyze the use of fertilizer<br />
focusing on efficiency and profitability.<br />
OBJECTIVES OF THE STUDY<br />
In line with this, the specific objectives of the study include:<br />
1) To derive wheat response function to the application of nitrogen and<br />
phosphorous fertilizer<br />
2) To detennine an optimum combination of fertilizers that can reduce the cost of<br />
fertilizer use thereby generating profitable returns<br />
3) To assess the effect of price change on the economic optimum levels of<br />
fertilizer use<br />
4) To estimate the gap between fanners' actual use of fertilizer and the optimum<br />
fertilizer level and identifying its impact on returns<br />
MATERIALS AND METHODS<br />
This study employs production function of multiple regression analysis to detennine economic<br />
rate of nitrogen and phosphorous fertilizers that maximize profit. <strong>The</strong> production function in<br />
economics describes the technical or physical relationship between output and one or more<br />
variable inputs (Ellis, 1988). Production function analysis is the most important of all the<br />
techniques used in production economics due to its simplicity and its power to provide extra<br />
infonnation regarding production and growth and also economic development and planning<br />
(Singh, 1986). It provides not only infonnation about the technical maximum level ofoutput that<br />
can be achieved in the application of a certain variable input, but also gives insight into the<br />
detem1ination ofproductivity of that input. <strong>The</strong> marginal productivity is defined as the amount<br />
of output obtained from a unit increase in the variable input. It is a highly useful concept to<br />
measure the degree of economic efficiency in allocation of resources between alternative<br />
choices. A production function may be expressed in several fonns one of which being an<br />
algebraic equation. <strong>The</strong> quantity of a physical output is detennined by the quantity of factor<br />
inputs.<br />
Thus, it can be said that quantity Y depends on factor inputs XI, X 2 , X 3 , •.. , X n , and can be<br />
written in functional fonn as:<br />
Where Y is the amount ofyield ofa given agricultural commodity, the Xs are the inputs required<br />
to produce the agricultural commodity, and f is the fitted functional fonn relating output to the<br />
396
Economics o//ertilizer use on durum wheat - Hailemariam and Gezahegn<br />
n variable inputs.<br />
Given the technical possibilities set by a production function, it can be assumed that the degree<br />
of economic efficiency in resource allocation between alternative enterprises can be measured<br />
on the basis of the marginalist principle of expanding factor input use, up to the level where<br />
marginal cost equals marginal revenue (Koutsoyiannis, 1979). <strong>The</strong> economic optimum or the<br />
equilibrium level of input in a production function can be altered by changes in prices or by<br />
technical change in production, since such changes would increase 'or decrease the marginal<br />
product of the variable input.<br />
<strong>The</strong> Data<br />
<strong>The</strong> pooled results of nitrogen and phosphorous (N-P) response study data which were conducted<br />
in Ada and Akaki areas in the central highlands of Ethiopia are the main source of data for this<br />
analysis. Field trials on uptake and response of durum wheat at different rates of nitrogen and<br />
phosphorous fertilizer were conducted by the soil section ofthe Debre Zeit Agricultural Research<br />
Center. <strong>The</strong> study area is one ofthe main agricultural regions of the central highlands ofEthiopia<br />
where the soils are Vertisols, which are regarded as marginal for durum wheat production. In<br />
addition to this, the actual farmers' practices of fertilizer application on wheat are taken from the<br />
demonstration trials conducted by the department of Agricultural Economics of the Debre Zeit<br />
Agricultural Research Center.<br />
Model Specification<br />
<strong>The</strong> mathematical relation between wheat yield and various levels of nitrogen and phosphorous<br />
fertilizer are statistically fitted to the experimental data. Because of its mathematical simplicity<br />
and its ability to facilitate a more detailed technical and economic analysis, the quadratic<br />
multiple regression function is used to estimate the mathematical relationship of yield and<br />
different fertilizer rates. In addition, the quadratic functional form has been widely used because<br />
it is easily generalized to models with more than one nutrient. It allows for easy interpretation<br />
of interaction effects of explanatory and dependent variables. It also gives an accurate picture<br />
of crop response at least up to the fertilizer levels well above those, which could be advised to<br />
use (Jauregui and Sain, 1992).<br />
<strong>The</strong> quadratic relationship being the econometrics yield function, adapted as an appropriate<br />
function for this analysis is of the following form:<br />
Where:<br />
Yw = the physical quantity of wheat yield in kglha<br />
bothrough bl2 are regression coefficients defining the response to input levels<br />
N = the level of nitrogen input applied in kglha<br />
P = the level of phosphorus input applied in kg/ha<br />
U = disturbance term assumed to be of zero mean and variance<br />
All regression variables are estimated by the methods of least squares using the statistical<br />
software program SPSSIPC Version 6. After deriving the regression variables, the profit function<br />
397
Economics offertilizer use on durum wheat - Hailemariam and Gezahegn<br />
can be derived using response function arid crop and fertilizer prices. In the two nutrient cases,<br />
profit to be maximized is expanded to incorporate the definitions of the response function,<br />
f(N,P). <strong>The</strong> deduction of total costs that vary, (PnN + PpP) (1 +R) from the gross field benefits,<br />
P w f(N,P), attained from a unit ofland provide a profit function. In this case the profit function<br />
(0) to be maximized is given as:<br />
n = P w f(N*, P*) - (PnN* + PpP*) (1 + R)<br />
Maximization of this profit function yields the following optimality condition:<br />
That is, profit maximization requires that the value of marginal physical productivity of each<br />
nutrient be equal to its respective marginal factor cost (nutrient price) times the investment cost<br />
(1 +R). This means that the last unit of money invested in each nutrient must yield the same<br />
amount of money weighted by the investment cost, (I+R).<br />
<strong>The</strong> minimum rate of return acceptable to fanners (R) reflects the cost of money invested, i.e.,<br />
the benefit given up by the farmer by tying up the working capital in the farm for a period of<br />
time. <strong>For</strong> a technology that represents an adjustment in current farmers practice (such as different<br />
fertilizer rates for farmers that are already using fertilizer), the time and effort spent in learning<br />
is lower. Hence, a lower minimum rate of return acceptable to fanners (50-100%) can be<br />
estimated (CIMMYT, 1988).<br />
Thus the optimal level of nutrient can be derived from the profit maximization function using<br />
the system of simultaneous equation. It is indicated that, at the point of profit maximization<br />
In - Pn (1 +R) / Pw = 0 and h - Pp(1 +R) / Pw = 0<br />
Substituting fn and fp by the marginal physical productivity of each nutrient obtained from the<br />
response function and rn and rp by the respective price ratio gives the following equilibrium<br />
equation:<br />
b l + 2bliN + b 12 P - rn = 0<br />
b2+ 2b 22 P + b l2N - rp = 0<br />
Solving these two equations with respect to Nand P yield the derivation of the optimal level of<br />
nutrients:<br />
N* = [2b 22 (rn -b l) - b l2 (rp - b2)] / [4b 11 b22- b 2 d<br />
p* = [rp - b2- b I2N*] / [2b22]<br />
Where:<br />
P w = <strong>Wheat</strong> price (Birr/kg)<br />
Pn= N price (Birr/kg)<br />
P p = P price (Birr/kg)<br />
rp = Pp (1 +R) / P w (price ratio ofP to wheat)<br />
rn = Pn(1 +R) / P w (price ratio ofN to wheat)<br />
R = Minimum rate of return<br />
fn = Marginal Physical Product of N<br />
fp = Marginal Physical Product of P<br />
398
Economics oJJertilizer use on durum wheat - Hailemariam and Gezahegn<br />
EMPIRICAL RESULTS<br />
Regression Analysis<br />
As already stated, the explanatory variable inputs used in this analysis are nitrogen and<br />
phosphorous. Twenty-five observations on yield of wheat are obtained from different<br />
combinations of the two fertilizers. Estimation of the structural parameters, standard errors,<br />
coefficient of determination (R2) and t-statistic are provided for the average over locations.<br />
y w = 1546.89 + 9.91N* + 1.88P - O.039N 2 ** - 0.079P2 + 0.024NP, R2 = 0.794<br />
*, ** Indicate statistical significance at 1 % and 10% probabilitylevels, respectively.<br />
Where:<br />
y w = <strong>Wheat</strong> yield (kg)<br />
N = Amount ofnitrogen nutrient (kg); and<br />
P = Amount of phosphorous nutrient (kg).<br />
Based on the results of the standard error, the explanatory variable nitrogen and its interaction<br />
with phosphorous, 'NP' does in fact influence yields of wheat. <strong>The</strong> coefficient of determination<br />
(R2) is high, which shows that wheat yields are well explained by nutrients.<br />
Economic Optimum<br />
<strong>The</strong> necessary condition for the attainment of the most profitable or the economic optimum level<br />
of nutrients is the equality between the value of marginal physical product of each nutrients to<br />
its price times by the investment cost, (1 +R). Marginal physical products ofnitrogen (MPP n) and<br />
phosphorous (MPPp) nutrients can be predicted from the partial derivatives of the regression<br />
equation.<br />
<strong>The</strong> detennination of the economic optimum level of nutrient is based on the price per kg of Birr<br />
1.98 for wheat, Birr 4.00 for nitrogen and Birr 2.71 for phosphorous and a minimum rate of<br />
return acceptable to farmers (R) is assumed to be 50%. Based on the grain and nutrient price<br />
combination, the price ratios (rn and rp) for wheat are calcl.Jlated using rn = Pn(1+50%)/ P w and<br />
rp= Pp (1 +50%)/ P w • After deriving the price ratio, the economic optimum level of nitrogen and<br />
phosphorous (N* and P*) for wheat production can be formulated.<br />
Given the above price ratios, optimum combinations of the two nutrients that maximize profit<br />
are found to be 92.20 kg N/ha and 12.64 kg P/ha. Substituting these values of nitrogen and<br />
phosphorous into the regression equation, the predicted yield is found to be 2169 kglha. Total<br />
return less fertilizer cost is thus Birr 3690.04lha.<br />
<strong>The</strong> determination of the economic optimum level of nutrients under a range of price situations<br />
used to illustrate the sensitivity of the profit maximizing combinations of nutrients and net<br />
returns to the change in relative prices. <strong>The</strong> economic optimum level of nitrogen and<br />
phosphorous at different nutrient and wheat price and the yield expected at such level of nutrients<br />
are provided in Table 1. <strong>The</strong> table illustrates the cost of fertilizer incurred and the net return<br />
earned. Two price level ofN and P when the product price remains at constant and conversely<br />
two price level of wheat keeping the price of nutrients at constant are used for this purpose. At<br />
a constant grain price, the increase ofnutrient price will decrease the net benefit for two reasons.<br />
On the one hand due to a high nutrient price the total amount of nutrients per unit area will be<br />
399
Economics offertilizer use on durum wheat - Hailemariam and Gezahegn<br />
smaller. Consequently the yield expected and the gross benefit earned are declining. On the other<br />
hand, for the higher nutrient prices, the higher the cost ofthe nutrients, the lower net returns will<br />
farmers to earn.<br />
Any change in relative prices alters the economic optimum level of nutrients. <strong>The</strong> unfavorable<br />
price relationship that is a fall in grain prices in relation to the nutrient prices anellor a rise in<br />
nutrient prices in relation to grain prices results the economic optimum level occurring at a lower<br />
level of inputs and outputs. It can be observed that there is variation in the economic level of<br />
nutrients and net returns from the use of fertilizer from time to time when factor and product<br />
prices vary. Pertaining to this case, experience in Ethiopia shows that fertilizer price has an<br />
increasing trend. Under such situation, farmers will be reluctant to apply higher amount of<br />
nutrients. As a result of this, net benefits that farmers generate are declining.<br />
<strong>For</strong> a constant price of wheat Birr 1.98/kg, an increase of nitrogen price by 0.89 Birr and<br />
phosphorous by 0.57 Birr is the reason for the sacrifice of net benefit of Birr 126.96/ha. Out of<br />
such decline of net benefit, 67% is due to out put effect while the remaining 33% is due to cost<br />
effect. That is, the increase ofnutrient prices has a disincentive effect for the farmers to use more<br />
amounts ofnutrients and also increase the cost of fertilizer. On the other hand, keeping the price<br />
ofnitrogen at Birr 4.00/kg and phosphorous at Birr 2.71/kg, increasing the price ofwheat by 0.30<br />
Birr make the farmers to enjoy an incremental net benefit of Birr 665.01/ha. <strong>The</strong> discussions so<br />
far try to point out the optimum level ofnutrients that maximize profit under the various relative<br />
prices. Actually the amount ofprofit maximizing level of nutrient under the current factor and<br />
product prices are much higher than the rate that farmers would apply to their plot.<br />
Demonstration trials conducted in the study area showed that on the average farmers would apply<br />
39.20 kg nitrogen and 10.03 kg phosphorous per hectare for wheat.<br />
Table 2 focuses on the differences between the effect ofthe optimum fertilizer rate determined<br />
and the actual farmers' fertilizer rate. <strong>The</strong> idea is thus to ask what changes can be made in the<br />
present farmers' practice and to compare the change in net benefit with the change in fertilizer<br />
rate, costs and yields.<br />
Comparison between the two alternatives can be made using the method of marginal analysis.<br />
<strong>The</strong> marginal rate of return indicates what farmers can expect to gain, on the average, in return<br />
for their investment when they decide to change from the method of lower rate of fertilizer<br />
application to the optimum fertilizer combinations. Farmers gain expectation from using a new<br />
practice is compared to the minimum rate of return acceptable to farmers. <strong>For</strong> a farmer who<br />
already use fertilizer, 50% is estimated as the minimum rate of return as the farmer adjust the<br />
current fertilizer application rate into optimum fertilizer level.<br />
In light ofthis, by adopting the optimum level of nutrients, wheat producer farmers incur an extra<br />
investment of Birr 328.61/ha. In return, by hanging their practice they will obtain extra benefit<br />
of Birr 211.93. Thus, using optimum rate of nutrients would give a 65% marginal rate of return.<br />
<strong>The</strong> result of the marginal rate of return obtained from using optimum fertilizer rate is greater<br />
than the minimum rate of return that farmers expect to gain. This shows the fact that adjusting<br />
the current fertilizer rate into the optimal and higher level of fertilizer rate is profitable for wheat<br />
production.<br />
400
Economics oJJertilizer use on durum wheat - Hailemariam and Gezahegn <br />
CONCLUSIONS AND IMPLICATIONS <br />
It is evidenced that nitrogen and phosphorous fertilizer as a whole has been profitable input to<br />
the production of wheat. Although this is a general trend which needs further investigation to<br />
evaluate the relevant kind and optimum level of fertilizer, the finding ofthis study suggest that<br />
cultivated wheat on Vertisols require higher amount of nitrogen than phosphorous.<br />
In terms of value productivity it has been shown that farmers are discouraged to the use of<br />
fertilizer in wheat production as a means of assuring stable increase of their income due to<br />
relatively higher cost of fertilizer relative to lower price ofgrain. Such unfavorable relationship<br />
of factor and product price affects the expected level of input and out put. Consequently, the<br />
success of increasing wheat production from the use of fertilizer depends on the ability of the<br />
producer to buy the nutrient at favorable price and sell grain when prices are high.<br />
As the ultimate success of fertilization ofwheat depends on the prices of wheat and fertilizers,<br />
developing a fertilizer pricing policy that is based on cost benefit analysis thus assists the farmers<br />
to increase fertilizer use. In this regard reducing excessive marketing costs through the<br />
involvement of more private sectors might be possible to make the use offertilizer cost-effective.<br />
In addition, efficient distribution of fertilizer can be accomplished through farmers education,<br />
infrastructural development and agricultural programs concerned with fertilizer use and<br />
distribution.<br />
Peasant farmers in Ethiopia may not be able to purchase fertilizer because of lack of capital even<br />
if they are aware of the use of fertilizer. On top of this, the amount of fertilizer required to<br />
maximize profit is higher than what the farmers actually use on their wheat crops. Thus, in order<br />
to provide farmers the necessary capital and increase the amount of fertilizer use, efficient credit<br />
delivery mechanism has to be designed. Thus, policy makers, researchers and farmers should pay<br />
attention to the principle of fertilizer economics in durum wheat production.<br />
REFERENCES<br />
Bekele Geletu, Amanuel Gorfu, and Getnet Gebeyehu. 1993. <strong>Wheat</strong> l;'roduction and Research in Ethiopia:<br />
Constraints and Sustainability. pp. 18-25. Tanner D.G. (ed.). <strong>The</strong> Eighth <strong>Regional</strong> <strong>Wheat</strong> <strong>Workshop</strong> for<br />
<strong>Eastern</strong>, Central and Southern Africa. Kampala, Uganda. June 7-10. 1993.<br />
CIMMYT. 1988. From Agronomic Data to Farmer Recommendations: An Economics Training Manual.<br />
Completely Revised Edition. Mexico. D.F.<br />
CSA.1996. Central Statistical Authority. Agricultural Sample Survey. Report on Land Utilization. Addis Ababa.<br />
Ethiopia.<br />
Annual Research Report. Debre Zeit Agricultural Research Center. 1990/91. Debre Zeit, Ethiopia.<br />
Deresse Kassu. 1988. Economic Analysis of Fertilizer uses in Maize and Sorghum Production. M.Sc. <strong>The</strong>sis.<br />
AUA. Alemaya.<br />
Ellis F. 1988. Peasant Economics: Farm Households and Agrarian Development. Cambridge University Press.<br />
Jauregui, M.A., and G.E. Sain. 1992. Continuous Economic Analysis of Crop Response to Fertilizer in On-Farm<br />
research. CIMMYT Economics Paper No.3. Mexico, D.F.: CIMMYT.<br />
Koutsoyiannis A. 1979. Modern Microeconomics. Second Edition. <strong>The</strong> Macmillan Press Ltd. Hong Kong.<br />
Koutsoyiannis A. 1977. <strong>The</strong>ory of Econometrics. Second Edition. <strong>The</strong> Macmillan Press Ltd. Hong Kong.<br />
Singh S.R. 1986. Technological Parameters in Agricultural Production Function. Ashish Publishing House, New<br />
Delhi.<br />
Workneh Negatu. 1989. Summary Report on the Informal Survey of the Farming System in the Mid-Altitude<br />
Zone of Ada Province with Particular Emphasis on <strong>Wheat</strong>, Tef, Chickpea and Lentil Production<br />
(unpublished).<br />
401
Economics oJJertilizer use on durom wheat - Hailemariam and Gezahegn<br />
Questions and Answers:<br />
D.G. Tanner (Comment): <strong>The</strong> current study is based on the response of durum wheat to<br />
fertilizer on flat waterlogged Vertisols. With improved drainage, such as the BBF system, N<br />
and P response would increase markedly as well as grain yield - up to 6 tlha.<br />
Wolfgang Pfeiffer: Since the N response ofthe genotypes used in your study will affect the<br />
results, there must be a substantial difference between dwarf modern and talllandrace<br />
genotypes. Have these differences in response pattern been considered?<br />
Answer: No, the study considered a tall variety only (Boohai variety). I feel that there should<br />
be a variety specific study on fertilizer response.<br />
Table 1.<br />
Economic optimum levels of Nand P with the corresponding wheat yield,<br />
cost of nutrients and net returns.<br />
P u Pp P,.; N* P* .. Yield Gross Field Costs " Net<br />
(Birr~/kg) (Birrlkg) "(Birr/kg) ,(kg/tis)' (kg/~a) (kg/ha) Benefit ',that Vary ' Benefit<br />
(Birr/ba) , (Bh-r/ba) (Bi~r/ha)<br />
4.00 2.71 1.98 92.20 12.64 2169 4294.62 604.58 3690.04<br />
4.89 3.28 1.98 82.29 8.70 2126 4209.48 646.40 3563.08<br />
4.00 2.71 2.28 98.11 15.54 2190 5006.88 651.83 4355.05<br />
4.89 3.28 2.28 89.40 11.81 2158 4920.24 713.85 4206.39<br />
Table 2.<br />
Comparison between optimum and farmers' fertilizer practice.<br />
, -Item' F~qners"fedmzer ' , Optimum fertilizer<br />
'. Qrac(ice' practice<br />
Fertilizer rate (kglha)<br />
- Nitrogen 39.20 92.20<br />
- Phosphorous 10.03 12.64<br />
Predicted grain yield (kg/ha) 1896.00 2169.00<br />
Cost of nutrients(Birrlha) 275.97 604.58<br />
Net Benefit (Birr/ha) 3478.51 3690.04<br />
Increment relative to fanners' practice<br />
- Grain yield (kg/ha) 273.00<br />
- Cost of nutrients (Birr/ha) 328.61<br />
- Net Benefit (Birrlha) 211.93<br />
Marginal Rate ofReturn (%) 65<br />
402
ON-FARM ANALYSIS OF DURUM WHEAT PRODUCTION TECHNOLOGIES <br />
IN CENTRAL ETHIOPIA<br />
Kenea Yadeta, Setotaw Ferede, Hailemariam TlWold and Fasil KlWork<br />
Debre Zeit Agricultural Research Center, P.O. Box 32, Debre Zeit, Ethiopia<br />
ABSTRACT<br />
On-farm analysis of three newly released durum wheat varieties (Foka, Kilinto<br />
and Quami) and two check wheat varieties (Boohai and ET-13) under two<br />
alternate management packages (an improved practice comprising 100 kglha<br />
DAP, 100 kg/ha urea and a seed rate of 150 kg/ha vs. farmers' practice<br />
comprising 100 kg/ha DAP, 50 kglha urea and a 130 kglha seed rate) was<br />
conducted at Alemtena, Shenkora, Minjar and Tullubollo areas in central<br />
Ethiopia for two years. <strong>The</strong> results indicate that there was no significant<br />
difference among the varieties for grain and straw yield across locations.<br />
However, the difference between the management practices was significant in<br />
most trials. <strong>The</strong> improved practice gave a grain yield advantage of 16, 18 and<br />
19% at Alemtena, Shenkora and Tullubollo, respectively, and a straw yield<br />
advantage of 13.6% at Shenkora and 14.9% at Tullubollo over farmers'<br />
practice. <strong>The</strong> improved practice also provided a marginal rate of return of<br />
168% at Alemtena, 332% at Tullubollo, and 365% at Shenkora cf. the<br />
farmers' practice. Farmers rating indicated that the new varieties are better<br />
than the checks in terms of grain quality for making certain local dishes, straw<br />
quality for feed, disease resistance and weed competition. Given these merits<br />
and the goal of increasing varietal diversity, demonstration and large-scale<br />
dissemination of the three new varieties and the improved management<br />
practice are recommended. However, to ensure wider adoption of these<br />
technologies, the promotion of strong horizontal linkages between the local<br />
wheat processing industries and the farming sector' is advisable.<br />
INTRODUCTION<br />
<strong>Wheat</strong> is a staple food crop for most households in rural and urban areas in Ethiopia.<br />
However, wheat yield is low and unstable due to several technical and socio-economic<br />
constraints. Weed competition, low or declining soil fertility, diseases, particularly rust, in<br />
appropriate use of agronomic practices such as seeding rate, sub-optimal fertilizer application<br />
and herbicide use are some of the major technical constraints (DZARC, 1989; Hailu and<br />
Chi lot, 1992; Workneh and Mwangi, 1993). Limited supply of seeds of improved varieties,<br />
high prices and unavailability of augmenting technologies like fertilizer and herbicides in<br />
required quantity and at required time, and inadequate cash or credit for purchase of inputs<br />
are the major socio-economic constraints.<br />
<strong>The</strong> short life span of improved varieties in production is also another constraint to increased<br />
and sustainable wheat production. It was estimated that the mean number of years a new<br />
variety stays in production is low - about four years - and ranges from 2.5 to 4 years (Regassa<br />
et ai., 1998), beyond which the yield starts to decline, or their disease resistance breaks down.<br />
403
On-farm analysis ofdurum wheat production technologies - Kenea et al.<br />
<strong>The</strong>refore, for wheat production to be sustainable, varieties should be replaced frequently and<br />
continuously, and management practices must also be developed and fine-tuned continuously.<br />
As an effort to develop new varieties to replace already released varieties or to increase<br />
diversity, three new durum wheat varieties (Foka, Kilinto, Quami) have been recently<br />
developed and released by research scientists in the <strong>Wheat</strong> Improvement Program. Improved<br />
agronomic practices (seeding rate of 150 kglha and blanket fertilizer recommendation of 100<br />
kg DAP and urea) were also recommended. But these technologies, varieties and agronomic<br />
recommendations, need to be fine-tuned further under farmers' conditions. <strong>The</strong>refore,<br />
evaluation of these technologies was conducted under farmers' condition in some areas in the<br />
central part of the country. This paper presents the results of agronomic and economic<br />
analysis of the performance of these varieties and the improved agronomic practice and the<br />
results of farmers' assessments of the varieties from different criteria.<br />
MATERIALS AND METHODS<br />
On farm evaluation was conducted at Tullubollo, Minjar and Shenkora locations in the<br />
central highlands and at Alemtena in the rift valley area of the country for two consecutive<br />
years (1997/98 and 1998/99). Alemtena is a drought-prone area as it is in the rift valley and a<br />
red light soil is a dominant type. At Tullubollo and Shenkora, the heavy black Vertisol is<br />
dominant. <strong>The</strong> soils in Minjar are light black soil as termed by the farmers. <strong>The</strong> improved<br />
varieties were evaluated along with two other already released varieties (Boohai and ET -13),<br />
which served as standard check, under improved and farmers' management practices. <strong>The</strong><br />
improved practices, as already stated, were a seed rate of 150 kglha and fertilizer rate of 100<br />
kglha ofDAP and 100 kglha of urea, while the farmers' practices were seed rate of 130 kglha<br />
and fertilizer rate of 100 kglha of DAP and 50 kglha of urea, which are average of the<br />
farmers' current practices. All other practices such as methods, timing and frequency of<br />
plowing, weeding and harvesting, were left to farmers' decision and practices. <strong>The</strong> trial was<br />
arranged in split plot design, management being on the main plot while varieties were on subplots,<br />
with two replications per site. <strong>The</strong> main plot size was 10m x 10m while the sub-plot<br />
size was 5m x Sm. Data were then collected on grain and straw yield and SUbjected to<br />
analysis of variance for agronomic analysis. <strong>For</strong> economic feasibility evaluation, input and<br />
output prices were collected and both partial budgeting and marginal rate of return analyses<br />
were conducted according to the CIMMYT (1988) methodology for treatments with<br />
significant agronomic response. Farmers' evaluation of the varieties was also elicited and a<br />
variety index was constructed for each criterion following Maxwell et al. (1995).<br />
RESULTS AND DISCUSSION<br />
<strong>The</strong> effect of variety on grain yield was not significant at all locations (Table 2). This can also<br />
be seen from the very marginal grain yield difference among varieties at both management<br />
practices (Table 1). This result agrees with the previous results from on station experiment<br />
including Boohai, Kilinto, and Foka at Alemtena (DZARC, 1996) which showed no<br />
significant yield difference. A cluster analysis at Debre Zeit, Akaki, Chefe Donsa, Alemtena,<br />
Enewary, Sinana and Ambo locations (DZARC, 1997) also indicate that Boohai, Foka and<br />
Kilinto varieties fell into the same cluster group. <strong>The</strong>se results are expected as all of them are<br />
reported to have adaptation both to drought prone and highland areas (DZARC, 1996). <strong>The</strong><br />
practice main effect was found to be significant at all locations except at Minjar, but its effect<br />
was more pronounced (p:S; 0.01) at Tullobollo and Alemtena than at Shenkora (p:S;0.05) (Table<br />
2). <strong>The</strong> improved practice gave a grain yield advantage of 16, 18 and 19% at Shenkora,<br />
Alemtena and Tullubollo, respectively. <strong>The</strong> results at Tullubollo and Shenkora agree with the<br />
404
On-farm analysis ofdurum wheat production technologies - Kenea et at.<br />
blanket fertilizer recommendation of 100 DAP and 100 urea (50 kg top dressing) on heavy<br />
black soils with waterlogged problem (DZARC, 1996). This result also supports the previous<br />
findings from on farm experiment on response of Boohai variety to fertilizer under<br />
recommended seeding rate at Akaki, Ada and Gimbichu which revealed the highest grain<br />
yield at the improved practice (Workneh and Mwangi, 1992). <strong>The</strong> significant effect of<br />
practice at Alemtena may be partly due to the effect of fertilizer on plant growth and<br />
development. As it is an area characterized with less moisture stress, increased fertilizer rate<br />
may promote fast and early plant growth and development thereby significantly increase<br />
grain yield. This was also reported by farmers who hosted the on farm evaluation. <strong>The</strong> nonsignificant<br />
effect of practice at Minjar could be attributed to the natural high fertility of the<br />
soil. This agrees with the farmers' explanation that high fertilizer application on light textured<br />
soils induces plant lodging. <strong>The</strong> year effect was highly significant at all locations except at<br />
Minjar, which may be due to significant difference in the amount and distribution of rainfall<br />
between the two years at all locations except Minjar. However, the interaction effect of<br />
variety by year was less pronounced at Minjar and non-significant at all other locations,<br />
indicating lesser tendency or the non-existence of a tendency to change in ranking of varieties<br />
with year. Other interaction effects on grain yield were non-significant except practice by<br />
variety (PsO.1 0) at Minjar and Alemtena and practice by year (PSO.1 0) at Alemtena.<br />
<strong>The</strong> effects of variety, practice and their interaction on straw yield were not significant at all<br />
locations except practice effect at Shenkora and Tullubollo (Table 3). <strong>The</strong> year effect for<br />
straw yield was significant at all locations, maybe for similar reasons as for grain yield. <strong>The</strong><br />
insignificant effect of variety on straw yield may also be for similar reason as for grain yield.<br />
At Tullubollo and Shenkora, higher and significant straw yield was obtained from improved<br />
practice. It gave a straw yield advantage of 13.6% at Shenkora and 14.9% at Tullubollo over<br />
the farmers' practice. Miressa et al. (1991) from on-station experiment reported that<br />
increasing nitrogen application on Vertisols under the recommended seeding rate results in<br />
highly significant increase in straw yield of durum wheat. This is ascribed to the low total<br />
nitrogen and organic matter content of Vertisols (Mires sa et ai., 1991).<br />
As significant agronomic response was observed for practice effect only, economic analysis<br />
was conducted for practice effect alone. Its result indicates that both practices provided<br />
positive net benefit at all locations. Higher net benefit was, however, obtained from the<br />
improved practice, which agrees with the agronomic results. <strong>The</strong> improved practice also<br />
provided a marginal rate of return greater than the minimum acceptable rate of 100%<br />
(CIMMYT, 1988) at all locations (Table 4).<br />
Results of farmers' asse3sments of the varieties evaluated were given in Table 5. It indicates<br />
that the new varieties are better than Boohai in weed resistance, shattering resistance and<br />
straw palatability for animal feed. But they were rated to have lodging problem except<br />
Kilinto and ET -13 compared to Boohai. All the new varieties have either comparable<br />
(Quami) or better ease of harvesting and bundling (Kilinto and Foka) than Boohai variety.<br />
ET -13 was rated the best for ease of threshing. Except Foka, the other new varieties were<br />
rated to have better ease of threshing than Boohai. All of the new varieties except Kilinto<br />
were rated better than Boohai in water logging resistance while ET -13 was rated the most<br />
susceptible one. In terms of bread quality, all of the new varieties were rated closely with<br />
Boohai except ET-13. ET-13 was also rated not suitable for kinche, while Quami was rated<br />
better than Boohai, when others were rated inferior. In terms of quality of roasted grains, all<br />
varieties were rated to be better than Boohai. Except Quami, all were rated to be better in<br />
injera quality than Boohai. <strong>For</strong> disease resistance, the new varieties were rated either equal<br />
405
On-farm analysis ofdurum wheat production technologies - Kenea et al.<br />
(Kilinto) or better than Boohai (Quami and Foka), while ET-13 was rated to be the least<br />
resistant. Maturity wise, Quami and Foka were rated to be late maturing followed by Boohai.<br />
ET -13 and Kilinto were rated to be equally early maturing ones.<br />
CONCLUSIONS<br />
This study revealed that there was no significant grain and straw yield differences between<br />
the new and check varieties. However, with respect to disease resistance, Boohai variety was<br />
reported to be susceptible to leaf rust disease (DZARC, 1996). This indicated that the new<br />
varieties are better than Boohai in their disease reaction and thus there is a need to replace<br />
Boohai with these resistant varieties. Farmers also rated the new varieties better in terms of<br />
disease resistance, grain quality for some local dishes, and straw quality for feed. Given these<br />
merits of the new varieties, demonstration and dissemination of the new varieties is<br />
commendable. Given the disease resistance, farmers' priority is, however, yield or income<br />
maximization, and other criteria are somewhat secondary as there are alternative means of<br />
coping with some of them. Farmers indicated that the new varieties are not better than the<br />
currently widely grown bread wheat varieties like Kubsa and Pavon. This difference is<br />
explained by the tetraploid nature of durum wheat, whose yield as a result is generally lower<br />
than bread wheat, which is a hexaploid. Although farmers expect that the new varieties will<br />
fetch the same price as other durum wheat varieties, which is often greater than the price paid<br />
for bread wheat in the domestic markets, this price advantage of the durum wheat varieties is,<br />
however, not sufficient to surpass the yield advantage of bread wheat. <strong>The</strong>refore, to ensure<br />
wider adoption of these varieties or durum wheat technologies in general, policies that<br />
improve the price margin for durum wheat need to be in order. One means is promoting<br />
strong horizontal linkage between the local processing industries and the farming sector.<br />
Until recently, this linkage is either non-existent or very weak, as most processing industries<br />
depend for their raw material need on imports from abroad. <strong>The</strong>re is lack of awareness by the<br />
local processing industries about the quality standard and for some even the availability of<br />
durum wheat in the domestic market. Thus, awareness creation through research product fairs<br />
for processing industries will play an essential role leading to increased demand in the local<br />
market.<br />
<strong>The</strong> study also revealed that with improved practice the hew varieties provided a grain and<br />
straw yield advantage and were economically more feasible cf. the local practice. As a result,<br />
demonstration of the improved practice is also commendable. However, as the results at<br />
Minjar and other locations further indicate the possible agronomic and economic feasibility<br />
of reduced and additional nitrogen, respectively, beyond the given experimental range, a<br />
further fine tuning study both on station and on farm to determine the optimum nitrogen<br />
fertilizer application is suggested.<br />
REFERENCES<br />
CIMMYT. 1988. From Agronomic Data to Farmer Recommendations: An Economic Training Manual.<br />
Completely Revised Edition. Mexico, D. F.: CIMMYT.<br />
Debre Zeit Agricultural Research Center (DZARC). 1997. AIIDual Research Report, 1994/95. Debre Zeit,<br />
Ethiopia.<br />
Debre Zeit Agricultural Research Center (DZARC). 1989. Annual Research Report, 1988/89. Debre Zeit,<br />
Ethiopia.<br />
Debre Zeit Agricultural Research Center (DZARC). 1996. Annual Research Report, 1993/94. Debre Zeit,<br />
Ethiopia.<br />
406
On-farm analysis ofdurum wheat production technologies - Kenea et al.<br />
Hailu Beyene and Chilot Yirga. 1992. An Adoption Study of Bread <strong>Wheat</strong> Technologies in Wolmera and Addis<br />
Alem Areas of Ethiopia. In: Hailu Oebre Mariam, D.O. Tanner and Mengistu Hulluka (eds.). <strong>Wheat</strong><br />
Research in Ethiopia: A Historical Perspective. Addis Ababa: IARICIMMYT.<br />
Maxwell, S., D. Belshaw and Alemayehu Lirenso. 1994. <strong>The</strong> Disincentive Effect of Food <strong>For</strong> Work on Labor<br />
Supply and Agricultural Intensification and Diversification in Ethiopia. Journal of Agricultural<br />
Economics 45: 351-359.<br />
Miressa Duffera, Tekaligne Mamo, Mesfin Abebe and Samuel Geleta. 1991. Response of Four <strong>Wheat</strong> Varieties<br />
to Nitrogen on Highland Pellic Vertisols in Ethiopia. In: D.G. Tanner and W. Mwangi (eds.). <strong>The</strong><br />
Seventh <strong>Regional</strong> <strong>Wheat</strong> <strong>Workshop</strong> for <strong>Eastern</strong>, Central and Southern Africa. Nakuru, Kenya.<br />
Regassa Ensermu, Wilfred Mwangi, Hugo Verkujil, Mohammed Hassena and Zewdie Alemayehu. 1998.<br />
Farmers' <strong>Wheat</strong> Seed Sources and Seed Management in Chilalo Awraja, Ethiopia. Mexico, D.F.: JAR<br />
andCIMMYT.<br />
Workneh Negatu and W. Mwangi. 1992. An Economic Analysis of the Response of Durum <strong>Wheat</strong> to Fertilizer:<br />
Implications for Sustainable <strong>Wheat</strong> Production in the Central Highlands of Ethiopia. In: D.G. Tanner<br />
(ed.). <strong>The</strong> Eighth <strong>Regional</strong> <strong>Wheat</strong> <strong>Workshop</strong> for <strong>Eastern</strong>, Central and Southern Africa. CIMMYT.<br />
Questions and Answers:<br />
Hugo van Niekerk: What are the major reasons for the high seed rate? Is this not an<br />
economic consideration?<br />
Answer: Agronomic practices are primary reasons. Seed is broadcast by hand, sometimes<br />
with a poor seedbed, and the eventual number of plants is much less than is normal when<br />
using tractor driven equipment. High seed rate is also the first line of defense against weeds.<br />
Also, the seed rate for durum is higher than for bread wheat.<br />
Miriam Kinyua: <strong>The</strong> difference in seed rate used in Ethiopia and South Africa is very high <br />
150 kglha vs. 25-50 kgiha, respectively. Why this big difference?<br />
Answer: Land preparation and method ofplanting playa great role in determining the<br />
optimal seed rate. SA farmers prepare land well and use seeders. Ethiopian farmers use<br />
animal drawn implements.<br />
407
On-farm analysis ofdurum wheat production technologies - Kenea et at. <br />
Table 1. Grain and straw yield (kg/ha) of wheat varieties evaluated with improved and local practices. <br />
Grain yield Straw yield<br />
Location Practice Foka Kilinto Quami , ET-13 Boohai Foka Kilinto Quami , ET-13 BOQhai<br />
Shenkora Improved 2227 2391 2287 2655 2140 3691 3475 4145 4447 3743<br />
Local 1857 1939 1818 2578 1718 3423 3276 3281 3838 3348<br />
Minjar Improved 2327 2048 2079 2102 2199 3697 3713 4333 4022 3763<br />
Local 2137 1974 2315 2079 1639 4099 3563 3984 3877 3735<br />
Alemtena Improved 1392 1774 1569 1729 1680 2901 3543 3255 3795 3219<br />
Local 1464 1294 1255 1408 1572 3323 3112 2738 3491 3202<br />
TuliuBolio Improved 2190 2176 2170 2166 2107 3281 3444 3708 3719 3578<br />
Local 1814 1773 1930 1660 1895 3094 2955 3133 3347 2904<br />
Mean Improved 2049 2094 2035 2136 2038 3357 3531 3819 3929 3567<br />
Local 1815 1739 1847 1850 1737 3423 3178 3259 3578 3229<br />
-<br />
Table 2. Results of analysis of variance for wheat grain yield at the four locations.<br />
"<br />
, Location<br />
' '<br />
" Sherikora Minjar<br />
--- -<br />
t F-test significant at P < 0.10 level; * F-test significant at P < 0.05 level; ** F-test significant at P < O.Ollevel. <br />
Alemterina Tulubolo<br />
Source of variation d:f. Mean F-value Mean F-value ' Mean ·F-value ,Mean , F-valu-e<br />
Square' Square Square 'sQuare<br />
Main effects <br />
~ Practice 1 2390079 4.88** 298004 1.67 1061397 11.38** 44948075 12.37** <br />
~ Variety 4 741056 1.51 268567 1.50 135193 1.45 53264 0.15 <br />
~Year 1 9795689 19.98** 494 0.003 4871908 52.24** 34239141 94.24** <br />
2-way interaction <br />
~ Practice x Variety 4 36982 0.08 336618 1.88t 184310 1.98t 102941 0.28 <br />
~ Practice x Year 1 513172 1.05 62758 0.35 507246 5.44* 357426 0.98 <br />
~ Varietv x Year 4 167450 0.34 351077 1.96t 70430 0.76 106354 0.29 <br />
3-way interaction ~ <br />
~ Practice x Variety x Year '±-- 71506 0.15 68591 0.38 62702 0.67 45833 0.13 <br />
408
Onjann analysis ofdurum wheat production technologies - Kenea et at.<br />
Table 3. Results of analysis of variance for wheat straw yield at the four locations.<br />
. Location -- -<br />
Shenkora Minjar Alemtt~nna _-; Tulubolo . ;: ::<br />
Source of variation d.f. . Mea~ F-value Mean F-value Mean F-value Me:)n F~v~lue<br />
Square Square Square Square<br />
Main effects <br />
-+ Practice 1 3359854 3.05t 58717 0.06 575493 1.03 7388875 14.9** <br />
-+ Variety 4 1063703 0.97 633844 0.64 979556 1.76 655624 1.31 <br />
-+ Year 1 5814463 5.28* 1955360 19.8** 16072314 28.89** 20533349 41.1** <br />
2-way interaction <br />
-+ Practice x Variety 4 227640 .21 313801 0.32 580758 1.04 248854 0.5 <br />
-+ Practice x Year 1 454656 0.35 40081 0.04 110277 0.2 228278 0.46 <br />
-+ Variety x Year 4 3869992 0.41 156792 0.16 421253 0.76 385691 0.77 <br />
13-way interaction<br />
-+ Practice x Variety x Year 4 163820 0.15 641089 0.65 566310 1.02 169460 0.34<br />
t F-test significant at P < 0.10 level; * F-test significant at P < 0.05 level; ** F -test significant at P < 0.01 level.<br />
409
On-farm analysis ofdurum wheat production technologies - Kenea et al.<br />
Table 4.<br />
Net benefits and marginal rates of return for the two management<br />
practices at three locations.<br />
Marginal Marginal<br />
Total Costs N~t Marginal Net Rate of<br />
Location Practice that Vary Benefit Cost Benefit Ret~r-n (%)<br />
Tullubollo Local 540.35 256.85<br />
Improved 670.69 3000.70 130.34 432.85 332 <br />
Alemtena Local 522.71 2219.91 <br />
Improved 651.26 2435.30 128.55 215.39 168 <br />
Shenkora Local 560.42 3069.44 <br />
Improved 696.92 3567.25 136.50 497.81 365 <br />
Table 5.<br />
Results of farmers' assessment of varieties.<br />
Variety index for characteristics <br />
Characteristic ET-13 *ilinto Quami Foka BQohai <br />
Weed resistance 67 86 96 93 87 <br />
Less shattering 53 93 93 87 80 <br />
Straw palatability for feed 76 76 80 68 68 <br />
LodginE resistance 92 88 57 68 70 <br />
Ease ofharvesting and bundling 70 100 90 100 90 <br />
Ease ofthreshinK 80 52 68 45 50 <br />
Water logging resistance 33 67 100 80 73 <br />
Bread quality 55 76 75 65 80 <br />
Kinche quality - 80 100 80 93 <br />
lnjera quality 80 80 30 86 50 <br />
Taste roasted 90 92 76 87 75 <br />
Disease resistance 70 90 100 100 90 <br />
Early_ maturi!y 80 80 60 57 65 <br />
Variety index is computed as per Maxwell et al. (1995): <br />
= L: (Number ofresponses for each rank x corresponding weight of rank) x 100 <br />
Total number of responses x highest weight<br />
,J<br />
410
A STUDY OF THE ADOPTION OF <br />
BREAD WHEAT PRODUCTION TECHNOLOGIES IN ARSI ZONE <br />
Setotaw Ferede l , D.G. Tanner2, H. Verkuijl3 and Takele Gebre 4<br />
IDZARC (EARO), P.O Box 32, Debre Zeit, Ethiopia <br />
2CIMMYT/CIDA EACP, P.O. Box 5689, Addis Ababa, Ethiopia <br />
3Royal Tropical Institute, Agriculture & Enterprise Development, <br />
Mauritskade 63, P.O. Box 95001, 1090HA Amsterdam, <strong>The</strong> Netherlands <br />
4SG2000, P.O. Box 12771, Addis Ababa, Ethiopia <br />
ABSTRACT<br />
Tremendous efforts have been exerted towards the development and<br />
dissemination of improved bread wheat (Triticum aestivum) production<br />
technologies in Arsi Zone of Ethiopia since the inception of comprehensive<br />
integrated package projects in the late 1960s. <strong>The</strong> current study examined the<br />
rate of adoption of wheat production technology and identified factors<br />
influencing the adoption of those technologies. A total of 300 farm households<br />
were surveyed in the five major wheat growing areas of Arsi Zone during May<br />
1999. About 95% of the sampled farmers had grown wheat during the 1998<br />
cropping season. <strong>The</strong> sampled farmers produced a total of 13 different wheat<br />
varieties during 1998. Survey results revealed that 91.5% of the farmers<br />
adopted improved bread wheat varieties: Kubsa (39% of growers) and Pavon<br />
(25% of growers) were the two most widely adopted varieties in the region. In<br />
terms of the total wheat area, the six dominant varieties covered 92.5% of the<br />
wheat area, while semi-dwarf bread wheat varieties occupied 88.5% of the<br />
total wheat area. About 73% of wheat growers planted a single variety of<br />
wheat. DAP and urea fertilizers were adopted by 92 and 26% of the wheat<br />
growers, respectively. More than half of the fertilizer adopters (57.6%)<br />
applied DAP on wheat fields at a rate between 76 and 100 kg/ha. <strong>The</strong> level of<br />
,urea application was quite low: 17.5 kg/ha was the mean urea application rate<br />
for the sampled wheat growers. About 32% of the urea adopters practiced top<br />
dressing of urea. Only about 15% of the wheat growers adopted the current<br />
blanket fertilizer recommendation (100 kg DAP and 100 kg urea per ha) on<br />
wheat fields. While the majority of the wheat growers (84%) practiced hand<br />
weeding, about 63% adopted chemical weed control and frequently at<br />
suboptimal rates: wheat growers, on average, applied 0.46 I of 2,4-D herbicide<br />
per ha of wheat. Finally, logistic regression analyses revealed that institutional<br />
factors, principally access to credit, extension contacts, and farmer education<br />
level, significantly influenced the adoption of bread wheat production<br />
technologies.<br />
INTRODUCTION<br />
<strong>Wheat</strong> is one of the major cereal crops in Ethiopia both in terms of area and total production. <br />
Over the period 1992-95" annual wheat production was 0.783 million t of wheat produced on <br />
411
A study o/the adoption o/bread wheat production technologies in Arsi Zone - Setotaw et a/.<br />
0.693 million ha ofland, revealing a low mean national yield of 1.2 tlha (CSA, 1995b), and<br />
accounting for 14% and 13% of total cereal production and cultivated area, respectively. <strong>The</strong><br />
apparent low productivity can be attributed to several factors (Tanner et al., 1993) including:<br />
limited adoption of high-yielding varieties, fertilizer and other modern inputs, slow progress<br />
in developing wheat cultivars with durable resistance to diseases, and depleted soil fertility.<br />
<strong>The</strong> existing low levels of wheat production and productivity cannot meet the growing<br />
demand for food due to a rapidly increasing population in conjunction with changing<br />
consumption patterns. As a result, the level of wheat self-sufficiency at the national level in<br />
Ethiopia is estimated at only 55%, necessitating importation to fill the gap (Tanner and<br />
Mwangi, 1992). A significant improvement in wheat production can be realized by raising<br />
yields per unit area through the intensive application of improved wheat production<br />
technologies. Such intensification should encourage the correct utilization of existing<br />
technologies and/or the adoption of new ones.<br />
Arsi Zone hosted a long-term comprehensive integrated rural development project (i.e.,<br />
CADUIARDU) beginning in 1967. Since that time, additional agricultural research and<br />
development activities have been implemented in the region, benefiting local farmers through<br />
the dissemination of improved agricultural technologies. Different adoption studies have been<br />
conducted in Arsi Zone to assess the level of and factors influencing technology adoption<br />
(Aregay, 1980; Mulugetta, 1995). One limitation of adoption studies is that the results relate<br />
to a specific base year whereas constraints and opportunities are dynamic and vary from year<br />
to year. Generating the latest information, therefore, will keep stakeholder groups aware of<br />
the acceptance and performance of the existing and/or new research outputs on farmers'<br />
fields. This study was conducted in Arsi Zone with the main objective of examining the<br />
socio-economic factors that influence the adoption of selected wheat production<br />
technologies. <strong>The</strong> specific objectives of the study were:<br />
1. to assess and quantify the extent of adoption of improved bread wheat production<br />
technologies; and<br />
2. to identify factors influencing the adoption of improved bread wheat production<br />
technologies.<br />
MATERIALS AND METHODS<br />
<strong>The</strong> Study Area<br />
<strong>The</strong> five surveyed woredas are located in Arsi Zone in south-eastern Ethiopia, with elevations<br />
ranging from 1980 to 3760 m a.s.l. Arsi Zone is characterized by a cereal-dominated farming<br />
system in which bread wheat and barley are the major crops. In the 1994/95 cropping season,<br />
cereals accounted for 80% of the total cultivated land in the region (CSA, 1995a): according<br />
to the same survey, wheat (28%) and barley (22%) comprised 50% of the total cropped area.<br />
Sampling Method and Data Analysis<br />
<strong>The</strong> survey was conducted in the five major wheat-producing woredas of Arsi Zone: Asasa,<br />
Bekoji, Etheya, Lole, and Robe. Within each of the five woredas, Peasant Associations (PAs)<br />
which had been intensively served by technology dissemination agents for many years were<br />
selected, while farmers were randomly selected from within the selected PAs. A sample of 60<br />
farmers was taken from each woreda; thus, a total sample comprising 300 small-holder<br />
412
A study ofthe adoption ofbread wheat production technologies in Arsi Zone - Setotaw et al.<br />
farmers was surveyed during May 1999. Data were collected using a structured<br />
questionnaire.<br />
Survey data were collected on farm household characteristics, farm resources, farming<br />
practices, and the adoption of wheat varieties, fertilizer and herbicide.<br />
Descriptive statistics (i.e., means and ratios) were used to describe the characteristics of the<br />
falming households and the rates of technology adoption. A multivariate logistic regression<br />
model was used to identify factors influencing the adoption of selected bread wheat<br />
production technologies (i.e., improved varieties, fertilizer and herbicide). <strong>The</strong> logistic model<br />
is expressed in terms of the natural log of the odds ratio (i.e., the ratio of the probability that<br />
the farmer will adopt a given technology (P) to the probabili ty he will not adopt (1-P)), which<br />
is called logit:<br />
where pj is the estimated coefficient associated with variable Xi for k independent variables<br />
included in the regression. <strong>The</strong> logistic regression coefficients are estimated using the<br />
maximum likelihood method. In the current study, the dependent variable in each model is<br />
the decision of the farmer whether or not to adopt improved bread wheat production<br />
technologies (i.e., improved varieties, fertilizer, and herbicide). It was hypothesized that the<br />
adoption of bread wheat production technologies is influenced by multiple socio-economic<br />
and institutional factors in the study area.<br />
RESULTS AND DISCUSSION<br />
Socio-economic Characteristics<br />
<strong>The</strong> mean age of the surveyed household heads was 46.9 years with an average family size of<br />
6.9 persons (Table 1). Nearly 54% of the farmers were illiterate; 17.1% and 7.5% had<br />
completed primary and secondary school education, respectively. <strong>The</strong> remaining 21.5% of<br />
the farmers possessed basic literacy skills. Seventeen per cent of the surveyed households<br />
were headed by females (Table 1).<br />
Land holdings in the study area are relatively small with a mean farm size of 10.70 timad (2.7<br />
ha) varying from 7.48 timad (1.9 ha) in Etheya woreda to 14.27 timad (3.60 ha) in Bekoji<br />
(Table 2). <strong>The</strong> areas allocated for grazing and fallowing are very limited. <strong>For</strong> farmers<br />
reporting such land use, the mean area of grazing land was 0.78 ha while the mean area of<br />
fallow was 0.66 ha; however, only 58 and 36% of the surveyed farmers reported allocating<br />
land for grazing and fal1ow, respectively. Thus, across Arsi Zone, land allocated for grazing<br />
and fallow represented 17.0% and 8.9% of the total owned land, respectively. <strong>The</strong> problem of<br />
land scarcity was particularly apparent in Etheya and Robe woredas where there is a<br />
pronounced deficit of grazing land and where fallowing is virtually non-existent. To partially<br />
alleviate the land shortage problem, 22% and 21 % of the farmers rented-in land for crop<br />
production and grazing purposes, respectively. Share cropping arrangements are also<br />
common in the study area (Table 2). A minority of the farmers shared or rented-out land,<br />
usually due to a shortage of either draught power (i.e., oxen) or inputs (i.e., seed and<br />
fertilizers).<br />
413
A study ofthe adoption ofbread wheat production technologies in Arsi Zone - Setotaw et al.<br />
<strong>The</strong> mean number of livestock kept on the farm ranged from 4.9 TLU in Etheya to 9.75 TLU<br />
in Asasa (Table 2). <strong>The</strong> relatively low livestock population in Etheya can perhaps be<br />
attributed to the land shortage constraint in the area. On average, an individual household<br />
owned 2.13 oxen.<br />
Improved varieties<br />
Adoption of Bread <strong>Wheat</strong> Production Technologies<br />
Of the total sample of 300 farmers m Arsi Zone, 95% planted wheat during the 1998<br />
cropping season (Table 3).<br />
<strong>The</strong> characteristics of the known bread wheat varieties produced in Arsi Zone during 1998<br />
are listed in the following table:<br />
Variety '. 'Date ofrelease . Current status<br />
Israel ? under production<br />
Enkoy 1974 obsolete<br />
K6290-Bulk 1977 under production<br />
K6295-4A 1980 under production<br />
ET-13 1981 under production<br />
Pavon-76 1982 under production<br />
Batu 1984 obsolete<br />
Dashen 1984 obsolete<br />
Mitike (HARI709) 1993 under production<br />
Wabe (HAR710) 1994 under production<br />
Kubsa (HARI685) 1994 under production<br />
Galama (HAR604) 1995 under production<br />
<strong>The</strong> varieties Dashen and Batu became obsolete due to a new stripe rust (Puccinia<br />
striiformis) pathotype which resulted in a severe stripe rust epidemic in Ethiopia during<br />
1988-89 (Bekele and Tanner, 1995). <strong>The</strong> variety Enkoy became obsolete as a result of a new<br />
stem rust (P. graminis f.sp. trifici) pathotype which resulted in a severe stem rust epidemic in<br />
Ethiopia during 1993-94 (Bekele and Tanner, 1995). <strong>The</strong> variety Israel was never officially<br />
released, and there is no information conceming its introduction to Ethiopia (Amsal et al.,<br />
1995) - probably more than 100 years ago (i.e., before there was an agricultural research<br />
program). It continues to be produced by peasant fanners throughout Arsi Zone for some<br />
preferred quality aspects - particularly its large, white seed - despite exhibiting low yield<br />
potential and a range of disease susceptibilities.<br />
Only 8.5% of the wheat growers in Arsi used local unimproved wheat varieties (i.e., "Local"<br />
and "Israel") in 1998 (Table 3). Kubsa (HARI685) was the most widely-adopted wheat<br />
variety in the region: 39% of wheat producers grew Kubsa in 1998. Farmers also reported<br />
high adoption rates for other improved wheat varieties, i.e., Pavon-76 (25%), Wabe (15%),<br />
and ET-13 (11%). In terms of the total wheat area sown to each variety, Kubsa (34.5%) and<br />
Pavon-76 (26%) accounted for 60.5% of the total wheat area sown in 1998; four other<br />
varieties, viz. Wabe, Dashen, Batu and ET-13, covered 1l.5%, 7.6%, 7.3% and 5.6% of the<br />
wheat area, respectively (calculated from Tables 3 and 4). Thus, the six most frequently<br />
grown wheat varieties occupied 92.5% of the total wheat area sown in Arsi during 1998. Of<br />
414
A study ofthe adoption ofbread wheat production technologies in Arsi Zone - Setotaw et al.<br />
these six dominant varieties, five are semi-dwarfs (i.e., only ET-13 is a tall improved<br />
variety); thus during 1998 in Arsi Zone, semi-dwarf bread wheat varieties (i.e., Kubsa,<br />
Pavon, Wabe, Dashen, Batu and Galama) occupied 88.5% of the total wheat area. Only 5.1 %<br />
of the total wheat area in 1998 was sown to local varieties. Variation was observed in the<br />
distribution of varieties across the woredas, reflecting both adaptation to specific locations<br />
and area-specific farmer preferences (Table 3); however, Kubsa was dominant in three of the<br />
five woredas. <strong>The</strong> survey results also revealed that adopters of each variety grew a mean area<br />
of 4 timad of Kubsa, 4.8 timad of Pavon, 3.5 timad of Batu, and 3.3 timad of Dashen (Table<br />
4).<br />
<strong>The</strong> predominance of semi-dwarf varieties of bread wheat in Arsi Zone is directly attributable<br />
to the heavy investment in wheat breeding by the CADUIARDU project and the national<br />
wheat research program of Ethiopia. <strong>The</strong> grain yield potential of bread wheat cultivars<br />
released in Arsi Zone over the period from 1949 to 1987 has increased at the rate of 2.2% or<br />
77 kglha per annum (Amsal et al., 1995). Furthermore, the recently-released semi-dwarf<br />
varieties Kubsa and Galama significantly outyielded the taller check varieties Enkoy and ET<br />
13 in a series of on-farm trails conducted throughout Ethiopia during the mid 1990s (Asmare<br />
et al. 1997).<br />
Pavon (19.2 qtlha) was reported as the highest yielding wheat variety in Arsi (Table 4)<br />
followed by Dashen (17.0 qtlha), Batu (16.8 qtlha), and Kubsa (16.8 qt/ha). <strong>The</strong> other widely<br />
adopted variety in the region, Wabe, exhibited a yield of 15.4 qtlha. ET-13 and Israel yielded<br />
the lowest (i.e., below 10 qtlha). Variations in yield were observed across the different<br />
woredas. <strong>The</strong> highest yields were reported in the Etheya and Lole woredas which are known<br />
to possess favorable conditions for wheat production. Robe (water-logged), Asasa (droughtstressed)<br />
and Bekoji (low P status of soils) exhibited relatively low mean wheat yields.<br />
Of the thirteen wheat varieties reported in Arsi during 1998 (Table 3), 77% and 62% · were<br />
reported in Bekoji and Asasa woredas, respectively. Farmers in Etheya and Robe woredas<br />
reported production of only 46% of the total number of wheat varieties. <strong>The</strong> number of<br />
varieties reported in Lole was only four (i.e., 31 %). About 72.8% of the wheat growers in<br />
Arsi planted only one variety, while 24.4% produced two wheat varieties, and 2.8% grew<br />
three varieties during 1998 (Table 5).<br />
Concerning the 13 varieties grown during 1998 by surveyed farmers, it was of interest to note<br />
that two "obsolete" varieties, viz., Dashen and Batu, comprised 14.8% of the total wheat area<br />
in Arsi. Dashen, a varietal release in 1984, achieved outstanding grain yields throughout<br />
Ethiopia, and was significantly higher yielding than any of the wheat cultivars released<br />
previously by the national wheat research program (Bekele and Tanner, 1995). However,<br />
during the 1988 cropping season, significant yield losses due to an epidemic caused by a new<br />
race of stripe rust were recorded on state and peasant farms producing Dashen; Dashen and<br />
varieties such as Batu, possessing a common stripe rust resistance gene, were immediately<br />
dropped from seed multiplication and dissemination programs (Bekele and Tanner, 1995),<br />
but they apparently retained popularity among peasant farmers as evidenced by the current<br />
survey. One contributing factor could be that stripe rust is much less severe on susceptible<br />
cultivars produced under low levels of fertilizer application (Tanner et al., 1993) as<br />
commonly occurs on peasant farms.<br />
In contrast to the case of Dashen and Batu, the level of production of the variety Enkoy<br />
415
A study ofthe adoption ofbread wheat production technologies in Arsi Zone - Setotaw el al.<br />
during 1998 demonstrated the almost total demise of a previously popular bread wheat<br />
variety: Enkoy occupied only 0.5% of the surveyed wheat area in Arsi during 1998. Enkoy<br />
had been extremely popular with wheat farmers throughout Ethiopia as a result of its<br />
properties of competitiveness with weeds, high levels of resistance to the major diseases of<br />
wheat in Ethiopia, and wide adaptability across the many agro-ecological zones of the<br />
country (Bekele and Tanner, 1995). Particularly after the demise of Dashen in 1988, the<br />
production of Enkoy expanded to cover an estimated 70% of the national bread wheat area;<br />
however, by 1993, stem rust levels up to 100S were reported in farmers' fields throughout<br />
major wheat producing zones in south-eastern Ethiopia, and some fanners reported total crop<br />
failure as a result (Bekele and Tanner, 1995). Thus, by the 1998 cropping season, fanners in<br />
Arsi had essentially replaced Enkoy with newer varieties such as Kubsa and Wabe or with<br />
seed of older varieties such as Pavon-76 and ET -l3 which continue to exhibit satisfactory<br />
yields and adequate levels of disease resistance.<br />
Fertilizer<br />
In Ethiopia, given the stated national objective of attaining food self-sufficiency, there have<br />
been considerable efforts expended in recent years to promote the adoption of chemical<br />
fertilizers in small-holder agriculture. In particular, Arsi Zone has benefited from agricultural<br />
technology development and dissemination activities since the inception of the first<br />
comprehensive package projects during the late 1960s.<br />
<strong>The</strong> survey results revealed that 92.3% of the wheat growers in Arsi Zone applied DAP on<br />
wheat during 1998 (Table 6). A DAP adopter in Arsi applied an average of 90.3 kg of DAP<br />
per ha on wheat while the weighted mean (i.e., including non-adopters of DAP) was 83.3 kg<br />
of DAP per ha of wheat in Arsi. In terms of mean DAP application rates on wheat for<br />
adopters, the five woredas are ranked in order as follows: Etheya (107.7 kg per ha), Lole<br />
(98.7), Bekoji (93.1), Asasa (79.2), and Robe (70.0).<br />
<strong>The</strong> survey results also revealed that only 26% of the wheat growers in Arsi applied urea to<br />
wheat in 1998 (Table 6). <strong>The</strong> highest adoption rate for urea application was observed in<br />
Etheya (61.4%), followed by Robe (23%) and Asasa (22.4%) woredas. Although the mean<br />
rate of urea application by urea adopters was 67.2 kg/ha on wheat, the weighted mean rate of<br />
urea application on wheat in Arsi was only 17.5 kglha.<br />
<strong>The</strong> survey results also revealed that only about 15% of the fanners adopted the current MoA<br />
blanket fertilizer recommendation for wheat (i.e., 100 kg DAP and 100 kg urea per ha).<br />
7<br />
<strong>The</strong> method of fertilizer application varied between DAP and urea (Table 7). Virtually all<br />
fanners in the region applied DAP correctly as a basal application at the time of sowing.<br />
About 68% of the farmers applying urea applied all at planting while 32% practiced top<br />
dressing of urea. Experimental results in central Ethiopia revealed that split application of the<br />
urea N source, with 1/3 applied at planting and 2/3 top dressed at the mid tillering stage of<br />
the crop, was agronomically beneficial under water-logged soil conditions (Ti1ahun et al.,<br />
1996). Split application of N enhanced grain yield, grain N content and uptake, and apparent<br />
N recovery and agronomic efficiency. It is worth noting that, in the current study, the highest<br />
incidence of top-dressing of urE-a was reported in the Robe and Bekoji woredas; these two<br />
woredas exhibit the highest rainfall amounts and incidence of water-logging among the five<br />
surveyed woredas.<br />
416
A study ofthe adoption ofbread wheat production technologies in Arsi Zone - Setotaw et al.<br />
Weed control<br />
Hand weeding is the most widely practiced weed control method in Arsi: 84% of the wheat<br />
growers in the region practiced hand weeding of wheat (Table 8). Of these farmers, only<br />
29.6% weeded their wheat fields twice or more. Variation was observed in the frequency of<br />
hand weeding across the five woredas. More farmers in Etheya (53.6%) and Asasa (46.0%)<br />
implemented two hand weedings as compared to the dominant practice of a single hand<br />
weeding in the other areas. This might reflect a relatively high severity of weed infestation in<br />
these areas: a significant yield loss could occur if farmers neglected the second hand<br />
weeding.<br />
About 63% of the wheat growers reported adoption of the herbicide 2,4-D for weed control<br />
(Table 9). Adopters applied a mean rate of 0.74 I of herbicide per ha of wheat; the weighted<br />
mean rate of herbicide application across all wheat growers was 0.46 I of product per ha of<br />
wheat. <strong>The</strong> highest rate of herbicide usage, 94.8%, was reported in Lole followed by Etheya<br />
(77.2%) and Asasa (67.2%). In Arsi, about 50.8% of the herbicide adopters applied 2,4-D<br />
herbicide on their wheat fields at suboptimal rates between 0.13 and 0.5 Ilha of product,<br />
while the remaining adopters applied 2,4-D at a rate> 0.5 I1ha.<br />
Fertilizer adoption<br />
Factors Influencing Technology Adoption<br />
<strong>The</strong> results of the logistic regression model (Table 10) revealed that the probability of a<br />
farmer adopting fertilizer is affected positively and significantly (P
A study ofthe adoption ofbread wheat production technologies in Arsi Zone - Setotaw et at.<br />
varieties by two-fold. Extension contact, although not significant, influenced the adoption of<br />
improved varieties positively. <strong>The</strong> other variables, which were expected to influence the<br />
probability of adoption of improved varieties, were not significant at the 10% probability<br />
level.<br />
Herbicide adoption<br />
<strong>The</strong> logistic regression analysis showed that fanners planting larger areas of wheat are<br />
significantly (P
A study ofthe adoption ofbread wheat production technologies in Arsi Zone - Setotaw et al.<br />
REFERENCES<br />
Amsal Tarekegne, D.G. Tanner and Getinet Gebeyehu. 1995. Improvement in yield of bread wheat cultivars<br />
released in Ethiopia from 1949-1987. African Crop Science J. 3: 41-49.<br />
Aregay Waktola. 1980. Assessment of diffusion and adoption of agricultural technologies in Chilalo. Ethiopian<br />
Journal ofAgricultural Science 2(1): 51-68.<br />
Asmare Yallew, D.G. Tanner, Mohammed Hassena and Asefa Taa. 1997. On-farm verification of five advanced<br />
bread wheat lines under recommended and farmers' crop management practices in the Ethiopian<br />
highlands. pp. 159-171. In: Sebil Vol. 7. Proceedings ofthe Seventh Annual Conference ofthe Crop<br />
Science Society ofEthiopia. CSSE, Addis Ababa.<br />
Bekele Geleta and D.G. Tanner. 1995. Status of cereal production and pathology research in Ethiopia. pp. 42<br />
50. In: Danial, D.L. (ed.). Breedingfor Disease Resistance with Emphasis on Durability. Wageningen<br />
Agricultural University, Wageningen, <strong>The</strong> Netherlands.<br />
CSA (Central Statistical Authority). 1995a: Agricultural Sample Survey, 1994195 (1987 EC). Report on<br />
Agricultural Practices (Private Peasant Holdings). Main Season. Vol. 111. Statistical Bulletin 132.<br />
CSA, Addis Ababa.<br />
CSA (Central Statistical Authority). 1995b. Statistical Abstracts. 1995. CSA, Addis Ababa.<br />
Mulugetta Mekuria. 1995. Technology development and transfer in Ethiopian agriculture: An empirical<br />
evidence. pp. 109-129. In: Mulate Dameke, Wolday Amha, S. Ehui and Tesfaye Zegeye (eds.). Food<br />
Security, Nutrition, and Poverty Alleviation in Ethiopia: Problems and Prospects. Proceedings ofthe<br />
Inaugural and First Annual Conference ofthe Agricultural Economics Society ofEthiopia. AESE,<br />
Addis Ababa.<br />
Tanner, D.G., Amanuel Gorfu and Asefa Taa. 1993. Fertiliser effects on sustainability in the wheat-based<br />
smallholder farming systems of south-eastern Ethiopia. Field Crops Research 33: 235-248.<br />
Tanner, D.G. and W. Mwangi. 1992. Current issues in wheat research and production in East, Central and<br />
Southern Africa: Constraints and achievements. pp. 17-36. In: Tanner, D.G. and W. Mwangi (eds.).<br />
Proceedings ofthe Seventh <strong>Regional</strong> <strong>Wheat</strong> <strong>Workshop</strong> for <strong>Eastern</strong>, Central, and Southern Africa.<br />
CIMMYT, Nakuru, Kenya.<br />
Tilahun Geleto, D.G. Tanner, Tekalign Mamo and Getinet Gebeyehu. 1996. Response of rainfed bread and<br />
durum wheat to source, level and timing of nitrogen fertilizer on two Ethiopian Vertisols: II. N uptake,<br />
recovery and efficiency. Fertilizer Research 44: 195-204.<br />
Questions and Answers:<br />
Orner H. Ibrahim: What is the farmer philosophy behind growing more than two cultivars?<br />
Answer: Farmers try to diversify their cultivars for different reasons: disease risk, varietal<br />
preference, marketing issues, etc.<br />
Orner H. Ibrahim: Can you elaborate on weed control in wheat with reference to sowing<br />
method, time of hand weeding, practicality and effectiveness of hand weeding in wheat?<br />
Answer: Farmers often use a high seed rate to overcome weed competition. Hand weeding is<br />
the most effective method of weed control, provided that there is adequate family labor.<br />
However, hand weeding will be difficult during peak seasons due to overlapping activities.<br />
Orner H. Ibrahim: <strong>The</strong> adoption rate ofDAP was very high, but that of urea was very low.<br />
What are the possible reasons for that?<br />
Answer: Farmers perceived that DAP increased grain yield while urea increased vegetative<br />
growth.<br />
419
A study ofthe adoption ofbread wheat production technologies in Arsi Zone - Setotaw et at.<br />
Table 1.<br />
Basic characteristics of the surveyed households (mean values).<br />
Characteristic<br />
Family size<br />
Age/Household heads<br />
Male-headed Households (%)<br />
Female-headed Households (%)<br />
Educational level<br />
• Illiterate (%)<br />
• Read and write (%)<br />
• Primary school (0/0)<br />
• Secondaryschool(%)<br />
Source: Survey data, 1999<br />
-Woreda<br />
'- Asasa Bekoji ' EtheYa . Lole '. Robe<br />
7.1 7.4 5.9 7.3 7.0<br />
44.6 47.3 49.9 47.3 45.6<br />
73.3 81.7 80.0 91.7 88.3<br />
26.7 18.3 20.0 8.3 11.7<br />
57.9 53.4 55.9 50.8 51.7<br />
10.5 27.6 23.7 20.3 25.0<br />
21.1 15.5 15.3 16.9 16.7<br />
10.5 3.4 5.1 11.9 6.7<br />
.Overall <br />
mean <br />
6.9 <br />
46.9 <br />
83.0 <br />
17.0 <br />
53.9<br />
21.5<br />
17.1<br />
7.5<br />
Table 2. Land holdings and livestock ownership, Arsi Zone, 1998.<br />
Land holdings (timadt)<br />
Owned<br />
Fallow<br />
Grazing<br />
Shared-out<br />
Rented-out<br />
Rented-in/crop production<br />
Ren ted -in! grazing<br />
Shared-in<br />
Livestock (weighted mean)<br />
Total1ivestock units (TLU)<br />
Oxen (number)<br />
Woreda '<br />
Asasa Bekoji . .Etheya Lole Robe<br />
11.76 (60) 14.27 (601 7.48 (60) 10.10(60) 9.97 (60)<br />
2.96 (34) 2.86 (32) 0.63 (2) 2.37 (38) 1.0 (2)<br />
3.83 (30) 5.26 (40) l.l5 (37) 2.18 (17) 2.77 (50)<br />
3.67 (3) 3.0 (9) 3.0 (2) 3.5 (6) 2.0 (9)<br />
4.89 (9) 2.33 (3) 1.94 (13) 2.78 (9) 1.88 (4)<br />
3.95(16) 4.12 (17) 5.22 (15) 9.2(10) 2.13 (8)<br />
3.67 (18) 4.38 (20) 1.53 (8) 3.0 (8) 2.22 (9)<br />
2.64 (11) 2.57 (7) 1.71J6) 3.0 (2) 1.95 (11)<br />
9.75 8.94 4.90 8.78 7.14<br />
2.05 2.15 2.06 2.28 2.08<br />
t 1 timad z 0.25 ha<br />
Note: Figures in parentheses indicate the numbers of respondents<br />
Source: Survey data, 1999<br />
Overall<br />
.mean<br />
10.70 (300)<br />
2.64 (108)<br />
3.13(174)<br />
2.86 (29)<br />
2.86 (38)<br />
4.86 (66)<br />
3.33 (63)<br />
2.29 (37)<br />
7.90<br />
2.13<br />
420
A study ofthe adoption ofbread wheat production technologies in Arsi Zone - Setotaw et al.<br />
Table 3. <strong>Wheat</strong> variety adoption (% of growers), Arsi Zone, 1998.<br />
.•. ,.~.... "'!<br />
< "'\j):"'..:...." .<br />
..... fl~.. '- "",/ :",-,-" -- .,.,.'"c . .<br />
<strong>Wheat</strong> growers (%) 97 93 95 97 95 95<br />
···· ·~ ~ ·~-;~.a.,riety .. ''''B~~tUi i ,E -eYat,' .": Loh~ " ' · ,~~6e · , ·.:.M~~n·<br />
Kubsa (HAR1685) 44.1 13.7 71.9 42.4 21.1 39.2<br />
Pavon-76 28.8 -- 22.8 61.0 8.8 25.1<br />
Batu 3.4 -- 35.1 5.1 3.5 9.5<br />
Enkoy -- 3.9 -- -- 1.8 1.1<br />
Dashen 15.3 37.3 3.5 -- -- 10.6<br />
Local -- 2.0 -- -- 38.6 8.1<br />
Wabe (HAR710) 33.9 9.8 8.8 22.0 -- 15.2<br />
K6290-Bulk -- 18.0 -- -- 21.1 4.2<br />
Galama (HAR604) 1.7 17.6 1.8 -- -- 3.9<br />
Mitike (HAR1709) 1.7 -- 1.8 -- 3.5 1.4<br />
ET-13 1.7 35.3 -- -- 22.8 11.3<br />
K6295-4A -- 2.0 -- -- -- 0.4<br />
Israel -- 2.0 -- -- -- 0.4<br />
Source: Survey data, 1999<br />
421
A study ofthe adoption ofbread wheat production technologies in Arsi Zone - Setotaw et al.<br />
Table 4. Mean area and yield of adopted wheat varieties (per respondents producing each variety), Arsi Zone, 1998.<br />
Asasa Bekoji Etheya Lole Robe ' . Mea~<br />
Areat' Yieldt Area ' . Yield Area . Yield " ..<br />
.Yield . Yield Area Yield<br />
Variety : Area ..... .·.·· Area
A study ofthe adoption of bread wheat production technologies in Arsi Zone - Setotaw et al.<br />
Table 5. Number of wheat varieties produced, Arsi Zone, 1998.<br />
.<br />
.,<br />
Number of P~r ce,tit Q'f r~"sp-ondeIJJs '<br />
" ~<br />
varieties Asa$a .~: , ' Bekoji ' Lol~· · . :· · ~obe Me~n<br />
$<br />
Etheya 1 72.9 80.4 59.6 71.2 80.7 72.8<br />
2 23.7 17.6 35.1 27.1 17.5 24.4<br />
3 3.4 2.0 5.3 1.7 1.8 2.8 <br />
Average 1.3 1.2 1.5 _ - "-----. '--<br />
1.3 1.2 1.3 <br />
Source: Survey data, 1999<br />
Table 6. Fertilizer rates adopted for wheat production, 1998.<br />
,. 'k ... ,.,. E Ii: "', .j- ' .!":'',e. , •<br />
~<br />
;.~ . ," Asasa ~' _~ , B.ekoJr~ ,': '. ~{ . '" t~ya (,.\ I ~ };ol ~; . , :fr~·
A study ofthe adoption ofbread wheat production technologies in Arsi Zone - Setotaw et al.<br />
Table 7. Method of DAP and urea application, Arsi Zone, 1998.<br />
Per cent o( respondents . ,<br />
Atphlntin:j,- T
¥<br />
A study ofthe adoption ofbread wheat production technologies in Arsi Zone - Setotaw et al.<br />
Table 10.<br />
" - "~ : . "<br />
." YarfabI,tt~. .' .<br />
Age<br />
Credit access<br />
Education<br />
Extension contact<br />
Timeliness (fertilizer delivery)<br />
Radio ownership<br />
Gender of household head<br />
Livestock (TLU)<br />
Family size<br />
Land size (owned)<br />
<strong>Wheat</strong> area * Variety<br />
Constant<br />
Estimated coefficients of logistic regression for fertilizer adoption, Arsi<br />
Zone, 1998.<br />
,<br />
,' . I;;"/ ··B '··":·j ··",, .:, ~. )1. ·!~\Si~:~,:.~~,;' . ~ : '. ~'-. ·~:1; ~$'I2'~.(':-" . .:.... '>' E~~l ; , ""<br />
. , ,\ ~",,".... ' " · v . ~' .<br />
:.-".'... >, ,: .:" ';'" ,--,'<br />
.0048 .0377 .8988 1.0048<br />
1.8528* .8418 .0277 6.3778<br />
1.4092 1.2901 .2747 4.0926<br />
1.9257 1.1909 .1059 6.8598<br />
1.2782 1.1414 .2628 3.5900<br />
1.2618 1.4402 .3810 3.5317<br />
-10.9563 29.7639 .7128 .0000<br />
-.0455 .0786 .5632 .9555<br />
.0195 .1623 .9043 1.0197<br />
-.1502 .1035 .1469 .8606<br />
.1859 .1511 .2185 1.2043<br />
11.5086 29.9106 .7004<br />
* indicates significance at the 5% probability level. <br />
Model X 2 = 24.31 (sig. at 5% level); overall cases correctly predicted: 97.13%. <br />
Table 11.<br />
Estimated coefficients of logistic regression for adoption of improved<br />
varieties a , Arsi Zone, 1998.<br />
'.'<br />
:r;...; ~ '"<br />
' ¥~riaJjle~ .:.<br />
w -:-'.J ·,..>.:.,Ji ·.... -... ' "'~ .. S:•.l1:.•,,'· .:""i,<br />
Age<br />
Education<br />
Extension contact<br />
Radio ownership<br />
Family size<br />
Land size (owned)<br />
Herbicide use<br />
Fertilizer use<br />
Oxen number<br />
Gender of household head<br />
Constant<br />
.0107 .0106<br />
.6329~ .3756<br />
.2151 .6300<br />
-.3724 .3481<br />
-.0049 .0556<br />
-.0032 .0291<br />
.8065** .3021<br />
.8029 .6141<br />
.1937 .1263<br />
-.1008 .3858<br />
-2.1616* .9425<br />
····".:;·::)Sjg.:·: ":. '.. ,:E,xp(B) :"<br />
.3115 l.0108<br />
.0920 1.8830<br />
.7328 1.2400<br />
.2847 .6891<br />
.9302 .9951<br />
.9121 .9968<br />
.0076 2.2401<br />
.1910 2.2320<br />
.1250 1.2137<br />
.7939 .9041<br />
.0218<br />
**, * and t indicate significance at the 1,5 and 10% probability levels, respectively.<br />
Model X2 = 23.24 (sig. at 1% level); overall cases correctly predicted: 63.30%.<br />
aYarieties released since 1990.<br />
425
A study ofthe adoption ofbread wheat production technologies in Arsi Zone - Setotaw et al.<br />
Table 12.<br />
Estimated coefficients of logistic regression for herbicide adoption, Arsi<br />
Zone, 1998.<br />
Variable '.<br />
B<br />
","<br />
;S.]!:; " Si2. Exp(B)<br />
Age -.0062 .0120 .6042 .9938<br />
Education .8860* .4252 .0372 2.4254<br />
Radio ownership .2363 .4075 .5621 1.2665<br />
Family size .0300 .0655 .6464 1.0305<br />
Land size (owned) -.0558 .0372 .1342 .9458<br />
Gender of household head -.3026 .4073 .4575 .7389<br />
Credit access .7874* .3729 .0348 2.1976<br />
Livestock (TLU) .0358 .0346 .3005 1.0365<br />
<strong>Wheat</strong> variety (improved) 1.4269* .5791 .0137 4.1659<br />
Area wheat .3069** .0692 .0000 1.3592<br />
Constant -2.2446* .9443 .0175<br />
** and * indicate significance at the 1 and 5% probability levels, respectively.<br />
Model X 2 = 56.13 (sig. at 1 % level); overall cases correctly predicted: 73.31 %.<br />
426
FARMER PARTICIPATORY EVALUATION OF BREAD WHEAT VARIETIES <br />
AND ITS IMPACT ON ADOPTION OF TECHNOLOGY <br />
IN WEST SHEWA ZONE OF ETHIOPIA <br />
Kassa Getu i, Kassahun Zewdie', Amsal Tarekegne i and Girma Taye 2<br />
'Holetta Agricultural Research Center, P.O. Box 2003, Addis Ababa, Ethiopia<br />
2Ethiopian Agricultural Research Organization, P.O. Box 2003, Addis Ababa, Ethiopia<br />
ABSTRACT<br />
Eight spring bread wheat varieties were evaluated at Guder in 1997 and 1998<br />
to assess their adaptation to the area and to document farmers' preferences.<br />
During evaluation of the varieties by farmers and researchers, two<br />
quantitative, viz., grain and biomass yield, and five qualitative, viz., grain size,<br />
taste of bread, threshing ability, seed color and baking quality, parameters<br />
were considered. Combined analyses of variance revealed that Galama yielded<br />
significantly higher than the local check "Dashen". Although statistically nonsignificant,<br />
Kubsa and Mitike outyielded Dashen by 4.2 and 0.4%,<br />
respectively. In terms of biomass yield, none of the improved varieties<br />
differed significantly from the local check. Results of the weighted direct<br />
matrix ranking indicated that Galama is the variety most favored by farmers<br />
followed by Kubsa. Demonstration of Galama was started during 1998 on 47<br />
farmers' fields. A follow up study found that over 200 farmers were growing<br />
Galama during 1999. Farmer-based seed production and distribution played a<br />
major role in disseminating this variety. This paper, therefore, emphasizes the<br />
need to enhance farmer participation to facilitate technology adoption by<br />
stakeholders.<br />
INTRODUCTION<br />
<strong>Wheat</strong> is one of the major cereal crops in the Ethiopian highlands (Abebe, 1986; Hailu, 1991;<br />
Abera, 1991; NSIA, 1998) which range between 6 and 16°N, 35 and 42° E, and from 1500 to<br />
2800 m a.s.l in altitude (IAR, undated). Peasants who provide about 93% of the national grain<br />
production produce wheat and other grains mainly for subsistence. Only 18.5% of all grain<br />
and 19.4% of wheat production is enters the market (Adanech, 1991).<br />
<strong>Wheat</strong> dominates the food habits and dietary practices of the highlands population of<br />
Ethiopia. It can be roasted to serve as a snack or in between meals, boiled to serve as nifro<br />
(boiled grain), fermented to serve as injera (pancake like traditional bread) and dabo (local<br />
bread), prepared as a porridge and kitta (unfermented bread) and blended with other cereals<br />
form composite flours or incorporated into weaning food for children (Abera, 1991).<br />
Moreover, wheat straw is one of the most important cereal straws produced in the mid<br />
altitude and highland areas of Ethiopia and is used for different purposes. <strong>The</strong> main use is as<br />
livestock feed particularly during the dry season but other uses include thatching, bedding<br />
material, maintenance of soil fertility (being plowed back into soil), and industrial uses (e.g. ,<br />
427
Farmer participatory evaluation o/bread wheat varieties - Kassa et af.<br />
paper products, hardboard, egg trays, and for packaging in the glass industry) (Said and<br />
Adugna, 1991).<br />
<strong>Wheat</strong> being one of the major crops grown in the study area, it is characterized by low<br />
production and productivity per unit area. Results of base line survey conducted in 1992/93<br />
(unpublished data) by Birbirsa and Cherecha Development Program of Ethiopia Rural Self<br />
Help Association (BCDP of ERSHA) revealed that one of the limiting factors contributed to<br />
low yield of wheat may be using the same variety year after year. Even though farmers in the<br />
area were provided with improved variety of wheat, ET -13, through the government<br />
extension package program, they were complaining about this variety, for it demands high<br />
labor especially during threshing and is poor in grain size. Alternate varieties were not<br />
introduced thereafter.<br />
<strong>The</strong> subjectively assessed characters of appearance playa part in evaluating general quality<br />
of the grain (Kettlewell, 1989). Farmers evaluate varieties of wheat from different angles.<br />
However, the national wheat improvement program has been releasing a number of high<br />
yielding wheat varieties with wide geographical adaptation (Bekele et al., 1994) without<br />
considering some qualitative aspects, which are of farmers' interest. Researchers, compared<br />
with the attainment of high yield, have neglected the achievement of bread making quality by<br />
farmers, for example.<br />
<strong>The</strong>refore, the objective of this work was to evaluate the adaptability and acceptability of<br />
bread wheat varieties (released for wide adaptation) from farmers' perspective in West Shewa<br />
zone of Ethiopia.<br />
MATERIALS AND METHODS<br />
Eight bread wheat varieties (Table 2) currently under production in the country were sown on<br />
six farmers' fields at Gudar woreda, West Shewa zone of Ethiopia in collaboration with<br />
Holetta Agricultural Research Center (HARC) and a local NGO (ERSHA), for two cropping<br />
season (1997 and 1998). Since there was a complete devastation of the varieties by Chaffer<br />
grub, 'Guguba' in local Oromipha language, and cattle on two and one of the farms,<br />
respectively, we used the remaining three farms for'the analyses. Each farmland was<br />
considered as a replication. Seed and fertilizer rate of 175 and 60:69 kg N:P 2 0 S Iha<br />
respectively, and plot size of 5 x 5 m were used.<br />
In a field day organized by the NGO in 1997, farmers and researchers were involved. In that<br />
day, farmers evaluated the varieties qualitatively, i.e., by their seed color and size<br />
(plumpness), threshing ability, taste of bread and baking quality. Quantitative data taken at<br />
harvest, which include grain and biomass yields were also considered. Homemade breads<br />
were prepared from each of the varieties by a single female following uniform procedure.<br />
First the grains were ground using traditional grinding stone. <strong>The</strong>n the dough was prepared<br />
using traditional fermenting agent (Ersho in Amharic) as yeast in that portion of the flour was<br />
mixed with Ersho and kept overnight. In the morning when the dough fermented/raised, the<br />
remaining flour was added and left until re-fermentation takes place. <strong>The</strong>n it was baked in an<br />
open fire using again traditional stove, "Geber-mitad" in Amharic. <strong>The</strong> farmers were asked to<br />
rank their criteria according to their importance in consensus, and to numerically rate the<br />
varieties from 1-10 (where 10 refers to the best and 1 refers to the poor) across each<br />
qualitative criterion. Although all the varieties are white, the farmers gave different scores or<br />
rank. <strong>For</strong> the quantitative parameter, ranks (the lowest number the best) were given to the<br />
428
Farmer participatory evaluation ofbread wheat varieties - Kassa et al.<br />
varieties based on the mean yield value. In order to combine all parameters, numerical ratings<br />
were converted into rank.<br />
RCBD method of statistical analysis was employed to analyze quantitative data, and a<br />
modified Participatory Rural Appraisal (PRA) technique for prioritization (Anonymous,<br />
undated), i.e., weighted direct matrix ranking, was used to differentiate farmers' favorite<br />
variety considering both qualitative and quantitative criteria. Simple correlation analysis was<br />
also used to see interdependence between the variables based on the farmers' preference rank.<br />
RESUL TS AND DISCUSSION<br />
Combined analysis of variance revealed that Galama gave significantly higher grain yield<br />
(2.9 tJha) among the eight varieties. <strong>The</strong> rest of the varieties had statistically equivalent grain<br />
yield except the difference found between Kubsa and Tusie. Although statistically nonsignificant,<br />
Kubsa and Mitike outyielded the local check (Dashen) by 4.2 and 0.37%<br />
respectively. As far as biomass yield is concerned, Galama stood first though the mean yield<br />
difference with four of the entries including the local check was not significant. Biomass<br />
yield of Wabe and Tusie significantly differed from that of Galama, Kubsa and Mitike, and<br />
Abolla had the same as Galama (Table 2). Unlike the case of grain and biomass yield, harvest<br />
index of the varieties were not significantly different (Table 6). Mean values of harvest index<br />
indicated that Galama still outsmarted all varieties (Table 2).<br />
<strong>The</strong> mean values of weighted direct matrix ranking for all qualitative and quantitative<br />
parameters considered showed that all the new varieties except Tusie outweighed the local<br />
check (Dashen). Farmers' preference order to the varieties in the final assessment indicated<br />
that Galama was the favorite variety followed by Kubsa, Mitike, ET-13, Wabe, Abolla,<br />
Dashen and Tusie (Table 3).<br />
<strong>The</strong> farmers were highly impressed by the vegetative growth of Kubsa and Wabe at their<br />
early growth stage, as the two varieties were vigorous in growth and early to medium<br />
maturity types. However, later on Galama carne out with the best agronomic performance,<br />
which the farmers believed to substitute Dashen, their favorite 'local' cultivar. It was<br />
characterized by the farmers as having high tillering capacity, superior growth, big panicle,<br />
easy threshing ability, superior yield, large grain size and plumpness, better dough and bread<br />
qualities.<br />
As grain yield has been the prime selection criteria for the resource-poor subsistence farmers<br />
in the study area in particular and in the peasantry in general, it might have biased the farmers<br />
during evaluation of varieties. Thus, qualitative data were analyzed independently to assess<br />
the position of the varieties against other farmers' criteria so that breeders could get feedback<br />
as to a trait for future improvement. As a result, change in priority order was observed for all<br />
varieties except Galama. <strong>The</strong> preference sequence from best to poor cultivar was Galama,<br />
Wabe, AbollaiTusie, Kubsa, Dashen, ET -13 and Mitike. Variety Wabe took the second<br />
position because of its good seed color and threshing ability. Similarly, Tusie and Abolla<br />
were in relatively good rank for their good grain size and in addition good taste of bread for<br />
the latter. Kubsa was in the fifth preference rank mainly due to its bad dough and loaf quality.<br />
<strong>The</strong> local check was pushed one step up because of its fair threshing ability and grain size.<br />
Although Mitikie was the third important variety in the overall evaluation (Table 3) due to its<br />
baking quality/taste of bread and yield, it took the last order in this case, for it had small grain<br />
size and difficulty during threshing like ET-13 (Table 4). Similar complaints were found for<br />
429
Farmer participatory evaluation ofbread wheat varieties - Kassa et al.<br />
ET -13 in an infOlmal survey conducted by research-extension department of HARC around<br />
Wolmera woreda.<br />
Although Galama did not express its real yield potential on farmers ' fields probably due to<br />
poor management practice and pest problem, it is a high yielding variety. High yield cannot<br />
be recombined with high protein content (Loffler et at., 1985; Akmal Khan et at., 1986; Blum<br />
et at., 1987; Kettlewell, 1989) which determine baking quality. Unpublished preliminary<br />
study on Ethiopian bread wheat varieties has also revealed that Galama had high mixogram<br />
development time, low flour protein and low loaf volume, which are all indicators of poor<br />
baking quality. However, these results were contradictory with the findings in homemade<br />
bread quality assessment in the study area. <strong>The</strong> baking procedure might influence the quality<br />
of the bread. This calls researchers to do more investigation in the future.<br />
Results of simple correlation analysis indicated that there was strong positive correlation<br />
between grain yield and biomass yield (r =0.952), baking quality and taste of bread (r =<br />
0.810) and threshing ability and seed color (r = 0.748) (Table 5).<br />
All in all, fanners' evaluation and yield analysis indicated that variety Galama was superior<br />
over the others in this test followed by Kubsa. Based on the year 1977 assessment, many<br />
farmers were very interested and requested BCDP to provide them with seed of Galama. Few<br />
farmers were also interested on Kubsa and Wabe. Even though it is hard to depend on the<br />
results of one year, it was difficult to resist the strong demands of the farmers. Hence, BCDP<br />
was convinced and agreed to provide them with the requested seeds, and to further test<br />
performance on larger plots under crop variety popularization scheme. Accordingly, Galama,<br />
Kubsa and Wabe varieties were demonstrated on 47, 3 and 2 farmers' plots of 0.25 ha<br />
respectively in 1998. Kubsa was favored by the farmers in lower 'Dega' agro climatic zone<br />
(mid highland = 2000 - 2300 m a.s.l.), and Galama adapted very well and was very much<br />
liked in the upper "Dega" (highland areas> 2300 m). Follow up activity as to the fate of<br />
variety Galama was made in 1998. Accordingly, it was found that over 200 farmers were<br />
involved in 1999. Farmer based seed production and circulation system played a great role in<br />
disseminating this variety. It has been replacing all other varieties in the region.<br />
Generally, it was felt that this on-farm trial was found useful and helpful, and experiences<br />
were gained in selecting farmers for participation, planning, implementing and analyzing the<br />
results. We feel that it is important to pinpoint the fear concerning variety diversification. As<br />
you may know, among other socio-economic factors, the dynamicity mainly in pathogen<br />
conditions in Ethiopia urges researchers to put their effort for a relatively faster replacement<br />
of varieties than most of the other wheat growing countries. Thus, it is impossible to rely on a<br />
given variety that might be suitable to an environment under the existing conditions, for<br />
tomorrow's fate is unforeseen. Thus, new varieties of wheat should be released in the study<br />
area in order to come up with alternate cultivars to Galama.<br />
ACKNOWLEDGMENTS<br />
<strong>The</strong> authors are very grateful to Ato Atinafu and Ato Mergia, BCDP of ERSHA, for their<br />
support in organizing the farmers and covering part of the expenses. Ato Chanyalew<br />
Mandefro, Wlrt Hirut Yirga and Ato Agajie Tesfaye (HARC) are also acknowledged for their<br />
help in data collection, typing and reviewing the paper respectively. Last but not least, Ato<br />
Eyob Mulat (HARC) deserves great thanks for providing us reference materials.<br />
430
Farmer participatory evaluation ofbread wheat varieties - Kassa et at. <br />
REFERENCES <br />
Abebe Demissie. 1986. A decade of germplasm exploration and collection activities by PGRC/E. in: Engels,<br />
J.M.M (ed.). 1986. <strong>The</strong> conservation and utilization of Ethiopian germplasm: Proceedings of an<br />
international symposium held in Addis Ababa, Ethiopia. pp. 28-41.<br />
Abera Bekele. 1991. Biochemical aspects of wheat in human nutrition. In: Hailu Gebre Mariam, D.G. Tanner<br />
and Mengistu Hulluka (eds.). 1991. <strong>Wheat</strong> Research in Ethiopia: A Historical Perspective. Addis<br />
Ababa, IARJCIMMYT. pp. 341-352.<br />
Adanech Adissu. 1991. <strong>Wheat</strong> marketing in Ethiopia. In: Hailu Gebre Mariam; D.G. Tanner and Mengistu<br />
Hulluka (eds.). 1991. <strong>Wheat</strong> Research in Ethiopia: A Historical Perspective. Addis Ababa,<br />
IARICIMMYT. pp. 323-339.<br />
Akmal Khan, M. Rana, LA. Ullah, 1. 1986. Nutritional evaluation of some commercial wheat varieties grown in<br />
Pakistan. In Rachis; Barley and <strong>Wheat</strong> Newsletter. Vol. 5 (2). P. 42.<br />
Anonymous. Undated. ICRA-EARO Training Manual.<br />
Bekele Geletu, Amanuel Gorfu and Getnet Gebeyehu. 1994. <strong>Wheat</strong> production research in Ethiopia. Constraints<br />
and sustainability. pp. 18-12. In: Tanner, D.G. (ed.). Developing sustainable wheat production systems:<br />
<strong>The</strong> Eighth <strong>Regional</strong> <strong>Wheat</strong> <strong>Workshop</strong> for <strong>Eastern</strong>, Central and Southern Africa. Addis Ababa,<br />
Ethiopia: CIMMYT.<br />
Blum, A., Sinmena, B., Golan, G., Mayer, J. 1987. <strong>The</strong> grain quality oflandrace of wheat as compared with<br />
modem cultivars. Plant Breeding: 99, 226-233 (1987).<br />
Hailu Gebre Mariam. 1991. <strong>Wheat</strong> breeding and genetics research in Ethiopia. in: Hailu Gebre Mariam, Tanner,<br />
D.G. and Mengistu Hulluka (eds.). 1991. <strong>Wheat</strong> Research in Ethiopia: A Historical Perspective. Addis<br />
Ababa, IARJCIMMYT. pp. 73-93.<br />
lAR. Undated. <strong>Wheat</strong> research and development strategic plan, 1990-2010.<br />
Kettlewell, P .S. 1989. Breadmaking quality in wheat. Agricultural Progress: 16, 30-45 (1989).<br />
Loffler, C.M., Rauch, T.L. and Busch, R.H. 1985. Grain and plant protein relationship in hard red spring wheat.<br />
Crop Science, Vol. 25, May-June (1985).<br />
National Seed Industry Agency. 1998. Crop variety registration: Issue number 1. Addis Ababa, Ethiopia. p. 12.<br />
Payne, T.S., Tanner, D.G. and Abdalla O.S. 1996. Current issues in wheat research and production in <strong>Eastern</strong>,<br />
Central and Southern Africa: Changes and Challenges. In: Tanner, D.G., Payne, T.S. and O.S. Abdalla<br />
(eds.). <strong>The</strong> Ninth <strong>Regional</strong> <strong>Wheat</strong> <strong>Workshop</strong> for <strong>Eastern</strong>, Central and Southern Africa. Addis Ababa,<br />
Ethiopia: CIMMYT.<br />
Said, A.N. and Adugna, T. 1991. Utilization ofwheat straw in Ethiopia. In: Hailu Gebre Mariam, Tanner, D.G.<br />
and Mengistu Hulluka (eds.). 1991. <strong>Wheat</strong> Research in Ethiopia: A Historical Perspective. Addis<br />
Ababa, IARICIMMYT. pp. 353- 78.<br />
Questions and Answers:<br />
Efrem Bechere: Do you think that fanners and urban consumers have the same taste criteria<br />
for bread?<br />
Answer: I don't think so, because baking procedures and additives prevail in the urban<br />
sector.<br />
431
Farmer participatory evaluation ofbread wheat varieties - Kassa et al.<br />
Table 1.<br />
List of bread wheat varieties used for evaluation with their pedigree, seed<br />
color, year of release and production status .<br />
. . pays to \ , .' .Seed Yearof . Production :<br />
•<br />
Variety 'Cross/pedigree . mat(ifity . coior . . release .. ' " statp~ '* .'<br />
Galama 4777* 211FLN/GB/3IPVN 135 White 1995 WG<br />
Kubsa ATTILA 131 " 1994 WG<br />
Dashen KVZIBUHO/ !KALiBB 136 " 1984 WG<br />
Mitike BOW28 XRBC 135 " 1993 WG<br />
Abolla SERI/BOW"S"/BUC"S" 130 " 1996 EXPA.<br />
Wabe MAIORALIBUCKBUCK 130 " 1994 WG<br />
Tusie COOKIVEE"S"//DOVE"S" 127 " 1996 EXPA.<br />
ET-13 ENKOYlUQ105 132 " 1981 WG<br />
WG = wIdely grown; EXPA = Expandmg<br />
* =adapted from: Payne et al. (1996).<br />
Table. 2<br />
Mean values of grain and biomass yield and harvest index of the eight<br />
Ethiopian bread wheat varieties at Gudar, 1997-98.<br />
Variety Grain yield (t/ha) BioQIassyield(tJha). Harvest- inde~<br />
Galama 2.893 a* 7.280 a* 0.397<br />
Kubsa 2.552 b 6.818 ab 0.372<br />
Dashen 2.449 be 6.503 abe 0.377<br />
Mitike 2.458 be 7.065 ab 0.351<br />
Abolla 2.192 be 6.312 be 0.344<br />
Wabe 2.242 be 5.888 e 0.384<br />
Tusie 2.117 c 5.835 c 0.363<br />
ET-13 2.362 be 6.458 abe 0.362<br />
Mean 2.408 6.520 0.369<br />
S.E. 0.1155 0.2649 0.0129<br />
LSD(0.05) 0.3345 0.7644 0.0374<br />
C.V.(%) 11.77 9.96 8.82<br />
Means followed by the same letter are not slgmficantly dIfferent at P = 0.05.<br />
432
Farmer participatory evaluation a/bread wheat varieties - Kassa et at.<br />
Table 3.<br />
Preference and weighted rank of the varieties for the different qualities<br />
ranked by the farmers.<br />
Galama 1 2 6 4 20 6 7 46 6.57 1 <br />
Kubsa 2 10 18 12 10 42 21 115 16.43 2 <br />
Dashen 4 8 24 8 15 48 28 135 19.29 7 <br />
Mitike 3 14 9 24 30 24 14 118 16.86 3 <br />
Abolla 7 6 12 16 35 12 42 130 18.57 6 <br />
Wabe 6 12 15 4 5 36 49 127 18.14 4 <br />
Tusie 8 4 21 20 25 30 56 164 23.43 8 <br />
ET-13 5 14 3 24 30 18 35 129 18.43 5 <br />
GY = grain yield; GS = grain size; TB = taste of bread; TH = threshing ability; SC = seed color;<br />
BQ = baking quality; BY = biological yield.<br />
Table 4.<br />
Preference and weighted scores of the varieties against each and all<br />
qualitative parameters as given by the farmers.<br />
~.ariHy 5GS 4TB' "'3·Tn, , 2 S{: rB~j. ,$um of ' Meitn, ~riO'rity ,<br />
,',. - '-,- "" ,<br />
"S~,9r,~$<br />
ortler <br />
Galama 50 36 30 14 10 140 28.00 1 <br />
Kubsa 25 20 24 18 3 90 18.00 4 <br />
Dashen 30 12 27 16 2 87 17.40 5 <br />
Mitike 15 32 9 10 7 73 14.60 7 <br />
Abolla 35 28 18 4 9 94 18.80 3 <br />
Wabe 20 24 30 20 5 99 19.80 2 <br />
Tusie 45 16 15 15 12 94 18.80 3 <br />
ET-13 15 40 9 10 8 82 16.40 6 <br />
Table 5.<br />
Results of simple correlation analysis on weighted rank of the seven<br />
selected criteria.<br />
. ,<br />
" ,<br />
(iy '(;S ~~\', \; '.:>;r13i Tn'"< '
Farmer participatory evaluation o/bread wheat varieties - Kassa et al.<br />
Table 6.<br />
Results of ANOV A for grain and biomass yield and harvest index.<br />
<br />
<br />
Fvalue .l.'robability . C.V.(%)<br />
" , "<br />
Grain yield 11.77<br />
Year (Y) 0.9865 <br />
Variety (V) 4.4990 0.0018<br />
YxV 2.1687 0.0686<br />
Biomass yield 9.96<br />
Year (Y) 0.3149<br />
Variety (V) 3.8226 0.0049<br />
YxV 1.3383 0.2698<br />
Harvest index 8.82<br />
Year (Y) 1.1702 0.3402<br />
Variety (V) 1.6978 0.1503<br />
YxV 0.6191<br />
434
ELEVENTH REGIONAL WHEAT WORKSHOP PARTICIPANTS<br />
l. Dr. Colin Wellings 9. Dr. Efrem Bechere<br />
<strong>The</strong> University of Sydney<br />
10. Ato Fasil Kelemework<br />
Plant Breeding Institute<br />
11 . Ato Setotaw Ferede<br />
Private Bag 11<br />
12. Ato Selamyihun Kidane<br />
Camden<br />
13. Ato Kenea Yadeta<br />
NSW2570<br />
14. Ato Hailemariam Teklewold<br />
AUSTRALIA<br />
15. Ato Sewalem Mebrate<br />
Debre Zeit ARC<br />
2. Ato Aklilu Agidie P.O. Box 32<br />
Adet Research Center<br />
Debre Zeit<br />
P.O. Box 8<br />
ETHIOPIA <br />
Bahir Dar <br />
ETHIOPIA<br />
16. Ato Kassa Getu <br />
Holetta Research Center<br />
3. Dr. Temam Hussein P.O. Box 2003<br />
4. Dr. Harjit Singh Addis Ababa<br />
Dept. of Plant Sciences<br />
ETHIOPIA<br />
Alemaya University<br />
P.O. Box 165<br />
17. Dr. Bedada Girma<br />
Alemaya<br />
18. Ato Temesgen Kebede<br />
ETHIOPIA<br />
19. Ato Debebe Masresha<br />
20. Ato Yesuf Assen<br />
5. Ato Zerihun Kassaye 21. Dr. Amanuel Gorfu<br />
Ambo PPRC<br />
22. Ato Shambel Maru<br />
P.O. Box 37<br />
23. Ato Kefyalew Girma<br />
Ambo<br />
ETHIOPIA<br />
24. Ato Asefa Taa<br />
25. Ato Solomon Gelelcha<br />
Kulumsa Research Center<br />
6. Ato Tenaw Workayehu P.O. Box 489<br />
A wassa Research Center<br />
Asella<br />
P.O. Box 2003<br />
ETHIOPIA <br />
Addis Ababa <br />
ETHIOPIA<br />
26. Ato Kedir Nefo <br />
Sinana Research Center<br />
7. Dr. Thomas Payne P.O. Box 208<br />
8. Mr. Douglas G. Tanner Robe, Bale<br />
CIMMYT<br />
ETHIOPIA<br />
P.O. Box 5689 <br />
Addis Ababa<br />
27. Mr. P.K. Kimurto <br />
ETHIOPIA<br />
Egerton University <br />
Private Bag<br />
Njoro<br />
KENYA<br />
435
<strong>Eleventh</strong> <strong>Regional</strong> <strong>Wheat</strong> <strong>Workshop</strong> Participants<br />
28. Dr. Miriam Kinyua<br />
29. Mr. J.N. Kamwaga<br />
NPBRC-KARI<br />
Private Bag<br />
Njoro<br />
KENYA<br />
30. Dr. J.A. Adjetey<br />
Dept. of Crop Science<br />
National University of Lesotho<br />
P.O. Roma 180 <br />
LESOTHO <br />
31. Dr. Sanjaya Rajaram<br />
32. Dr. Prabhu Pingali<br />
33. Dr. Wolfgang Pfeiffer<br />
34. Dr. Ravi Singh<br />
35. Dr. Bent Skovmand<br />
36. Dr. Dave Hodson<br />
Apdo. Postal 6-641<br />
Col. Juarez, Deleg. Cuauhtemoc<br />
06600 Mexico, D.F.<br />
MEXICO<br />
37. Dr. Cobus Ie Roux<br />
38. Dr. Hugo van Niekerk<br />
39. Ms. Vicki Tolmay<br />
40. Mr. John Tolmay<br />
41. Ms. Rihanle Mare<br />
ARC-SGI<br />
Private Bag X29<br />
Bethlehem 9700<br />
SOUTH AFRICA<br />
42. Dr. Danie <strong>The</strong>unissen<br />
43. Mr. lohan Boonzaier<br />
Sensako<br />
P.O. Box 556 <br />
Bethlehem 9700 <br />
SOUTH AFRICA <br />
44. Mr.. Amsal Tarekegne<br />
45. Mr. Tadesse Dessalegn<br />
Dept. of Plant Breeding<br />
University of the Orange Free State<br />
P.O. Box 339 <br />
Bloemfontein 9300 <br />
SOUTH AFRICA <br />
46. Dr. Mohammed Salih Mohamed<br />
47. Prof. Mamoun Dawelbeit<br />
48. Mr. Izzat Sidahmed Ali Tahir<br />
ARC<br />
P.O. Box 126 <br />
Wad Medani <br />
SUDAN <br />
49. Mr. Orner Ibrahim<br />
Hudeiba Research Station<br />
P.O. Box 31 <br />
EI Darner <br />
SUDAN <br />
50. Mr. Mutwakil Abdel Mageed<br />
New HaIfa Research Station<br />
P.O. Box 17 <br />
New HaIfa <br />
SUDAN <br />
51 . Mr. Paul Antapa<br />
Chief Agronomist<br />
Hanang <strong>Wheat</strong> Complex (CMSC)<br />
P.O. Box 96 <br />
Katesh <br />
TANZANIA <br />
52. Mr. Hussein Mansoor<br />
53. Mr. Mboyi Lucas Mugendi<br />
Selian A.R.I.<br />
P.O. Box 6024 <br />
Arusha <br />
TANZANIA <br />
54. Dr. William Wamala Wagoire<br />
Kalengyere Research Station<br />
P.O. Box 722 <br />
Kabale <br />
UGANDA <br />
55. Dr. Mulugetta Mekuria<br />
CIMMYT<br />
P.O. Box MP 163 <br />
Mount Pleasant <br />
Harare <br />
ZIMBABWE <br />
436
Pnnted at ILRI. MdIs Ababa. EthIopW


