GWPcalc, the Ground Water Protection Calculator - KSCST
GWPcalc, the Ground Water Protection Calculator - KSCST
GWPcalc, the Ground Water Protection Calculator - KSCST

Create successful ePaper yourself
Turn your PDF publications into a flip-book with our unique Google optimized e-Paper software.
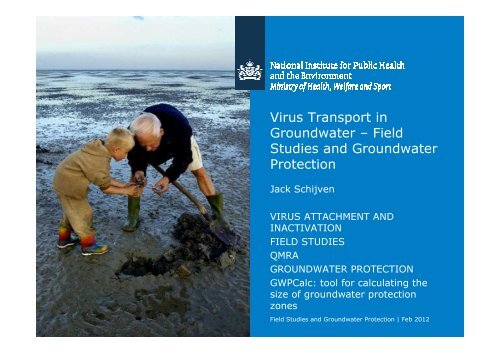
Virus Transport in<br />
<strong>Ground</strong>water – Field<br />
Studies and <strong>Ground</strong>water<br />
<strong>Protection</strong><br />
Jack Schijven<br />
VIRUS ATTACHMENT AND<br />
INACTIVATION<br />
FIELD STUDIES<br />
QMRA<br />
GROUNDWATER PROTECTION<br />
GWPCalc: tool for calculating <strong>the</strong><br />
size of groundwater protection<br />
zones<br />
1 Field Studies and <strong>Ground</strong>water <strong>Protection</strong> | Feb 2012
<strong>Ground</strong>water: Focus on viruses<br />
● Viruses may be transported with groundwater far<strong>the</strong>r than bacteria<br />
and protozoa<br />
– Viruses are very small<br />
– Viruses may attach little to sand grains<br />
– Viruses may survive long<br />
● Viruses may be very infectious<br />
● Diseases outbreaks from contaminated groundwater sources<br />
reported in developing and developed countries<br />
– Howard et al, WHO <strong>Ground</strong>water Monograph, 2006, chapter 10<br />
● Usually vulnerable geologic settings<br />
– Fractured rock, cross connecting well bores, leaking well cases X<br />
presence of sources such as wastewater treatment facilities,<br />
septic tanks, animal manure<br />
● Contamination may be overestimated: Mostly studies of high-risk<br />
wells<br />
2<br />
Field Studies and <strong>Ground</strong>water <strong>Protection</strong> | Feb 2012<br />
VIRUS ATTACHMENT AND INACTIVATION
Viruses<br />
DNA or RNA<br />
Host<br />
Virus<br />
Attachment<br />
Protein coat<br />
Penetration<br />
Polio Rota MS2 PRD1<br />
● Human viruses: host= human cells<br />
● Bacterial viruses: host = bacteria cells<br />
● Bacteriophages MS2 and PRD1 are<br />
model viruses<br />
– Harmless to humans<br />
– Same shape and size<br />
(smallest microorganisms)<br />
– Negative charge: Poor attachment to sand<br />
– Survives well at low temperature<br />
– Easy to enumerate<br />
DNA-replication<br />
Protein syn<strong>the</strong>sis<br />
Assembly<br />
Lysis<br />
Mature viruses<br />
3<br />
Field Studies and <strong>Ground</strong>water <strong>Protection</strong> | Feb 2012<br />
VIRUS ATTACHMENT AND INACTIVATION
Enumeration of viruses<br />
● Enteroviruses<br />
– Tissue culture (infectious virus particles)<br />
PCR (infectious+non-infectious virus particles)<br />
● Bacteriophages<br />
– Double Layer Agar Plate<br />
– Tube<br />
› 1 ml sample (bacteriophages)<br />
› 1 ml host bacteria<br />
› 2.5 ml growth medium<br />
with semi-solid agar<br />
– Solid agar plate<br />
– Count plaques<br />
4<br />
Field Studies and <strong>Ground</strong>water <strong>Protection</strong> | Feb 2012<br />
VIRUS ATTACHMENT AND INACTIVATION
Major removal processes<br />
● Inactivation<br />
● Attachment<br />
-<br />
-<br />
- -<br />
-<br />
-<br />
-<br />
Detachment<br />
-<br />
k det<br />
- -<br />
- - - - Inactivation -<br />
µ <br />
-<br />
l<br />
-<br />
-<br />
-<br />
-<br />
k att<br />
-<br />
- -<br />
Attachment<br />
- -<br />
-<br />
- - - -<br />
- + -<br />
-<br />
+ -<br />
- -<br />
- - -<br />
+<br />
Grain of sand<br />
+<br />
-<br />
-<br />
+<br />
-<br />
-<br />
-<br />
-<br />
- - -<br />
-<br />
+<br />
-<br />
-<br />
-<br />
Inactivation<br />
-<br />
<br />
-<br />
-<br />
-<br />
-<br />
-<br />
-<br />
µ s<br />
-<br />
-<br />
5<br />
Field Studies and <strong>Ground</strong>water <strong>Protection</strong> | Feb 2012<br />
VIRUS ATTACHMENT AND INACTIVATION
Virus attachment<br />
● Bacteriophages as model<br />
viruses<br />
● Bacteriophages MS2 and<br />
PRD1 strongly negative<br />
=> attach less than most<br />
viruses<br />
● Poliovirus neutral<br />
● Coxsackievirus B4<br />
probably negative<br />
● Sticking efficiency α<br />
measure for attachment<br />
and depends on surface<br />
properties of virus and<br />
sand<br />
6<br />
C/C 0<br />
C/C 0<br />
10<br />
1<br />
0.1<br />
0.01<br />
0.001<br />
0.0001<br />
0.00001<br />
0.000001<br />
10<br />
1<br />
0.1<br />
0.01<br />
0.001<br />
0.0001<br />
0.00001<br />
0 24 48 72 96<br />
Time [hours]<br />
0 24 48 72 96 120 144 168<br />
Time [hours]<br />
Field Studies and <strong>Ground</strong>water <strong>Protection</strong> | Feb 2012<br />
VIRUS ATTACHMENT AND INACTIVATION<br />
MS2<br />
PV1<br />
MS2<br />
CB4
Colloid filtration <strong>the</strong>ory<br />
● Collision efficiency η: Probability of collision<br />
– Physical conditions<br />
– Diffusion, interception, sedimentation<br />
● Sticking efficiency α: Probability of<br />
attachment<br />
– Chemical conditions (DLVO)<br />
● Viruses are small<br />
– Diffusion / Brownian movement →<br />
collision efficiency η<br />
– Surface charge → sticking efficiency α<br />
– At lower pH, higher ionic strength →<br />
higher α<br />
7<br />
Field Studies and <strong>Ground</strong>water <strong>Protection</strong> | Feb 2012<br />
VIRUS ATTACHMENT AND INACTIVATION
Collision efficiency η 0<br />
● Collision: Interception, sedimentation, diffusion<br />
● Viruses: Diffusion<br />
0.200<br />
0.150<br />
Viruses 20-200 nm<br />
h 0<br />
0.100<br />
0.070<br />
0.050<br />
0.030<br />
Protozoa<br />
5-10 µm<br />
0.020<br />
0.015<br />
0.010<br />
Bacteria<br />
1-3 µm<br />
0.05 0.10 0.50 1.00 5.00 10.00<br />
Diameter microorganism,mm<br />
8<br />
Field Studies and <strong>Ground</strong>water <strong>Protection</strong> | Feb 2012<br />
VIRUS ATTACHMENT AND INACTIVATION
Virus attachment<br />
● Attachment rate coefficient<br />
● Collision efficiency<br />
k<br />
η<br />
att<br />
=<br />
3 (1 − n)<br />
αηv<br />
2 d<br />
1/ 3 −2 / 3<br />
= 4A s<br />
N<br />
Pe<br />
c<br />
● Peclet number<br />
N = d nv /<br />
Pe<br />
c<br />
D<br />
BM<br />
● Diffusion coefficient<br />
D = K ( T + 273) /(3 d µ )<br />
BM<br />
B<br />
π p<br />
● Happel’s porosity dependent parameter<br />
with<br />
γ =<br />
( 1 − n)<br />
1/ 3<br />
A s<br />
=<br />
2(1 − γ<br />
5<br />
) /(2 − 3γ<br />
+<br />
3γ<br />
5<br />
−<br />
2γ<br />
6<br />
)<br />
9<br />
Field Studies and <strong>Ground</strong>water <strong>Protection</strong> | Feb 2012<br />
VIRUS ATTACHMENT AND INACTIVATION
CFT: Literature and spreadsheet<br />
● Yao KM, Habibian MT, O'Melia CR, <strong>Water</strong> and waste water filtration:<br />
concepts and applications, EST, 1971, 5, 1105-1112<br />
● Tufenkji N, Elimelech M. Correlation Equation for Predicting Single-<br />
Collector Efficiency in Physicochemical Filtration in Saturated Porous<br />
Media, EST, 2004, 38, 529-536<br />
● www.yale.edu/env/elimelech/publication-pdf/TECorrelationEqn.xls<br />
● http://biocolloid.mcgill.ca/publications.html<br />
log<br />
10<br />
C<br />
C<br />
0<br />
= −k<br />
att<br />
L<br />
v<br />
1<br />
ln10<br />
= −<br />
3<br />
2<br />
( 1−<br />
n)<br />
d<br />
c<br />
L<br />
αη<br />
ln10<br />
10<br />
Field Studies and <strong>Ground</strong>water <strong>Protection</strong> | Feb 2012<br />
VIRUS ATTACHMENT AND INACTIVATION
DLVO: Derjaguin-Landau-Verwey-Overbeek <strong>the</strong>ory<br />
● Double Layer force (electrostatic)<br />
– Attractive or repulsive surface charge<br />
– Depends on pH and ionic strength (IS)<br />
● Lifshitz-Van der Waals attractive force<br />
● Born repulsive force<br />
– Overlap of electron clouds at Ip => negatively charged virus<br />
● Ip (MS2) 3.9 Ip (PRD1) 3-4<br />
11<br />
Field Studies and <strong>Ground</strong>water <strong>Protection</strong> | Feb 2012<br />
VIRUS ATTACHMENT AND INACTIVATION
DLVO energy profile<br />
● Energy barrier Φ max<br />
– Repulsion<br />
● Primary minimum Φ min1<br />
– Irreversible attachment<br />
Dimensionless<br />
energy<br />
FêHk B TL<br />
5<br />
0<br />
PRD1-Quartz<br />
ÿÿÿ Electrostatic interaction<br />
ÿÿÿ London-van de Waals attraction<br />
ÿÿÿ Born repulsion<br />
— DLVO -profile<br />
F max 6.94212 z PRD1<br />
F min1 -4.39547 z Quartz<br />
F min2 -0.772816<br />
-17.5572 mV<br />
-42.1402 mV<br />
● Secundary minimum Φ min2<br />
– Reversible attachment<br />
-5<br />
-10 -9 -8 -7 -6<br />
Log 10 Separation distance @mD<br />
● Effect of pH and IS on attachment of PRD1 to sand<br />
– pH increase: more repulsive<br />
– IS increase: less repulsive<br />
● Equations: e.g. Hahn and O’Melia, EST, 2004, 38, 210-220<br />
12<br />
Field Studies and <strong>Ground</strong>water <strong>Protection</strong> | Feb 2012<br />
VIRUS ATTACHMENT AND INACTIVATION
Virus inactivation<br />
● Depends on<br />
– Virus<br />
– Temperature<br />
– pH<br />
= C<br />
Exp<br />
– O<strong>the</strong>r environmental conditions<br />
C<br />
● Literature data virus inactivation in groundwater<br />
– Schijven JF and Hassanizadeh SM, CREST, 2000, 31, 49-127<br />
– Pedley S, Yates M, Schijven JF, West J, Howard G, Barrett M,<br />
Pathogens: Health relevance, transport and attenuation. In:<br />
Protecting groundwater for Health, eds: Schmoll O, Howard G,<br />
Chilton J, Chorus I, WHO, 2006, chapter 3<br />
● Inactivation rate coefficient µ l<br />
at 5-12 °C<br />
t<br />
[ − µ t] ⇒ log = − µ t = t<br />
– 0.023 (0.01 – 0.1) /day = 0.01 (0.0043 – 0.043) log 10<br />
/day<br />
C<br />
C<br />
t 0 l<br />
10<br />
l<br />
− µ<br />
l<br />
0<br />
ln10 2.3<br />
1<br />
1<br />
13<br />
Field Studies and <strong>Ground</strong>water <strong>Protection</strong> | Feb 2012<br />
VIRUS ATTACHMENT AND INACTIVATION
Long term inactivation study<br />
● Objective<br />
– Determine change of ratio of infectious to defective virus<br />
particles over time<br />
● Experimental design<br />
– Three enteroviruses PV1, PV2, CB4<br />
– BGM cell culture: Infectious virus particles, Poisson-distributed<br />
plaque counts<br />
– RT-PCR: Most Probable Number estimates<br />
– Artificial <strong>Ground</strong> <strong>Water</strong> (AGW) + Artificial Surface <strong>Water</strong> (ASW)<br />
– 4 °C and 22 °C<br />
– T= 0 – a year<br />
[<br />
−λ −λ<br />
e<br />
t ]<br />
( )<br />
1<br />
● Biphasic inactivation = C fe<br />
t + 1−<br />
f<br />
C<br />
2<br />
t<br />
0<br />
14<br />
De Roda Husman et al. AEM, 2009, 75(4):1050-1057<br />
Field Studies and <strong>Ground</strong>water <strong>Protection</strong> | Feb 2012<br />
VIRUS ATTACHMENT AND INACTIVATION
Inactivation curves<br />
AGW<br />
ASW<br />
● Bleu: RT-PCR; Green: BGM cell culture<br />
● Ratio RT-PCR/BGM cell culture increases over time<br />
15<br />
Field Studies and <strong>Ground</strong>water <strong>Protection</strong> | Feb 2012<br />
VIRUS ATTACHMENT AND INACTIVATION
Conclusions<br />
● Ratio RT-PCR/BGM cell culture<br />
– Time dependent (increases with time)<br />
– Virus type dependent<br />
– Conditions (temperature, water) dependent<br />
● Inactivation CB4 first order; PV1 and PV2 biphasic<br />
Inactivation rate coefficient, log 10 /day<br />
<strong>Water</strong> °C PV1 PV2 CB4<br />
AGW 4 0.0031 0.0031 0.0035<br />
22 0.011 0.022 0.03<br />
ASW 4 0.0023 0.0013 0.0043<br />
22 0.012 0.0069 0.022<br />
● Inactivation rate coefficient of 0.01 log 10 /day at ≈10°C from literature data<br />
not too conservative<br />
16<br />
De Roda Husman et al. AEM, 2009, 75(4):1050-1057<br />
Field Studies and <strong>Ground</strong>water <strong>Protection</strong> | Feb 2012<br />
VIRUS ATTACHMENT AND INACTIVATION
One site kinetic model<br />
● Virus transport processes through saturated porous media<br />
– Advection / dispersion / attachment / detachment / inactivation<br />
● Governing equations<br />
∂C<br />
∂t<br />
= α v<br />
L<br />
ρB<br />
∂S<br />
=<br />
θ ∂t<br />
2<br />
∂ C ∂C<br />
− v − k<br />
2<br />
∂x<br />
∂x<br />
k<br />
att<br />
C<br />
−<br />
k<br />
det<br />
att<br />
ρB<br />
θ<br />
C<br />
− µ C<br />
l<br />
S − µ<br />
s<br />
+<br />
k<br />
det<br />
ρB<br />
S<br />
θ<br />
ρB<br />
S<br />
θ<br />
17<br />
Field Studies and <strong>Ground</strong>water <strong>Protection</strong> | Feb 2012<br />
VIRUS ATTACHMENT AND INACTIVATION
One kinetic site model: breakthrough curves<br />
Log<br />
scale to<br />
show tail<br />
1<br />
0.1<br />
(k att<br />
+µ l<br />
)C<br />
=> Cmax<br />
katt=0.1; kdet=0.001; mul=0; mus=0<br />
katt=0.2; kdet=0.001; mul=0; mus=0<br />
katt=0.1; kdet=0.004; mul=0; mus=0<br />
katt=0.1; kdet=0.001; mul=0.1; mus=0.1<br />
C/C 0 0.01<br />
0.001<br />
0.0001<br />
0.6<br />
0.5<br />
0.4<br />
C/C 0 0.3<br />
0.2<br />
0.1<br />
0<br />
0 5 10 15 20 25<br />
t(h)<br />
0 5 10 15 20 25<br />
t(h)<br />
k det<br />
S =><br />
level of tail<br />
µ s<br />
S =><br />
slope of tail<br />
18<br />
Field Studies and <strong>Ground</strong>water <strong>Protection</strong> | Feb 2012<br />
VIRUS ATTACHMENT AND INACTIVATION
Two site kinetic model<br />
● Governing equations<br />
∂C<br />
∂t<br />
2<br />
∂ C ∂C<br />
ρB<br />
= α<br />
Lv<br />
− v − k<br />
2<br />
att1C<br />
− katt<br />
2C<br />
− µ<br />
lC<br />
+ kdet1<br />
S1<br />
+ k<br />
∂x<br />
∂x<br />
θ<br />
det2<br />
ρB<br />
θ<br />
S<br />
2<br />
1<br />
0.1<br />
Breakthrough curve of PRD1<br />
2-site kinetic model<br />
ρB<br />
θ<br />
ρB<br />
θ<br />
∂S<br />
∂t<br />
∂S<br />
∂t<br />
ρ<br />
θ<br />
µ<br />
ρ<br />
θ<br />
1 B<br />
B<br />
= k<br />
S<br />
att1C<br />
− kdet1<br />
S1<br />
−<br />
s1<br />
1<br />
ρ<br />
θ<br />
ρ<br />
θ<br />
2 B<br />
B<br />
= k<br />
S<br />
att 2C<br />
− kdet 2<br />
S2<br />
− µ<br />
s2<br />
2<br />
C/C 0<br />
0.01<br />
0.001<br />
0 1 2 3 4 5 6 7<br />
Days<br />
19<br />
Field Studies and <strong>Ground</strong>water <strong>Protection</strong> | Feb 2012<br />
VIRUS ATTACHMENT AND INACTIVATION
Modeling breakthrough curves: one and two kinetic sites<br />
C/C 0<br />
1<br />
0.01<br />
0.0001<br />
b<br />
c<br />
a<br />
∂C<br />
∂t<br />
2<br />
∂ C ∂C<br />
ρB<br />
= α<br />
Lv<br />
− v − k<br />
2<br />
att1C<br />
− katt<br />
2C<br />
− µ<br />
lC<br />
+ kdet1<br />
S1<br />
+ k<br />
∂x<br />
∂x<br />
θ<br />
ρ<br />
B<br />
∂S<br />
θ ∂t<br />
ρB<br />
∂S<br />
θ ∂t<br />
ρ<br />
θ<br />
det2<br />
ρB<br />
S<br />
θ<br />
ρ<br />
θ<br />
1 B<br />
B<br />
= k<br />
S<br />
att1C<br />
− kdet1<br />
S1<br />
− µ<br />
s1<br />
1<br />
ρ<br />
θ<br />
ρ<br />
θ<br />
2 B<br />
B<br />
= k<br />
S<br />
att 2C<br />
− kdet<br />
2<br />
S2<br />
− µ<br />
s2<br />
2<br />
2<br />
0.000001<br />
0 24 48 72 96 120 144 168 192<br />
Time [hours]<br />
– v and α L<br />
from NaCl tracer<br />
– µ l<br />
from inactivation experiment<br />
– CXTFIT: 1 kinetic site model<br />
– HYDRUS-1D: 2 kinetic site model<br />
– µ s<br />
≈ slope of tail<br />
Rate coefficients A B C<br />
(day -1 )<br />
one site one site two sites<br />
katt1 4.8 2.6 2.0<br />
kdet1 6.7 0.065 0.065<br />
katt2 3.36<br />
kdet2 13.7<br />
µ s1=µ s2 5.8 0.43 0.43<br />
Goodness of fit 98% 92% 98%<br />
20<br />
Field Studies and <strong>Ground</strong>water <strong>Protection</strong> | Feb 2012<br />
VIRUS ATTACHMENT AND INACTIVATION
Field study dune recharge Castricum<br />
21<br />
Field Studies and <strong>Ground</strong>water <strong>Protection</strong> | Feb 2012<br />
FIELD STUDIES
Field study dune recharge Castricum<br />
22<br />
Field Studies and <strong>Ground</strong>water <strong>Protection</strong> | Feb 2012<br />
FIELD STUDIES
Field study dune recharge Castricum<br />
23<br />
Field Studies and <strong>Ground</strong>water <strong>Protection</strong> | Feb 2012<br />
FIELD STUDIES
Salt tracer<br />
● NaCl<br />
● 7 days pulse<br />
● Pore water velocity (1.5 m/day)<br />
● Dispersivity<br />
EC (µS/cm)<br />
3800<br />
2800<br />
1800<br />
800<br />
Compartment<br />
PCO2 (2.4 m)<br />
PCO4 (6.0 m)<br />
PCO6 (17 m)<br />
0 5 10 15 20 25 30 35 40<br />
EC (µS/cm)<br />
3800<br />
2800<br />
1800<br />
Compartment<br />
PCO3 (3.8 m)<br />
PCO5 (10 m)<br />
PCO7 (30 m)<br />
800<br />
0 5 10 15 20 25 30 35 40<br />
Day<br />
24<br />
Field Studies and <strong>Ground</strong>water <strong>Protection</strong> | Feb 2012<br />
FIELD STUDIES
Breakthrough curves<br />
● Bacteriophages<br />
– MS2<br />
– PRD1<br />
C (pfp/l)<br />
1.E+09<br />
1.E+08<br />
1.E+07<br />
1.E+06<br />
1.E+05<br />
1.E+04<br />
1.E+03<br />
1.E+02<br />
1.E+01<br />
1.E+00<br />
MS2<br />
Compartment<br />
PCO2 (2.4 m)<br />
PCO3 (3.8 m)<br />
PCO4 (6.4 m)<br />
PCO5 (10 m)<br />
PCO6 (17 m)<br />
PCO7 (30 m)<br />
– 7 days seeding<br />
1.E-01<br />
1.E-02<br />
1.E-03<br />
0 25 50 75 100 125<br />
C (pfp/l)<br />
1.E+08<br />
1.E+07<br />
1.E+06<br />
1.E+05<br />
1.E+04<br />
1.E+03<br />
1.E+02<br />
1.E+01<br />
1.E+00<br />
1.E-01<br />
1.E-02<br />
PRD1<br />
Compartment<br />
PCO2 (2.4 m)<br />
PCO3 (3.8 m)<br />
PCO4 (6.4 m)<br />
PCO5 (10 m)<br />
PCO6 (17 m)<br />
PCO7 (30 m)<br />
1.E-03<br />
0 25 50 75 100 125<br />
25<br />
Field Studies and <strong>Ground</strong>water <strong>Protection</strong> | Feb 2012<br />
FIELD STUDIES
MS2<br />
Inactivation<br />
● Mild conditions<br />
– near neutral pH<br />
C/C0<br />
10<br />
1<br />
Obs in peptone/saline at lab<br />
Linear fit: 0.0008 log10/day<br />
.<br />
Obs in compartment water at<br />
lab<br />
Linear fit: 0.019 log10/day<br />
Obs in well water at lab<br />
– low temperature<br />
●→ First order rate decrease<br />
0.1<br />
Linear fit: 0.028 log10/day<br />
Obs in well water at field<br />
Linear fit: 0.013 log10/day<br />
0.01<br />
0 10 20 30 40<br />
Day<br />
PRD1<br />
10<br />
Obs in peptone/saline at lab<br />
1<br />
Linear fit: 0.0026 log10/day<br />
.<br />
Obs in compartment water at<br />
lab<br />
Linear fit: 0.0032 log10/day<br />
C/C0<br />
Obs in well water at lab<br />
0.1<br />
Linear fit: 0.0041 log10/day<br />
Obs in well water at field<br />
Linear fit: 0.050 log10/day<br />
0.01<br />
0 10 20 30 40<br />
Day<br />
26<br />
Field Studies and <strong>Ground</strong>water <strong>Protection</strong> | Feb 2012<br />
FIELD STUDIES
Modeling breakthrough curves<br />
C (viruses/l)<br />
C (viruses/l)<br />
10000000<br />
100000<br />
10000000<br />
100000<br />
1000<br />
1000<br />
10<br />
0.1<br />
10<br />
0.1<br />
MS2 - Well PCO2 at 2.4 m<br />
0 20 40 60 80 100 120 140<br />
Day<br />
MS2 - Well PCO3 at 3.8 m<br />
Observation<br />
One-site model<br />
Two-site model<br />
0 20 40 60 80 100 120 140<br />
Day<br />
Observations<br />
One-site model<br />
Two-site model<br />
Rate coefficients one site two sites<br />
(day -1 )<br />
katt1 4.1 4.2<br />
kdet1 0.00087 0.00079<br />
katt2 0.47<br />
kdet2 0.54<br />
µ s1=µ s2 0.085 0.085<br />
Goodness of fit 75% 79%<br />
Rate coefficients one site two sites<br />
(day -1 )<br />
k att1 3.2 3.2<br />
k det1 0.0016 0.0022<br />
k att2 0.17<br />
k det2 0.24<br />
µ s1 =µ s2 0.092 0.092<br />
Goodness of fit 77% 80%<br />
27<br />
Field Studies and <strong>Ground</strong>water <strong>Protection</strong> | Feb 2012<br />
FIELD STUDIES
Deep well injection study<br />
● Redox-zones: Attachment to iron oxyhydroxides in O 2<br />
-zone<br />
m-Field Level<br />
- 250<br />
PP.1<br />
WP.1<br />
WP.3<br />
IP.2<br />
WP.2<br />
WP.4<br />
- 260<br />
6<br />
- 270<br />
- 280<br />
- 290<br />
- 300<br />
- 310<br />
- 320<br />
- 330<br />
- 340<br />
2<br />
5<br />
5<br />
5<br />
2 5<br />
3<br />
2<br />
2<br />
4<br />
2<br />
2<br />
5<br />
4<br />
4<br />
4<br />
4<br />
4<br />
4 4 4<br />
4<br />
4<br />
2<br />
6<br />
6<br />
6<br />
6<br />
6<br />
6<br />
8<br />
8<br />
3<br />
3<br />
8<br />
3<br />
3<br />
10<br />
8<br />
3<br />
8<br />
1<br />
10<br />
8<br />
10<br />
12<br />
10<br />
2<br />
2 10<br />
2<br />
2<br />
2<br />
10<br />
12<br />
12<br />
clay, loam<br />
fine sand<br />
screens<br />
coarse sand<br />
temperature sensor<br />
n<br />
12<br />
12<br />
1<br />
12<br />
1 1<br />
(1)<br />
1<br />
1<br />
98 38<br />
8<br />
0<br />
12<br />
22<br />
[distance to IP.2;m]<br />
[distance to IP.2;m]<br />
71477 R 03<br />
28<br />
Field Studies and <strong>Ground</strong>water <strong>Protection</strong> | Feb 2012<br />
FIELD STUDIES
Soil passage effectively removes viruses<br />
● 8 log 10<br />
removal (non-linear with distance)<br />
– After 25 days (30 m) dune passage<br />
– After 40 days (38 m) deep well injection<br />
0<br />
Removal<br />
Log 10 (C/C 0 )<br />
-2<br />
-4<br />
-6<br />
MS2 - dune recharge<br />
PRD1 - dune recharge<br />
MS2 - deep well injection<br />
PRD1 - deep well injection<br />
-8<br />
-10<br />
0 10 20 30 40<br />
Travel time [days]<br />
29<br />
Field Studies and <strong>Ground</strong>water <strong>Protection</strong> | Feb 2012<br />
FIELD STUDIES
Removal processes during soil passage<br />
● Effective virus removal if sites for attachment are<br />
present (mostly iron hydroxides; sticking efficiency α∼10 -3 )<br />
0<br />
● Virus population<br />
heterogeneity?<br />
Virus removal<br />
Log 10 (C/C 0 )<br />
-2<br />
-4<br />
-6<br />
MS2 - dune recharge<br />
PRD1 - dune recharge<br />
MS2 - deep well injection<br />
PRD1 - deep well injection<br />
-8<br />
● Little removal if attachment sites are absent<br />
(e.g. when oxygen deficient aquifer)<br />
→ conservative value for attachment to be used in calculation of<br />
protection zones (sticking efficiency α∼10 -5 )<br />
-10<br />
0 10 20 30 40<br />
Travel time [days]<br />
30<br />
Field Studies and <strong>Ground</strong>water <strong>Protection</strong> | Feb 2012<br />
FIELD STUDIES
Dutch Drinking <strong>Water</strong> Act 2001<br />
● No pathogens in drinking water in concentrations that adversely<br />
affect public health ≠ zero => risk<br />
● Quantitative Microbiological Risk Assessment (QMRA)<br />
– WHO Drinking <strong>Water</strong> Guidelines (eds 3+4): Health based target<br />
– The Ne<strong>the</strong>rlands: Max infection risk = 10 -4 per person per year<br />
– Drinking water concentration ≈ 1 pathogen in 1 000 000 liter<br />
● QMRA required for drinking water<br />
from surface water and vulnerable groundwater<br />
● Index pathogens<br />
– Enteroviruses, Campylobacter, Cryptosporidium, Giardia<br />
31<br />
Field Studies and <strong>Ground</strong>water <strong>Protection</strong> | Feb 2012<br />
QMRA
Environmental Inspectorate Guideline 5318 (2006)<br />
● How to do QMRA<br />
● QMRA from surface water to drinking water<br />
– Quality of source water (index pathogens)<br />
– Treatment efficiency (indicator organisms)<br />
Index pathogens<br />
Indicator organisms<br />
Enteroviruses 20-200 nm Bacteriophages 20-60 nm<br />
Campylobacter 1-2 µm E.coli 1-2 µm<br />
Cryptosporidium 5-6 µm Spores of sulphite<br />
Giardia 8-10 µm reducing clostridia (SSRC) 1 µm<br />
● QMRA from vulnerable groundwater to drinking water<br />
– Is protection zone of 60 days an adequate barrier (natural treatment)?<br />
● Unconfined sandy aquifers and karst aquifers are vulnerable<br />
– No protective confining (clay) layers<br />
– Karst: fast flow paths<br />
32<br />
Field Studies and <strong>Ground</strong>water <strong>Protection</strong> | Feb 2012<br />
QMRA
QMRA from surface water to drinking water<br />
● C sw<br />
= Pathogen concentration in source water [N/liter]<br />
● R = Recovery = fraction of detected pathogens [-]<br />
● Z = Fraction of microorganisms passing treatment [-]<br />
● C dw<br />
= Pathogen concentration in drinking water [N/liter]<br />
● V = Consumption of unboiled drinking water [liter]<br />
● P m<br />
= Infectivity of pathogen [-]<br />
● P inf<br />
= Infection risk [per person per day or year]<br />
● P inf,day<br />
= C sw<br />
x 1/R x Z x V x P m<br />
365<br />
● P inf,year<br />
= 365.25 x P inf,day<br />
or P = 1−<br />
− P<br />
inf, year<br />
1<br />
i=<br />
1<br />
∏( )<br />
inf, dayi<br />
● Drinking water companies: point estimates (average values)<br />
● RIVM: Monte Carlo simulations (variability)<br />
33<br />
Field Studies and <strong>Ground</strong>water <strong>Protection</strong> | Feb 2012<br />
QMRA
QMRA from groundwater to drinking water<br />
● Guideline 5318<br />
– Unconfined sandy and karst aquifers are considered vulnerable<br />
<strong>the</strong>refore QMRA required<br />
● <strong>Protection</strong> zone:<br />
– No sources of contamination allowed within that zone<br />
● Source concentration, C s<br />
● Setback distance r s<br />
and travel time T determine size of protection<br />
zone, which is <strong>the</strong> soil barrier<br />
● Z = fraction of pathogens<br />
able to pass <strong>the</strong> soil barrier<br />
P inf<br />
= C s<br />
x 1/R x Z x V x P m<br />
≤ 10 -4<br />
34<br />
Field Studies and <strong>Ground</strong>water <strong>Protection</strong> | Feb 2012<br />
QMRA
History of 60-days protection zone<br />
● Knorr, Das Gas- und Wasserfach 1937, 80: 330-334<br />
– Survival of bacteria in a bottle of water<br />
– No bacteria detected after 60 days<br />
● 60-days protection zone<br />
– After 50-60 days no danger to public health<br />
● Austria, Denmark, Germany, Ghana,<br />
Indonesia,The Ne<strong>the</strong>rlands, UK<br />
● But viruses (and o<strong>the</strong>r pathogens)<br />
may survive longer<br />
● Is 60-days enough protection<br />
for a maximum infection risk of 10 -4 p -1 y -1 ?<br />
35<br />
Field Studies and <strong>Ground</strong>water <strong>Protection</strong> | Feb 2012<br />
GROUNDWATER PROTECTION
<strong>Protection</strong> zones that comply with 10 -4 infection risk<br />
● Shallow, unconfined sandy aquifers<br />
● Viruses leaking from a sewage pipe<br />
● Horizontal transport to <strong>the</strong> pumping well<br />
● Literature data distributions of parameters (Monte Carlo simulation)<br />
● Removal processes<br />
– Little attachment (field data at anoxic conditions), α=10 -5<br />
– Extensive literature data on virus inactivation, µ=0.01 log 10<br />
/day<br />
● Dilution in groundwater<br />
– Pumping rate Q W<br />
at well<br />
36<br />
Field Studies and <strong>Ground</strong>water <strong>Protection</strong> | Feb 2012<br />
GROUNDWATER PROTECTION
Steady state model<br />
⎛ C ⎞<br />
A<br />
1 ⎛ 3 5/3 1 2⎞<br />
log ⎜<br />
⎟<br />
10<br />
= log10<br />
Z = − ⎜ αk1R<br />
+ µ<br />
lk2R<br />
⎟ + log<br />
⎝ C0⎠<br />
2.3⎝<br />
5 2 ⎠<br />
Removal = Attachment + Inactivation + Dilution<br />
C A<br />
is virus concentration at well<br />
C 0<br />
is virus concentration in wastewater<br />
α is sticking efficiency (attachment parameter) = 10 -5<br />
µ l<br />
is <strong>the</strong> inactivation rate coefficient = 0.01 log 10<br />
/day<br />
k 1<br />
en k 2<br />
physical constants<br />
q is leakage rate of sewage pipe<br />
Q is abstraction rate of groundwater<br />
R is radial distance sourcewell<br />
10<br />
⎛<br />
⎜<br />
⎝<br />
q<br />
Q<br />
⎞<br />
⎟<br />
⎠<br />
● QMRA: p inf<br />
= C 0<br />
x Z x V x p m<br />
≤ 10 -4<br />
37<br />
Field Studies and <strong>Ground</strong>water <strong>Protection</strong> | Feb 2012<br />
GROUNDWATER PROTECTION
Monte<br />
Carlo<br />
Simulations<br />
VIRUS PROPERTIES AQUIFER PROPERTIES RISK ASSESSMENT<br />
Sewage: 100 Enteroviruses/L Aquifer thickness Consumption 0.27 L/day<br />
Leakage rate q=1m3/day Grain size Rotavirus infectivity<br />
Inactivation 0.01 log10/day Porosity <strong>Protection</strong> zone 200-400m<br />
Sticking efficiency α=10-5 Temperature <strong>Protection</strong> zone 1-2 years<br />
38<br />
Field Studies and <strong>Ground</strong>water <strong>Protection</strong> | Feb 2012<br />
GROUNDWATER PROTECTION
Sensitivity analysis<br />
● Size of protection zone most sensitive to inactivation and attachment<br />
Parameter<br />
Attachment α<br />
Parameter<br />
value<br />
R 95 (m)<br />
T 95 (day)<br />
T 95 (year)<br />
10 -5 231 603 1.7<br />
10 -4 132 215 0.6<br />
10 -3 47 29 0.3<br />
0.01<br />
280<br />
859<br />
2.4<br />
Inactivation µ l<br />
(day -1 )<br />
0.1<br />
0.4<br />
105<br />
55<br />
109<br />
29<br />
0.3<br />
0.08<br />
39<br />
Field Studies and <strong>Ground</strong>water <strong>Protection</strong> | Feb 2012<br />
GROUNDWATER PROTECTION
Conclusions<br />
● Shallow unconfined sandy aquifers (20-35 m deep)<br />
– Travel time of 1 to 2 years (206 - 418 m setback distance)<br />
– Infection risk below 10 -4 per person per year with 95% certainty<br />
● Most sensitive model parameters for size of protection zone<br />
– Attachment and inactivation<br />
● A smaller protection zone<br />
– Demonstrate aquifer properties that lead to more virus removal<br />
– Location specific investigation<br />
● Only horizontal transport considered<br />
– If vertical transport is significant <strong>the</strong>n<br />
protection zone may be overestimated<br />
40<br />
Field Studies and <strong>Ground</strong>water <strong>Protection</strong> | Feb 2012<br />
GROUNDWATER PROTECTION
Vulnerability<br />
● Environmental Inspectorate Guideline 5318 (2006)<br />
– All unconfined sandy aquifers and karst aquifers are vulnerable<br />
– QMRA of drinking water from vulnerable groundwater<br />
● <strong>Ground</strong>water companies<br />
– Deeper unconfined aquifers should be less vulnerable<br />
● Vulnerability<br />
– Ability of viruses to be transported with <strong>the</strong> groundwater<br />
– Less attenuation of virus in a more vulnerable aquifer<br />
– Attenuation depends on properties of viruses and aquifer<br />
● Size of protection zone:<br />
– Maximum risk level (health based target) [risk]<br />
– Virus source concentration [source]<br />
– Attenuation of virus concentration [vulnerability]<br />
41<br />
Field Studies and <strong>Ground</strong>water <strong>Protection</strong> | Feb 2012<br />
GROUNDWATER PROTECTION
Properties of viruses<br />
● Significant threat to public health<br />
– Very infectious<br />
– Commonly gastroenteritis, but also more severe illness<br />
● Can be very persistent<br />
– survive well = inactivate slow; µ=0.01 log 10<br />
/day<br />
● Usually little attachment to sand grains<br />
– Many viruses are negatively charged; α=10 -5<br />
● Very small<br />
– 20-200 nm<br />
– Negligible straining<br />
● λ= virus removal rate coefficient<br />
(inactivation + attachment)<br />
42<br />
Field Studies and <strong>Ground</strong>water <strong>Protection</strong> | Feb 2012<br />
GROUNDWATER PROTECTION
Properties of unconfined sandy aquifers<br />
● No confining layers<br />
● High permeability<br />
● In <strong>the</strong> Ne<strong>the</strong>rlands often shallow<br />
● Properties relevant to virus attachment and inactivation = λ<br />
– porosity, grain size, iron hydroxides, temperature, pH, ionic<br />
strength, ion composition, organic content, etc.<br />
● Properties relevant to virus advection, dispersion, dilution<br />
– m = anisotropy factor<br />
– Q = Pumping rate of abstraction well<br />
– H= thickness of aquifer<br />
– z t<br />
=top of well screen<br />
– z b<br />
=bottom of well screen<br />
43<br />
Field Studies and <strong>Ground</strong>water <strong>Protection</strong> | Feb 2012<br />
GROUNDWATER PROTECTION
Model development<br />
● Vulnerability parameters<br />
– Virus+aquifer properties<br />
● Dimensionless model<br />
– Model parameters are dimensionless<br />
– Lower number of model parameters<br />
● Numerical calculations (FlexPDE)<br />
– Calculate r s*<br />
= dimensionless setback distance<br />
to achieve a required virus removal<br />
● Empirical formula<br />
– Fit a formula to values of r s*<br />
as a function of <strong>the</strong> vulnerability<br />
parameters<br />
● r s*<br />
= dimensionless setback distance = vulnerability index<br />
– Different combinations of <strong>the</strong> vulnerability parameters leading to<br />
<strong>the</strong> same virus attenuation have <strong>the</strong> same r<br />
*<br />
s<br />
r *<br />
1<br />
0<br />
-1<br />
-2<br />
-3<br />
æ<br />
æ<br />
à<br />
à<br />
æ<br />
æ<br />
àà æ<br />
æ<br />
àààààà æ ææ æ<br />
æ<br />
æ<br />
à àà àà<br />
æ æ<br />
æ æ æ<br />
à<br />
æ<br />
æ<br />
æà<br />
à<br />
æ æææ<br />
à<br />
æ à æ<br />
æ æ à à<br />
à<br />
æ<br />
æ ææ<br />
æ<br />
æææ<br />
ææ æ æ<br />
æ æ<br />
à ææ<br />
æ<br />
æ<br />
æ<br />
æ<br />
æææ<br />
æææ<br />
æ<br />
æ<br />
ææ<br />
à<br />
à æ<br />
à<br />
ææ<br />
æ<br />
à<br />
-2 -1 0 1 2 3<br />
l *<br />
æ<br />
æ<br />
æ<br />
æ<br />
à<br />
æ<br />
æ<br />
æ<br />
æ<br />
44<br />
Field Studies and <strong>Ground</strong>water <strong>Protection</strong> | Feb 2012<br />
GROUNDWATER PROTECTION
Model domain<br />
Well screen<br />
C * =10 -8<br />
Q<br />
r s * = r s<br />
/H<br />
Vulnerability index<br />
*<br />
Setback distance<br />
Contamination<br />
source<br />
H/H=1<br />
● Steady state<br />
– Constant pumping rate and constant leakage rate of virus from sewer<br />
● Horizontal radial and vertical transport<br />
● Dimensionless model<br />
– The model domain was scaled=divided by H, <strong>the</strong> aquifer thickness<br />
● Dimensional virus removal rate coefficient<br />
– Inactivation + attachment: λ*= λ n π H 3 /Q<br />
45<br />
Field Studies and <strong>Ground</strong>water <strong>Protection</strong> | Feb 2012<br />
GROUNDWATER PROTECTION
Radial water flow under steady state conditions<br />
● Governing equation<br />
k<br />
z<br />
2<br />
∂ h<br />
2<br />
∂z<br />
– where, t [T] is <strong>the</strong> time, h [L]is <strong>the</strong> hydraulic head, k r<br />
[LT -1 ] is <strong>the</strong><br />
hydraulic conductivity in <strong>the</strong> r-direction and k z<br />
[LT -1 ] is <strong>the</strong><br />
hydraulic conductivity in <strong>the</strong> z-direction<br />
+<br />
k<br />
r<br />
r<br />
∂<br />
∂r<br />
∂h<br />
r<br />
∂r<br />
=<br />
0<br />
● Dimensionless flow equation<br />
1<br />
m<br />
2<br />
∂ h<br />
∂z<br />
*<br />
*2<br />
+<br />
1<br />
r<br />
*<br />
∂<br />
∂r<br />
*<br />
⎛<br />
⎜r<br />
⎝<br />
*<br />
∂h<br />
∂r<br />
*<br />
*<br />
⎞<br />
⎟<br />
⎠<br />
=<br />
0<br />
– Division of governing equation by k r<br />
and scaling to H [L] which is<br />
<strong>the</strong> total thickness of all aquifer layers<br />
46<br />
Field Studies and <strong>Ground</strong>water <strong>Protection</strong> | Feb 2012<br />
GROUNDWATER PROTECTION
Virus transport<br />
● Governing equation<br />
v<br />
z<br />
∂ 2<br />
C ∂C<br />
∂ C<br />
+ vr<br />
− Dzz<br />
−<br />
1<br />
2<br />
∂z<br />
∂r<br />
∂z<br />
r<br />
∂<br />
∂r<br />
⎛<br />
⎜<br />
⎝<br />
D<br />
rr<br />
r<br />
∂C<br />
∂r<br />
⎞<br />
⎟<br />
⎠<br />
= −λC<br />
– where, v r<br />
and v z<br />
are <strong>the</strong> vertical and radial pore water velocities<br />
– λ [T -1 ] is <strong>the</strong> virus removal rate coefficient, which entails both<br />
attachment and inactivation.<br />
– D rr<br />
≈α r<br />
v r<br />
and D zz<br />
≈α z<br />
v z<br />
[L 2 T -1 ] are <strong>the</strong> dispersion coefficients in r and<br />
z directions.<br />
● Dimensionless virus transport equation<br />
v<br />
∂<br />
∂z<br />
∂<br />
∂r<br />
∂<br />
∂z<br />
*<br />
*<br />
2 *<br />
*<br />
* C * C<br />
* * C 1 * * * C<br />
* *<br />
z<br />
+ v 0.1<br />
v<br />
v r<br />
C<br />
* r<br />
− α<br />
*<br />
r r<br />
− α<br />
*2 * r<br />
⎜<br />
* r<br />
⎟ = −λ<br />
*<br />
r<br />
∂<br />
∂r<br />
⎛<br />
⎜<br />
⎝<br />
∂<br />
∂r<br />
⎞<br />
⎟<br />
⎠<br />
47<br />
Field Studies and <strong>Ground</strong>water <strong>Protection</strong> | Feb 2012<br />
GROUNDWATER PROTECTION
Parameter<br />
Description<br />
* *<br />
A = 2r<br />
l<br />
Leakage area<br />
s<br />
s<br />
s<br />
Dimensionless<br />
parameters<br />
48<br />
Varied in numerical simulations<br />
* A<br />
Cross sectional area of <strong>the</strong> screen of <strong>the</strong> abstraction well<br />
w<br />
Aw<br />
=<br />
2<br />
πH<br />
* r<br />
*<br />
α = α<br />
r<br />
0.005rs<br />
H =<br />
Dispersivity in <strong>the</strong> r -direction.<br />
* α<br />
*<br />
Dispersivity in <strong>the</strong> z -direction<br />
z<br />
α<br />
z<br />
= = 0.1α<br />
r<br />
H<br />
* C<br />
Virus concentration with C<br />
R<br />
[L -3 ] <strong>the</strong> concentration at <strong>the</strong><br />
C =<br />
abstraction well at R [L] from <strong>the</strong> source of contamination.<br />
*<br />
C<br />
s<br />
C R<br />
Virus concentration at <strong>the</strong> contamination source<br />
* h<br />
Aquifer thickness<br />
h =<br />
H<br />
πH<br />
2 πH<br />
Horizontal hydraulic conductivity,<br />
*<br />
kr<br />
= kr<br />
= ∑tri<br />
Q Q<br />
where tr<br />
i<br />
[m 2 day -1 ] is <strong>the</strong> transmissivity of i-th aquifer layer.<br />
3<br />
* nπH<br />
Dimensionless removal rate coefficient,<br />
λ = λ<br />
Q<br />
k<br />
Anisotropy ratio<br />
r<br />
m =<br />
k<br />
z<br />
* q<br />
Dilution, where q = 1 m 3 day -1 (Schijven et al., 2006).<br />
Q =<br />
Q<br />
* r * z<br />
Radial and vertical coordinate<br />
r = , z =<br />
H H<br />
2<br />
2<br />
* nπH<br />
* nπH<br />
Radial and vertical pore water velocity<br />
vr = v r<br />
, vz<br />
= vz<br />
Q<br />
Q<br />
* zb<br />
* z Bottom and top of <strong>the</strong> well screen<br />
t<br />
zb<br />
= 1−<br />
, zt<br />
= 1−<br />
H H<br />
Field Studies and <strong>Ground</strong>water <strong>Protection</strong> | Feb 2012<br />
GROUNDWATER PROTECTION
Numerical simulations (FlexPDE)<br />
● Dutch groundwater database<br />
– Dimensionless parameter values of 35 unconfined aquifers<br />
– λ=0.03 day -1 (α =10 -5 , µ l =0.01 log 10 /day)<br />
Dimensionless parameter Mean Min Max Values for numerical simulation<br />
λ* removal rate coefficient 45 0.79 645 0.01, 0.1, 1, 10, 100, 1000<br />
Q* dilution factor 0.00012 0.000037 0.0019 0.0001, 0.001<br />
k r * horizontal hydraulic conductivity 500 4.4 6900 10, 100, 1000<br />
m anisotropy factor 1.6 1 3.5 1, 2, 5, 10<br />
z t * top of well screen 0.72 0.31 1 1, 0.85, 0.75, 0.5<br />
z t *-z b * length of well screen 0.43 0.042 0.82 025, 0.5<br />
H (m) aquifer depth 116 23 334 -<br />
C s * virus source concentration 10 4 …10 8<br />
● 212 cases simulated<br />
● Set vulnerability index r s * to get required removal (such that C * at well =1)<br />
● No effect of k r *<br />
● Fit r s * to vulnerability parameters<br />
49<br />
Field Studies and <strong>Ground</strong>water <strong>Protection</strong> | Feb 2012<br />
GROUNDWATER PROTECTION
First fitting step: If z t*<br />
=1 (horizontal transport)<br />
● Numerical simulations =><br />
Linear relation lnr s * and lnλ *<br />
● Steady state solution,<br />
neglecting dispersion<br />
ln r<br />
*<br />
s<br />
1<br />
= ln ln<br />
s<br />
Q<br />
2<br />
1<br />
2<br />
[<br />
* *] *<br />
C + ln − ln<br />
r<br />
* 2<br />
s<br />
=<br />
λ<br />
C<br />
Q<br />
* *<br />
s<br />
*<br />
λ<br />
*<br />
● Fit data to<br />
ln r<br />
● R 2 =99.9%<br />
● a 1 = 0.557<br />
● a 2 = 0.467<br />
● Empirical formula<br />
[<br />
* *] *<br />
C + lnQ<br />
a ln<br />
*<br />
s<br />
= a1<br />
ln ln<br />
s<br />
+<br />
r<br />
*<br />
s<br />
2<br />
λ<br />
[<br />
* *<br />
( )] 0.557 * −0.<br />
467<br />
ln C Q<br />
= λ<br />
s<br />
50<br />
Field Studies and <strong>Ground</strong>water <strong>Protection</strong> | Feb 2012<br />
GROUNDWATER PROTECTION
Second fitting step: If z t *
Empirical formula<br />
r<br />
*<br />
s<br />
=<br />
( ) − ⎡<br />
− − * 2.19 *<br />
* * 0.557 * 0.467 * 0.227 * 0.383 −1.17<br />
zt<br />
1.64<br />
*<br />
*<br />
lnC 0.207( −1) [ 0.529 − 2.99 ] * ⎤<br />
sQ<br />
λ Exp Cs<br />
Q λ m zt<br />
Exp zt<br />
zb<br />
⎥ ⎦<br />
⎢⎣<br />
● R 2 =97.9%<br />
52<br />
Field Studies and <strong>Ground</strong>water <strong>Protection</strong> | Feb 2012<br />
GROUNDWATER PROTECTION
Conclusions<br />
● Empirical formula developed to calculate vulnerability index<br />
(dimensionless setback distance) and setback distance of an<br />
unconfined sandy aquifer to protect against virus contamination<br />
● Deeper unconfined aquifers with deep well screen are less<br />
vulnerable and even more is anisotropy factor m>1<br />
● A higher pumping rate Q increases dilution and flow rate, <strong>the</strong> net<br />
effect is increased vulnerability<br />
● Integral part of Quantitative Microbial Risk Assessment<br />
● Next steps:<br />
– Incorporate in Inspectorate Guideline 5318<br />
– Compare calculated with actual setback distances<br />
53<br />
Field Studies and <strong>Ground</strong>water <strong>Protection</strong> | Feb 2012<br />
GROUNDWATER PROTECTION
GWPCalc<br />
Empirical formula from<br />
numerical calculations,<br />
including vertical<br />
transport<br />
(Schijven et al., 2010)<br />
Virus source<br />
(leaking sewer or<br />
septic tank at<br />
groundwater table)<br />
or any o<strong>the</strong>r<br />
contaminant<br />
Well<br />
screen<br />
Aquifer<br />
thickness H<br />
Required removal:<br />
Source 100 vir/L=><br />
8 log 10<br />
removal=><br />
<strong>Ground</strong>water 10 -6 vir/L=><br />
Infection risk
Example 0<br />
●<br />
●<br />
Unconfined / shallow / well screen high<br />
Most sensitive aquifer thickness, pumping rate<br />
and removal rate coefficient<br />
55<br />
Field Studies and <strong>Ground</strong>water <strong>Protection</strong> | Feb 2012<br />
GWPCalc
Example 1<br />
●<br />
●<br />
Unconfined / less shallow / well screen high<br />
Most sensitive aquifer thickness, pumping rate<br />
and removal rate coefficient<br />
56<br />
Field Studies and <strong>Ground</strong>water <strong>Protection</strong> | Feb 2012<br />
GWPCalc
Example 2<br />
●<br />
●<br />
Unconfined / less shallow / well screen deep<br />
Also sensitive to changes in anisotropy<br />
57<br />
Field Studies and <strong>Ground</strong>water <strong>Protection</strong> | Feb 2012<br />
GWPCalc
Example 3<br />
●<br />
Confined / less shallow / well screen deep<br />
58<br />
Field Studies and <strong>Ground</strong>water <strong>Protection</strong> | Feb 2012<br />
GWPCalc
Example 4<br />
●<br />
●<br />
●<br />
Well screen crosses a confining layer<br />
Virus transport in upper aquifer<br />
Dilution with water from lower, clean aquifer<br />
59<br />
Field Studies and <strong>Ground</strong>water <strong>Protection</strong> | Feb 2012<br />
GWPCalc
Conclusions<br />
● GWPCalc is a tool with a quickand-easy<br />
to use formula to<br />
identify vulnerable sandy aquifers<br />
and situations that require<br />
attention<br />
● GWPCalc be used to identify<br />
sources of contamination<br />
● One removal rate coefficient:<br />
GWPCalc can be used for any<br />
contaminant<br />
GWPCalc<br />
60<br />
Field Studies and <strong>Ground</strong>water <strong>Protection</strong> | Feb 2012<br />
GWPCalc
QUESTIONS?<br />
● GWPCalc is for free<br />
● QMRAspot@rivm.nl<br />
● Jack.Schijven@rivm.nl<br />
61 Field Studies and <strong>Ground</strong>water <strong>Protection</strong> | Feb 2012