Bulletin of the Sea Fisheries Institute 2 (153) 2001 - CEEMaR
Bulletin of the Sea Fisheries Institute 2 (153) 2001 - CEEMaR
Bulletin of the Sea Fisheries Institute 2 (153) 2001 - CEEMaR

Create successful ePaper yourself
Turn your PDF publications into a flip-book with our unique Google optimized e-Paper software.
Main phytoplankton assemblages ... 35<br />
ized methods <strong>of</strong> <strong>the</strong> Baltic Monitoring Program (Anon. 1988, Anon. 1983, Grassh<strong>of</strong>f et al.<br />
1983). Results are presented in box-and-whisker plots that were made using <strong>the</strong> STATISTICA<br />
program. Each box includes <strong>the</strong> middle 50% <strong>of</strong> <strong>the</strong> data (quartile 2 and 3) and <strong>the</strong> median is<br />
marked. The lines below and above <strong>the</strong> box, whiskers, present <strong>the</strong> range <strong>of</strong> <strong>the</strong> nonoutliers. The<br />
outliers, located above and below <strong>the</strong> box, present <strong>the</strong> data values 1.5 times greater than <strong>the</strong><br />
interquartile range (Anon. 1997).<br />
RESULTS<br />
Cluster analysis<br />
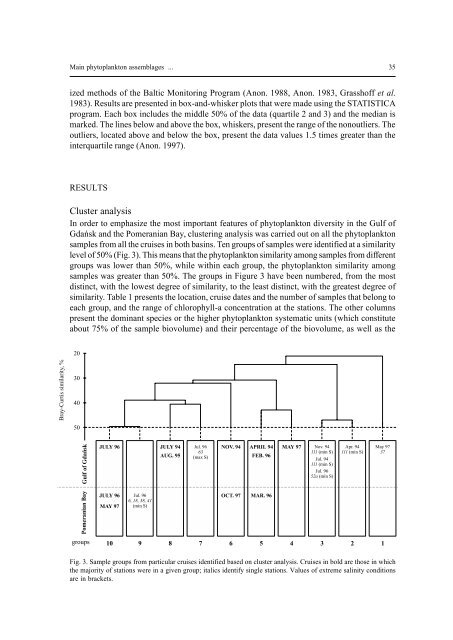
In order to emphasize <strong>the</strong> most important features <strong>of</strong> phytoplankton diversity in <strong>the</strong> Gulf <strong>of</strong><br />
Gdañsk and <strong>the</strong> Pomeranian Bay, clustering analysis was carried out on all <strong>the</strong> phytoplankton<br />
samples from all <strong>the</strong> cruises in both basins. Ten groups <strong>of</strong> samples were identified at a similarity<br />
level <strong>of</strong> 50% (ig. 3). This means that <strong>the</strong> phytoplankton similarity among samples from different<br />
groups was lower than 50%, while within each group, <strong>the</strong> phytoplankton similarity among<br />
samples was greater than 50%. The groups in igure 3 have been numbered, from <strong>the</strong> most<br />
distinct, with <strong>the</strong> lowest degree <strong>of</strong> similarity, to <strong>the</strong> least distinct, with <strong>the</strong> greatest degree <strong>of</strong><br />
similarity. Table 1 presents <strong>the</strong> location, cruise dates and <strong>the</strong> number <strong>of</strong> samples that belong to<br />
each group, and <strong>the</strong> range <strong>of</strong> chlorophyll-a concentration at <strong>the</strong> stations. The o<strong>the</strong>r columns<br />
present <strong>the</strong> dominant species or <strong>the</strong> higher phytoplankton systematic units (which constitute<br />
about 75% <strong>of</strong> <strong>the</strong> sample biovolume) and <strong>the</strong>ir percentage <strong>of</strong> <strong>the</strong> biovolume, as well as <strong>the</strong><br />
20<br />
Bray-Curtis similarity, %<br />
30<br />
40<br />
50<br />
Gulf <strong>of</strong> Gdañsk<br />
JULY 96<br />
JULY 94<br />
AUG. 95<br />
Jul. 96<br />
63<br />
(max S)<br />
NOV. 94<br />
APRIL 94 MAY 97 Nov. 94 Apr. 94 May 97<br />
111 (min S) 111 (min S) 37<br />
FEB. 96<br />
Jul. 94<br />
111 (min S)<br />
Jul. 96<br />
52a (min S)<br />
Pomeranian Bay<br />
JULY 96<br />
MAY 97<br />
Jul. 96<br />
6, 18, 38, 41<br />
(min S)<br />
OCT. 97 MAR. 96<br />
groups<br />
10<br />
9<br />
8<br />
7<br />
6<br />
5 4<br />
3<br />
2<br />
1<br />
Fig. 3. Sample groups from particular cruises identified based on cluster analysis. Cruises in bold are those in which<br />
<strong>the</strong> majority <strong>of</strong> stations were in a given group; italics identify single stations. Values <strong>of</strong> extreme salinity conditions<br />
are in brackets.