Evidence for trichromacy in the green peach aphid, Myzus persicae ...
Evidence for trichromacy in the green peach aphid, Myzus persicae ...
Evidence for trichromacy in the green peach aphid, Myzus persicae ...

Create successful ePaper yourself
Turn your PDF publications into a flip-book with our unique Google optimized e-Paper software.
1256<br />
occidentalis (Pergande) (Matteson et al.,1992),and—as<br />
<strong>the</strong> only phytophagous Homopteran species—<strong>the</strong> glasshouse<br />
whitefly, Trialeurodes vaporariorum (Westwood)<br />
(Mellor et al.,1997) have been exam<strong>in</strong>ed. Especially,<br />
<strong>the</strong>re is no data regard<strong>in</strong>g <strong>the</strong> spectral sensitivity of<br />
<strong>aphid</strong>s yet (Prokopy and Owens,1983; Gao et al.,2000;<br />
Kelber et al.,2003). There<strong>for</strong>e,<strong>the</strong> aim of this study was<br />
to apply <strong>the</strong> electroret<strong>in</strong>ogram (ERG) technique (Goldsmith<br />
and Bernard,1974; Brown and Anderson,1996;<br />
Scharste<strong>in</strong> and Stommel,1999) toM. <strong>persicae</strong> <strong>in</strong> order<br />
to contribute to a better understand<strong>in</strong>g of <strong>the</strong> spectral<br />
properties of <strong>the</strong> eye and host f<strong>in</strong>d<strong>in</strong>g of this agriculturally<br />
most important <strong>aphid</strong> species.<br />
2. Materials and methods<br />
2.1. Electroret<strong>in</strong>ogram record<strong>in</strong>gs<br />
A 100 W xenon arc lamp (Osram XBO100W/2 OFR)<br />
was used as a light source <strong>in</strong> Xe-100 lamp hous<strong>in</strong>g device<br />
(UV-Gro¨ bel,Ettl<strong>in</strong>gen,Germany). Narrow bandpass<br />
filters (10 nm half-width,from Eal<strong>in</strong>g Dav<strong>in</strong> Optronics,<br />
Wat<strong>for</strong>d,UK) provided nearly monochromatic light <strong>in</strong><br />
<strong>the</strong> wavelength range 320–640 nm <strong>in</strong> 10 nm steps.<br />
Neutral density filters (Eal<strong>in</strong>g) allowed <strong>the</strong> <strong>in</strong>tensity of<br />
light pass<strong>in</strong>g through <strong>the</strong> bandpass filters to be varied<br />
over approx. 2.5 log units. A manual shutter (T70<br />
camera,Canon) produced 0.5 s light flashes as test<br />
stimuli,which were transmitted through a 3 mm dia.<br />
liquid light guide (UV-Gro¨ bel) <strong>in</strong>to a light-proof Faraday<br />
cage. The term<strong>in</strong>al end of <strong>the</strong> light quide was fixed<br />
to a micromanipulator (Prior,Cambridge,UK) at about<br />
1.5 cm distance to <strong>the</strong> <strong>aphid</strong>’s eye.<br />
Summer migrants (w<strong>in</strong>ged virg<strong>in</strong>oparae) were reared<br />
on chili pepper plants (Capsicum annuum L.) under<br />
crowded conditions <strong>in</strong> long days (16 h light,8 h dark at<br />
20 and 16 1C,respectively) <strong>in</strong> an Environmental<br />
Incubator (Inculight 400,Schu¨ tt,Go¨ tt<strong>in</strong>gen,Germany).<br />
The <strong>aphid</strong>s were mounted on double-sided sticky tape<br />
on a 10 10 mm plat<strong>for</strong>m. Under a stereomicroscope<br />
(80 magnification,Leica S6E from Leica,Wetzlar,<br />
Germany),legs,w<strong>in</strong>gs and antennae were gently secured<br />
on <strong>the</strong> tape <strong>in</strong> order to immobilise <strong>the</strong> <strong>aphid</strong>. The<br />
record<strong>in</strong>g and <strong>in</strong>different electrodes were made from<br />
electrolytically sharpened 0.2 mm diameter tungsten<br />
wire (Goodfellow,Cambridge,UK). The record<strong>in</strong>g<br />
electrode was <strong>in</strong>serted <strong>in</strong>to <strong>the</strong> left eye through <strong>the</strong><br />
cornea and <strong>the</strong> grounded reference electrode was placed<br />
<strong>in</strong> <strong>the</strong> abdomen. Light stimuli were applied to <strong>the</strong> eye<br />
and <strong>the</strong> response was displayed on a Digital Storage<br />
Oscilloscope (HM205-3 from Hameg,Ma<strong>in</strong>hausen,<br />
Germany) via an AC amplifier equipped with low-pass<br />
(300 Hz) filters and high-pass (0.1 Hz) filters (P-55 from<br />
Grass Telefactor,West Warwick,USA). All record<strong>in</strong>gs<br />
took place at 20 1C.<br />
ARTICLE IN PRESS<br />
S.M. Kirchner et al. / Journal of Insect Physiology 51 (2005) 1255–1260<br />
2.2. Experimental protocol<br />
The optical system was calibrated at <strong>the</strong> position of<br />
<strong>the</strong> <strong>aphid</strong>’s compound eye by measur<strong>in</strong>g <strong>the</strong> emitted<br />
light <strong>for</strong> all possible comb<strong>in</strong>ations of our neutral density<br />
filters and bandpass filters with a spectrometer<br />
(RAMSES ACC,from TriOs,Osnabru¨ ck,Germany)<br />
<strong>in</strong> mW s 1 m 2 . These data were trans<strong>for</strong>med to photon<br />
flux equivalents by multiplication with <strong>the</strong> respective<br />
wavelengths.<br />
Pretests at 350,450,and 550 nm showed that<br />
<strong>in</strong>tensity–response curves followed log-l<strong>in</strong>ear functions.<br />
An appropriate criterion response was selected to ensure<br />
that over <strong>the</strong> whole wavelength range a constant<br />
response could be produced by adjust<strong>in</strong>g <strong>the</strong> light<br />
<strong>in</strong>tensity. For each wavelength,0.5 s flashes of 3–5<br />
different light <strong>in</strong>tensities were given to produce responses<br />
near <strong>the</strong> selected criterion response. The photon<br />
flux required to generate <strong>the</strong> exact criterion response<br />
was found by calculat<strong>in</strong>g l<strong>in</strong>ear regression of <strong>the</strong><br />
response values as plotted aga<strong>in</strong>st a log photon flux<br />
scale. Spectral sensitivity was calculated as 1/photon flux<br />
and values were normalised relative to <strong>the</strong> maximum<br />
sensitivity <strong>for</strong> each <strong>in</strong>dividual. A mean curve was<br />
produced from 7–9 <strong>in</strong>dividual <strong>aphid</strong>s.<br />
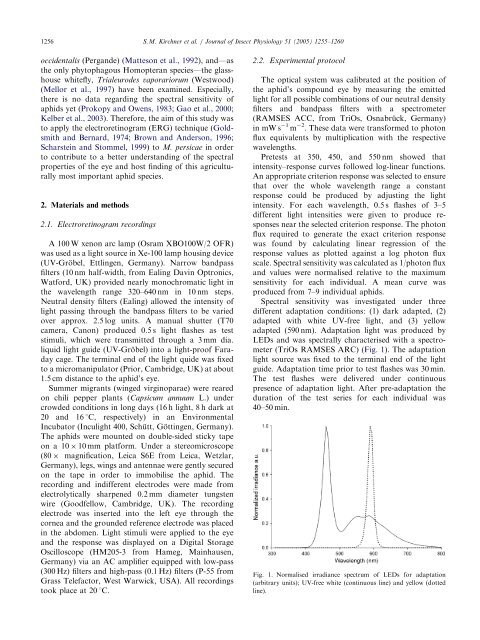
Spectral sensitivity was <strong>in</strong>vestigated under three<br />
different adaptation conditions: (1) dark adapted,(2)<br />
adapted with white UV-free light,and (3) yellow<br />
adapted (590 nm). Adaptation light was produced by<br />
LEDs and was spectrally characterised with a spectrometer<br />
(TriOs RAMSES ARC) (Fig. 1). The adaptation<br />
light source was fixed to <strong>the</strong> term<strong>in</strong>al end of <strong>the</strong> light<br />
guide. Adaptation time prior to test flashes was 30 m<strong>in</strong>.<br />
The test flashes were delivered under cont<strong>in</strong>uous<br />
presence of adaptation light. After pre-adaptation <strong>the</strong><br />
duration of <strong>the</strong> test series <strong>for</strong> each <strong>in</strong>dividual was<br />
40–50 m<strong>in</strong>.<br />
Fig. 1. Normalised irradiance spectrum of LEDs <strong>for</strong> adaptation<br />
(arbitrary units); UV-free white (cont<strong>in</strong>uous l<strong>in</strong>e) and yellow (dotted<br />
l<strong>in</strong>e).