

Effects of different sowing date and the combined effects of sowing date and seed rates on the performance of wheat (Triticum aestivum L.)/faba bean (Vicia faba L.) intercropping system
Temporal complementarity in resource use is not well understood in wheat (Triticum aestivum) /faba bean (bean; Vicia faba) intercropping system. Results from a field experiment involving this intercrop combination indicate no benefit in resource use by delaying bean sowing date (BSD), as the total intercrop (wheat + bean) seed yields were reduced with delay in BSD. Averaged across wheat seed rate, total intercrop seed yields were 586 g/m2, 490 g/m2 and 422 g/m2 for simultaneous sowing of wheat with bean, 23 days delay in BSD and 37 days delay in BSD respectively. Although wheat seed yields were greater with delay in BSD, this had lesser effects on the overall total intercrop seed yields. Conversely, bean seed yields were greater the early the beans were sown and this had substantial impact on the total intercrop yield. This indicates that bean was the main determinant of variations in intercrop productivity. Biomass yields mainly determine seed yield variation in response to BSD for both wheat and bean.
Temporal complementarity in resource use is not well understood in wheat (Triticum aestivum) /faba bean (bean; Vicia faba) intercropping system. Results from a field experiment involving this intercrop combination indicate no benefit in resource use by delaying bean sowing date (BSD), as the total intercrop (wheat + bean) seed yields were reduced with delay in BSD. Averaged across wheat seed rate, total intercrop seed yields were 586 g/m2, 490 g/m2 and 422 g/m2 for simultaneous sowing of wheat with bean, 23 days delay in BSD and 37 days delay in BSD respectively. Although wheat seed yields were greater with delay in BSD, this had lesser effects on the overall total intercrop seed yields. Conversely, bean seed yields were greater the early the beans were sown and this had substantial impact on the total intercrop yield. This indicates that bean was the main determinant of variations in intercrop productivity. Biomass yields mainly determine seed yield variation in response to BSD for both wheat and bean.

Create successful ePaper yourself
Turn your PDF publications into a flip-book with our unique Google optimized e-Paper software.
Int. J. Agr. & Agri. R.<br />
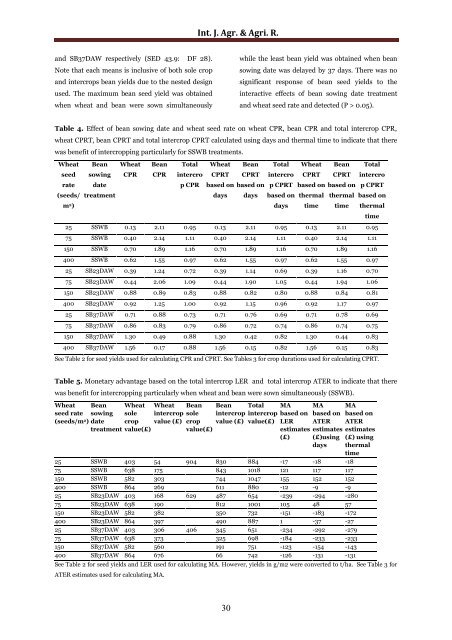
<str<strong>on</strong>g>and</str<strong>on</strong>g> SB37DAW respectively (SED 43.9: DF 28).<br />
Note that each means is inclusive <str<strong>on</strong>g>of</str<strong>on</strong>g> both sole crop<br />
<str<strong>on</strong>g>and</str<strong>on</strong>g> intercrops <strong>bean</strong> yields due to <str<strong>on</strong>g>the</str<strong>on</strong>g> nested design<br />
used. The maximum <strong>bean</strong> <str<strong>on</strong>g>seed</str<strong>on</strong>g> yield was obtained<br />
when <strong>wheat</strong> <str<strong>on</strong>g>and</str<strong>on</strong>g> <strong>bean</strong> were sown simultaneously<br />
while <str<strong>on</strong>g>the</str<strong>on</strong>g> least <strong>bean</strong> yield was obtained when <strong>bean</strong><br />
<str<strong>on</strong>g>sowing</str<strong>on</strong>g> <str<strong>on</strong>g>date</str<strong>on</strong>g> was delayed by 37 days. There was no<br />
significant resp<strong>on</strong>se <str<strong>on</strong>g>of</str<strong>on</strong>g> <strong>bean</strong> <str<strong>on</strong>g>seed</str<strong>on</strong>g> yields to <str<strong>on</strong>g>the</str<strong>on</strong>g><br />
interactive <str<strong>on</strong>g>effects</str<strong>on</strong>g> <str<strong>on</strong>g>of</str<strong>on</strong>g> <strong>bean</strong> <str<strong>on</strong>g>sowing</str<strong>on</strong>g> <str<strong>on</strong>g>date</str<strong>on</strong>g> treatment<br />
<str<strong>on</strong>g>and</str<strong>on</strong>g> <strong>wheat</strong> <str<strong>on</strong>g>seed</str<strong>on</strong>g> rate <str<strong>on</strong>g>and</str<strong>on</strong>g> detected (P > 0.05).<br />
Table 4. Effect <str<strong>on</strong>g>of</str<strong>on</strong>g> <strong>bean</strong> <str<strong>on</strong>g>sowing</str<strong>on</strong>g> <str<strong>on</strong>g>date</str<strong>on</strong>g> <str<strong>on</strong>g>and</str<strong>on</strong>g> <strong>wheat</strong> <str<strong>on</strong>g>seed</str<strong>on</strong>g> rate <strong>on</strong> <strong>wheat</strong> CPR, <strong>bean</strong> CPR <str<strong>on</strong>g>and</str<strong>on</strong>g> total intercrop CPR,<br />
<strong>wheat</strong> CPRT, <strong>bean</strong> CPRT <str<strong>on</strong>g>and</str<strong>on</strong>g> total intercrop CPRT calculated using days <str<strong>on</strong>g>and</str<strong>on</strong>g> <str<strong>on</strong>g>the</str<strong>on</strong>g>rmal time to indicate that <str<strong>on</strong>g>the</str<strong>on</strong>g>re<br />
was benefit <str<strong>on</strong>g>of</str<strong>on</strong>g> <strong>intercropping</strong> particularly for SSWB treatments.<br />
Wheat<br />
<str<strong>on</strong>g>seed</str<strong>on</strong>g><br />
rate<br />
(<str<strong>on</strong>g>seed</str<strong>on</strong>g>s/<br />
m 2 )<br />
Bean Wheat<br />
<str<strong>on</strong>g>sowing</str<strong>on</strong>g> CPR<br />
<str<strong>on</strong>g>date</str<strong>on</strong>g><br />
treatment<br />
Bean Total<br />
CPR intercro<br />
p CPR<br />
Wheat<br />
CPRT<br />
Bean<br />
CPRT<br />
Total<br />
intercro<br />
Wheat<br />
CPRT<br />
Bean<br />
CPRT<br />
Total<br />
intercro<br />
based <strong>on</strong> based <strong>on</strong> p CPRT based <strong>on</strong> based <strong>on</strong> p CPRT<br />
days days based <strong>on</strong> <str<strong>on</strong>g>the</str<strong>on</strong>g>rmal <str<strong>on</strong>g>the</str<strong>on</strong>g>rmal based <strong>on</strong><br />
days time time <str<strong>on</strong>g>the</str<strong>on</strong>g>rmal<br />
time<br />
25 SSWB 0.13 2.11 0.95 0.13 2.11 0.95 0.13 2.11 0.95<br />
75 SSWB 0.40 2.14 1.11 0.40 2.14 1.11 0.40 2.14 1.11<br />
150 SSWB 0.70 1.89 1.16 0.70 1.89 1.16 0.70 1.89 1.16<br />
400 SSWB 0.62 1.55 0.97 0.62 1.55 0.97 0.62 1.55 0.97<br />
25 SB23DAW 0.39 1.24 0.72 0.39 1.14 0.69 0.39 1.16 0.70<br />
75 SB23DAW 0.44 2.06 1.09 0.44 1.90 1.05 0.44 1.94 1.06<br />
150 SB23DAW 0.88 0.89 0.83 0.88 0.82 0.80 0.88 0.84 0.81<br />
400 SB23DAW 0.92 1.25 1.00 0.92 1.15 0.96 0.92 1.17 0.97<br />
25 SB37DAW 0.71 0.88 0.73 0.71 0.76 0.69 0.71 0.78 0.69<br />
75 SB37DAW 0.86 0.83 0.79 0.86 0.72 0.74 0.86 0.74 0.75<br />
150 SB37DAW 1.30 0.49 0.88 1.30 0.42 0.82 1.30 0.44 0.83<br />
400 SB37DAW 1.56 0.17 0.88 1.56 0.15 0.82 1.56 0.15 0.83<br />
See Table 2 for <str<strong>on</strong>g>seed</str<strong>on</strong>g> yields used for calculating CPR <str<strong>on</strong>g>and</str<strong>on</strong>g> CPRT. See Tables 3 for crop durati<strong>on</strong>s used for calculating CPRT.<br />
Table 5. M<strong>on</strong>etary advantage based <strong>on</strong> <str<strong>on</strong>g>the</str<strong>on</strong>g> total intercrop LER <str<strong>on</strong>g>and</str<strong>on</strong>g> total intercrop ATER to indicate that <str<strong>on</strong>g>the</str<strong>on</strong>g>re<br />
was benefit for <strong>intercropping</strong> particularly when <strong>wheat</strong> <str<strong>on</strong>g>and</str<strong>on</strong>g> <strong>bean</strong> were sown simultaneously (SSWB).<br />
Wheat<br />
<str<strong>on</strong>g>seed</str<strong>on</strong>g> rate<br />
(<str<strong>on</strong>g>seed</str<strong>on</strong>g>s/m 2 )<br />
Bean<br />
<str<strong>on</strong>g>sowing</str<strong>on</strong>g><br />
<str<strong>on</strong>g>date</str<strong>on</strong>g><br />
treatment<br />
Wheat Wheat<br />
sole intercrop<br />
crop value (£)<br />
value(£)<br />
Bean Bean Total MA MA<br />
sole intercrop intercrop based <strong>on</strong><br />
crop<br />
value(£)<br />
value (£) value(£) LER<br />
estimates<br />
(£)<br />
based <strong>on</strong><br />
ATER<br />
estimates<br />
(£)using<br />
days<br />
25 SSWB 403 54 904 830 884 -17 -18 -18<br />
75 SSWB 638 175 843 1018 121 117 117<br />
150 SSWB 582 303 744 1047 155 152 152<br />
400 SSWB 864 269 611 880 -12 -9 -9<br />
25 SB23DAW 403 168 629 487 654 -239 -294 -280<br />
75 SB23DAW 638 190 812 1001 105 48 57<br />
150 SB23DAW 582 382 350 732 -151 -183 -172<br />
400 SB23DAW 864 397 490 887 1 -37 -27<br />
25 SB37DAW 403 306 406 345 651 -234 -292 -279<br />
75 SB37DAW 638 373 325 698 -184 -233 -233<br />
150 SB37DAW 582 560 191 751 -123 -154 -143<br />
400 SB37DAW 864 676 66 742 -126 -131 -131<br />
MA<br />
based <strong>on</strong><br />
ATER<br />
estimates<br />
(£) using<br />
<str<strong>on</strong>g>the</str<strong>on</strong>g>rmal<br />
time<br />
See Table 2 for <str<strong>on</strong>g>seed</str<strong>on</strong>g> yields <str<strong>on</strong>g>and</str<strong>on</strong>g> LER used for calculating MA. However, yields in g/m2 were c<strong>on</strong>verted to t/ha. See Table 3 for<br />
ATER estimates used for calculating MA.<br />
30


