Second Quarter 2012 Shareholder Letter - Technology Partners
Second Quarter 2012 Shareholder Letter - Technology Partners
Second Quarter 2012 Shareholder Letter - Technology Partners

You also want an ePaper? Increase the reach of your titles
YUMPU automatically turns print PDFs into web optimized ePapers that Google loves.
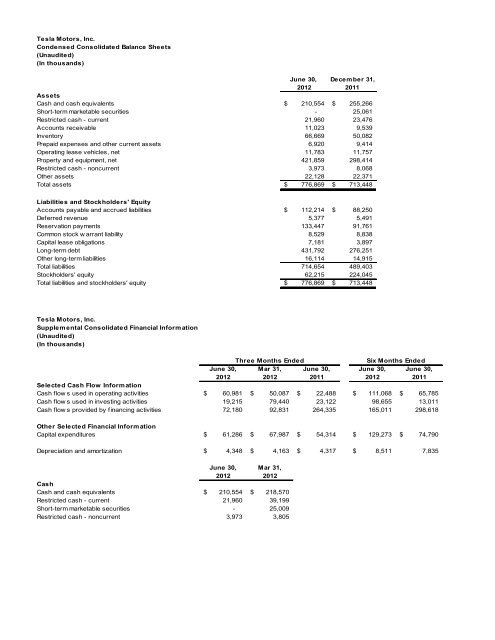
Tesla Motors, Inc.<br />
Condensed Consolidated Balance Sheets<br />
(Unaudited)<br />
(In thousands)<br />
June 30, December 31,<br />
<strong>2012</strong> 2011<br />
Assets<br />
Cash and cash equivalents $ 210,554 $ 255,266<br />
Short-term marketable securities - 25,061<br />
Restricted cash - current 21,960 23,476<br />
Accounts receivable 11,023 9,539<br />
Inventory 66,669 50,082<br />
Prepaid expenses and other current assets 6,920 9,414<br />
Operating lease vehicles, net 11,783 11,757<br />
Property and equipment, net 421,859 298,414<br />
Restricted cash - noncurrent 3,973 8,068<br />
Other assets 22,128 22,371<br />
Total assets $ 776,869 $ 713,448<br />
Liabilities and Stockholders' Equity<br />
Accounts payable and accrued liabilities $ 112,214 $ 88,250<br />
Deferred revenue 5,377 5,491<br />
Reservation payments 133,447 91,761<br />
Common stock w arrant liability 8,529 8,838<br />
Capital lease obligations 7,181 3,897<br />
Long-term debt 431,792 276,251<br />
Other long-term liabilities 16,114 14,915<br />
Total liabilities 714,654 489,403<br />
Stockholders' equity 62,215 224,045<br />
Total liabilities and stockholders' equity $ 776,869 $ 713,448<br />
Tesla Motors, Inc.<br />
Supplemental Consolidated Financial Information<br />
(Unaudited)<br />
(In thousands)<br />
June 30,<br />
<strong>2012</strong><br />
Three Months Ended<br />
Mar 31,<br />
<strong>2012</strong><br />
June 30,<br />
2011<br />
June 30,<br />
<strong>2012</strong><br />
June 30,<br />
2011<br />
Selected Cash Flow Information<br />
Cash flow s used in operating activities $ 60,981 $ 50,087 $ 22,488 $ 111,068 $ 65,785<br />
Cash flow s used in investing activities 19,215 79,440 23,122 98,655 13,011<br />
Cash flow s provided by financing activities<br />
72,180 92,831 264,335 165,011 298,618<br />
Other Selected Financial Information<br />
Capital expenditures $ 61,286 $ 67,987 $ 54,314 $ 129,273 $ 74,790<br />
Depreciation and amortization $ 4,348 $ 4,163 $ 4,317 $ 8,511 7,835<br />
June 30,<br />
<strong>2012</strong><br />
Mar 31,<br />
<strong>2012</strong><br />
Cash<br />
Cash and cash equivalents $ 210,554 $ 218,570<br />
Restricted cash - current 21,960 39,199<br />
Short-term marketable securities - 25,009<br />
Restricted cash - noncurrent 3,973 3,805<br />
Six Months Ended