Second Quarter 2012 Shareholder Letter - Technology Partners
Second Quarter 2012 Shareholder Letter - Technology Partners
Second Quarter 2012 Shareholder Letter - Technology Partners

Create successful ePaper yourself
Turn your PDF publications into a flip-book with our unique Google optimized e-Paper software.
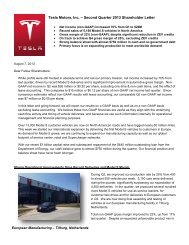
Tesla Motors, Inc.<br />
Reconciliation of GAAP to Non-GAAP Financial Information<br />
(Unaudited)<br />
(In thousands, except per share data)<br />
June 30,<br />
<strong>2012</strong><br />
Three Months Ended<br />
Mar 31,<br />
<strong>2012</strong><br />
June 30,<br />
2011<br />
Six Months Ended<br />
June 30,<br />
<strong>2012</strong><br />
June 30,<br />
2011<br />
Research and development expenses<br />
(GAAP) $ 74,854 $ 68,391 $ 52,531 $ 143,245 $ 93,693<br />
Stock-based compensation expense (7,133) (5,932) (3,018) (13,065) (5,317)<br />
Research and development expenses<br />
(Non-GAAP)<br />
$ 67,721 $ 62,459 $ 49,513 $ 130,180 $ 88,376<br />
Selling, general and administrative<br />
expenses (GAAP) $ 36,083 $ 30,582 $ 24,716 $ 66,665 $ 48,928<br />
Stock-based compensation expense (5,332) (4,772) (3,727) (10,104) (7,200)<br />
Selling, general and administrative<br />
expenses (Non-GAAP)<br />
$ 30,751 $ 25,810 $ 20,989 $ 56,561 $ 41,728<br />
Net loss (GAAP) $ (105,603) $ (89,873) $ (58,903) $ (195,476) $ (107,844)<br />
Stock-based compensation expense 12,543 10,711 6,926 23,254 12,852<br />
Change in fair value of w arrant liability (154) (155) 340 (309) 1,761<br />
Net loss (Non-GAAP) $ (93,214) $ (79,317) $ (51,637) $ (172,531) $ (93,231)<br />
Net loss per common share, basic and<br />
diluted (GAAP)<br />
$ (1.00) $ (0.86) $ (0.60) $ (1.86) $ (1.12)<br />
Stock-based compensation expense $ 0.11<br />
0.10 0.07 0.22 0.13<br />
Change in fair value of w arrant liability $ (0.00) (0.00) 0.00 (0.00) 0.02<br />
Net loss per common share, basic and<br />
diluted (Non-GAAP)<br />
$ (0.89) $ (0.76) $ (0.53) $ (1.64) $ (0.97)<br />
Shares used in per share calculation,<br />
basic and diluted (GAAP and Non-GAAP) 105,242 104,784 97,757 105,013 96,478<br />
Non-GAAP Financial Information<br />
Consolidated financial information has been presented in accordance w ith GAAP as w ell as on a non-GAAP basis. On a non-GAAP<br />
basis, financial measures exclude non-cash items such as stock-based compensation as w ell as the change in fair value related to<br />
Tesla’s w arrant liability. Management believes that it is useful to supplement its GAAP financial statements w ith this non-GAAP<br />
information because management uses such information internally for its operating, budgeting and financial planning purposes. These<br />
non-GAAP financial measures also facilitate management’s internal comparisons to Tesla’s historical performance as w ell as<br />
comparisons to the operating results of other companies. Non-GAAP information is not prepared under a comprehensive set of<br />
accounting rules and therefore, should only be read in conjunction w ith financial information reported under U.S. GAAP w hen<br />
understanding Tesla's operating performance. A reconciliation betw een GAAP and non-GAAP financial information is provided above.