Stateline Wind Project Wildlife Monitoring Final Report - WEST, Inc.
Stateline Wind Project Wildlife Monitoring Final Report - WEST, Inc.
Stateline Wind Project Wildlife Monitoring Final Report - WEST, Inc.

You also want an ePaper? Increase the reach of your titles
YUMPU automatically turns print PDFs into web optimized ePapers that Google loves.
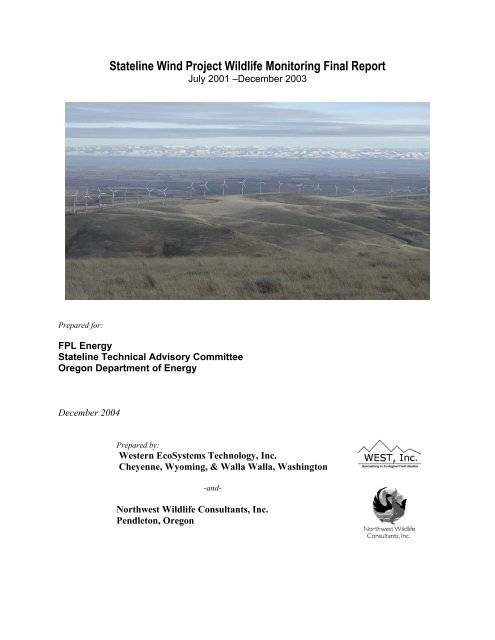
<strong>Stateline</strong> <strong>Wind</strong> <strong>Project</strong> <strong>Wildlife</strong> <strong>Monitoring</strong> <strong>Final</strong> <strong>Report</strong><br />
July 2001 –December 2003<br />
Prepared for:<br />
FPL Energy<br />
<strong>Stateline</strong> Technical Advisory Committee<br />
Oregon Department of Energy<br />
December 2004<br />
Prepared by:<br />
Western EcoSystems Technology, <strong>Inc</strong>.<br />
Cheyenne, Wyoming, & Walla Walla, Washington<br />
-and-<br />
Northwest <strong>Wildlife</strong> Consultants, <strong>Inc</strong>.<br />
Pendleton, Oregon
Table of Contents<br />
1.0 INTRODUCTION ................................................................................................................... 1<br />
2.0 STUDY AREA AND PROJECT DESCRIPTION.................................................................. 3<br />
3.0 METHODS .............................................................................................................................. 3<br />
3.1 Seasons................................................................................................................................. 4<br />
3.2 Avian and Bat Fatality Study...............................................................................................4<br />
3.2.1 Standardized Search Plots............................................................................................. 4<br />
3.2.1.1 Standardized Carcass Search Sampling Design, 2001-2002............................... 4<br />
3.2.1.2 Standardized Carcass Search Sampling Design, 2003 ........................................ 5<br />
3.2.2 Standardized Searches .................................................................................................. 5<br />
3.2.3 Observer Detection Bias Experimental Trials .............................................................. 6<br />
3.2.4 Carcass Removal Bias Experimental Trials.................................................................. 6<br />
3.2.5 Statistical Methods for Fatality Estimates .................................................................... 7<br />
3.2.5.1 Definition of Variables ........................................................................................ 7<br />
3.2.5.2 Observed Number of Carcasses........................................................................... 8<br />
3.2.5.3 Estimation of Carcass Removal........................................................................... 8<br />
3.2.5.4 Estimation of Observer Detection Rates ............................................................. 8<br />
3.2.5.5 Estimation of Facility-Related Fatality Rates...................................................... 8<br />
3.2.6 <strong>Wildlife</strong> Response and <strong>Report</strong>ing System (WRRS) ..................................................... 9<br />
3.3 Avian Use Surveys and <strong>Inc</strong>idental <strong>Wildlife</strong> Observations .................................................. 9<br />
3.4 Raptor Nest Surveys .......................................................................................................... 10<br />
3.5 Burrowing Owl Surveys .................................................................................................... 10<br />
3.6 Short-eared Owl Surveys ................................................................................................... 11<br />
3.7 Grassland Bird Displacement Surveys............................................................................... 11<br />
3.8 <strong>Inc</strong>idental <strong>Wildlife</strong> Observations ....................................................................................... 12<br />
4.0 RESULTS .............................................................................................................................. 12<br />
4.1 Bird Casualty Finds............................................................................................................ 12<br />
4.2 Bat Casualty Finds ............................................................................................................. 14<br />
4.3 WRRS Casualty Finds ....................................................................................................... 14<br />
4.3.1 Birds............................................................................................................................ 14<br />
4.3.2 Bats ............................................................................................................................. 15<br />
4.4 Observer Detection Bias Experimental Trials ................................................................... 15<br />
4.5 Carcass Removal Bias Experimental Trials....................................................................... 15<br />
4.6 Fatality Estimates............................................................................................................... 16<br />
4.6.1 Small Birds.................................................................................................................. 16<br />
4.6.2 Large Birds.................................................................................................................. 16<br />
4.6.3 All Birds...................................................................................................................... 16<br />
4.6.4 Raptors ........................................................................................................................ 17<br />
4.6.5 Grassland Birds........................................................................................................... 17<br />
4.6.6 Nocturnal Migrants ..................................................................................................... 17<br />
4.6.7 Bats ............................................................................................................................. 17<br />
4.7 Lighting Effects and Other Analyses................................................................................. 18<br />
4.8 Avian Use Surveys............................................................................................................. 18<br />
4.8.1 Avian Use and Frequency of Occurrence by Species................................................. 18<br />
4.8.2 Avian Use by Seasons and Groups ............................................................................. 19<br />
<strong>Stateline</strong> <strong>Monitoring</strong> <strong>Final</strong> <strong>Report</strong> i<br />
December 2004
4.9 <strong>Inc</strong>idental Wildife Observations ........................................................................................ 19<br />
4.10 Raptor Nest Surveys ........................................................................................................ 19<br />
4.11 Burrowing Owl Surveys .................................................................................................. 21<br />
4.12 Short-eared Owl Surveys ................................................................................................. 22<br />
4.13 Grassland Bird Displacement Surveys............................................................................. 22<br />
5.0 SUMMARY/DISCUSSION .................................................................................................. 24<br />
5.1 Assumptions....................................................................................................................... 24<br />
5.2 Bird Fatality Estimates....................................................................................................... 26<br />
5.3 Relative Risk of Collision and Species Impacts ............................................................... 26<br />
5.4 Raptor Fatalities................................................................................................................. 28<br />
5.5 Nocturnal Migrants and Lighting....................................................................................... 29<br />
5.6 Grassland Bird Displacement ............................................................................................ 30<br />
5.7 Raptor Nesting and Owl Use ............................................................................................. 30<br />
5.8 Bat Fatality Estimates ........................................................................................................ 30<br />
5.9 Additional <strong>Monitoring</strong> ....................................................................................................... 31<br />
6.0 ACKNOWLEDGEMENTS................................................................................................... 31<br />
7.0 REFERENCES ...................................................................................................................... 32<br />
List of Appendices<br />
APPENDIX A-1 - List of Washington turbines sampled during the standardized searches from<br />
July 2001 through December 2002................................................................................. 79<br />
APPENDIX A-2 - List of Oregon turbines sampled during the standardized searches from<br />
January through December 2002.................................................................................... 80<br />
APPENDIX A-3 - List of Washington turbines sampled during the standardized searches from<br />
January through December 2003.................................................................................... 81<br />
APPENDIX A-4 - List of Oregon turbines sampled during the standardized searches from<br />
January through December 2003.................................................................................... 82<br />
APPENDIX B-1 - List of standardized search plots surveyed and effort from July through<br />
December 2001 in Washington. ..................................................................................... 83<br />
APPENDIX B-2 - List of standardized search plots surveyed and effort from January through<br />
December 2002............................................................................................................... 84<br />
APPENDIX B-3 - List of standardized search plots surveyed and effort from January through<br />
December 2003............................................................................................................... 85<br />
APPENDIX C-1 - List of Oregon and Washington turbines sampled during the WRRS protocol<br />
searches from January through December 2002. ........................................................... 86<br />
APPENDIX C-2 - List of Oregon and Washington turbines sampled during the WRRS protocol<br />
searches from January through December 2003. ........................................................... 87<br />
APPENDIX D-1 - List of avian fatalities observed on standardized search plots in Oregon from<br />
January 2002 through December 2003........................................................................... 88<br />
APPENDIX D-2 - List of avian fatalities observed standardized search plots in Washington from<br />
July 2001 through December 2003................................................................................. 91<br />
APPENDIX D-3 - WRRS protocol and incidental avian fatality discoveries from July 2001<br />
through December 2003 that were not observed on standardized search plots.............. 93<br />
APPENDIX E-1 - List of bat fatalities found on standardized search plots in Oregon from<br />
January 2002 through December 2003........................................................................... 94<br />
<strong>Stateline</strong> <strong>Monitoring</strong> <strong>Final</strong> <strong>Report</strong> ii<br />
December 2004
APPENDIX E-2 - List of bat fatalities found on standardized search plots in Washington from<br />
July 2001 through December 2003................................................................................. 96<br />
APPENDIX E-3 - WRRS protocol and incidental bat fatality discoveries that were not observed<br />
on standardized search plots from July 2001 through December 2003.......................... 98<br />
List of Tables<br />
Table 1. Total effort for standardized search plots surveys from July 2001 through December<br />
2003. ............................................................................................................................... 36<br />
Table 2. List of turbines and number of avian fatalities observed in standardized search plots<br />
from July 2001 through December 2003........................................................................ 37<br />
Table 3. Summary of avian fatality composition based on fatalities observed in standardized<br />
search plots from July 2001 through December 2003.................................................... 38<br />
Table 4. Summary of bat fatality composition based on fatalities observed in standardized<br />
search plots from July 2001 through December 31, 2003.............................................. 39<br />
Table 5. List of turbines and number of bat fatalities observed in standardized search plots from<br />
July 2001 through December 2003................................................................................. 40<br />
Table 6. Results of observer detection trials conducted July 2001 through December 2003...... 41<br />
Table 7. Results of carcass removal trials conducted July 2001 through December 2003.......... 42<br />
Table 8. Annual fatality rate estimates based on <strong>Stateline</strong> monitoring in 2002 and 2003........... 43<br />
Table 9. List of avian species observed during fixed-point surveys (July 2001 through December<br />
2003)............................................................................................................................... 44<br />
Table 10. Bird observations and groups recorded during avian use surveys conducted July 2001<br />
through December 2003. ................................................................................................ 45<br />
Table 11. Mean use (#/survey) and % frequency of occurrence (% of surveys where species was<br />
observed) by year conducted July 2001 through December 2003. ................................ 48<br />
Table 12. Avian and mammal observations and groups recorded incidentally between avian use<br />
surveys conducted July 2001 through December 2003.................................................. 50<br />
Table 13. Summary of number of active buteo nests within 5 miles of <strong>Stateline</strong> 1 turbines and<br />
number of active and successful buteo nests within 2 miles of <strong>Stateline</strong> 1 and 2 turbines.<br />
........................................................................................................................................ 51<br />
Table 14. Ferruginous hawk and Swainson’s hawk nesting data for nests active in 2001, 2002, or<br />
2003 that were located within 2 miles of <strong>Stateline</strong> 1 or 2 turbines. ............................... 52<br />
Table 15. Burrowing owl locations discovered and monitored during the <strong>Stateline</strong> <strong>Monitoring</strong><br />
Study 2002-2003. ........................................................................................................... 53<br />
Table 16. Mean index of bird density for pre- and post- construction and the differences.<br />
Standard errors and 90% confidence intervals for the difference based on each year of<br />
surveys (pre-construction surveys in 2001, post-construction surveys in 2002)............ 54<br />
Table 17. Mean index of bird density for pre- and post- construction and the differences.<br />
Standard errors and 90% confidence intervals for the difference by sub-segment based<br />
on each year of surveys (pre-construction surveys in 2001, post-construction surveys in<br />
2002)............................................................................................................................... 55<br />
<strong>Stateline</strong> <strong>Monitoring</strong> <strong>Final</strong> <strong>Report</strong> iii<br />
December 2004
List of Figures<br />
Figure 1. Location of 2002 and 2003 standardized carcass search plots..................................... 56<br />
Figure 2. Diagram of the dimensions and components of the <strong>Stateline</strong> <strong>Wind</strong> Turbines. ............ 57<br />
Figure 3. Example carcass search plot HGA 7-9 including dimensions...................................... 58<br />
Figure 4. Distribution of distances from turbines to casualties for birds and bats found from July<br />
2001 - December 2003. .................................................................................................. 59<br />
Figure 5. The percent of fatalities for avian species and taxonomic groups (July 2001 –<br />
December 2003). ............................................................................................................ 60<br />
Figure 6. Distribution of all bird and raptor fatalities by month for each year (Jan 2002 –<br />
December 2003). ............................................................................................................ 61<br />
Figure 7. Distribution of bird fatalities in the <strong>Stateline</strong> <strong>Wind</strong> <strong>Project</strong> (July 2001 - December<br />
2003)............................................................................................................................... 62<br />
Figure 8. Distribution of raptor fatalities in the <strong>Stateline</strong> <strong>Wind</strong> <strong>Project</strong> (July 2001 – December<br />
2003)............................................................................................................................... 63<br />
Figure 9. The percent of fatalities for bat species (July 2001 - December 2003)........................ 64<br />
Figure 10. Distribution of bat fatalities in the <strong>Stateline</strong> <strong>Wind</strong> <strong>Project</strong> (July 2001 - December<br />
2003)............................................................................................................................... 65<br />
Figure 11. Distribution of bat fatalities by month for each year and combined years (January<br />
2002 – December 2003). ................................................................................................ 66<br />
Figure 12. Results of avian carcass removal trials conducted July 2001 - December 2003........ 68<br />
Figure 13. Results of bat carcass removal trial conducted fall 2003. .......................................... 69<br />
Figure 14. Annual and overall fatality estimates (#/turbine/year adjusted for biases) for<br />
taxonomic and size classes of birds (January 2002 - December 2003).......................... 70<br />
Figure 15. Observed nocturnal migrant and bat fatality rates (#/turbine/year) for lit turbines “L”,<br />
unlit but adjacent to lit turbines “A”, and unlit turbines not adjacent to lit turbines “N”<br />
(January 2002 -December 2003). ................................................................................... 71<br />
Figure 16. Observed fatality rates (#/turbine/year) by turbine string in 2002 and 2003. ............ 72<br />
Figure 17. The percent composition of avian use for avian species and taxonomic groups (July<br />
2001 - December 2003).................................................................................................. 73<br />
Figure 18. Avian use (#/10-minute survey) by season for taxonomic groups for entire study<br />
period (July 2001 - December 2003).............................................................................. 74<br />
Figure 19. Differences in mean use (post-construction [2002] minus pre-construction [2001])<br />
and 90% confidence intervals for grassland birds combined and for grasshopper<br />
sparrows. Subsegment 1: 0 – 50 m from turbine string; 2: 51-100 m; 3: 101-150 m; 4:<br />
151-200 m; 5: 201-250 m; 6: 251-300 m. Confidence intervals that do not overlap the<br />
value 0 indicate statistically significant effects.............................................................. 75<br />
Figure 20. Differences in mean use (post-construction [2002] minus pre-construction [2001])<br />
and 90% confidence intervals for horned lark and western meadowlark. Subsegment 1:<br />
0– 50 m from turbine string; 2: 51-100 m; 3: 101-150 m; 4: 151-200 m; 5: 201-250 m;<br />
6: 251-300 m. Confidence intervals that do not overlap the value 0 indicate statistically<br />
significant effects............................................................................................................ 76<br />
Figure 21. Standardized bird fatality estimates from new generation wind projects in the U.S.<br />
We only included studies that provided estimates adjusted for scavenging and searcher<br />
efficiency and that were conducted for a minimum of 1 year. Mean estimate weighted<br />
by MW of individual projects......................................................................................... 77<br />
<strong>Stateline</strong> <strong>Monitoring</strong> <strong>Final</strong> <strong>Report</strong> iv<br />
December 2004
Figure 22. Standardized bat fatality estimates from new generation wind projects in the U.S.<br />
We only included studies that provided estimates adjusted for scavenging and searcher<br />
efficiency and that were conducted for a minimum of 1 year. Mean estimate weighted<br />
by MW of individual projects......................................................................................... 78<br />
<strong>Stateline</strong> <strong>Monitoring</strong> <strong>Final</strong> <strong>Report</strong> v<br />
December 2004
PARTICIPANTS<br />
Personnel Duties<br />
Western EcoSystems Technology<br />
Wallace Erickson <strong>Project</strong> Manager, Statistician<br />
Jay Jeffrey Field <strong>Project</strong> Manager and <strong>Project</strong> Biologist<br />
Kimberly Bay Data Technician<br />
Jamey P. Eddy Data Technician and Trial Bird Provider<br />
Michael Diamond Field Technician<br />
Scott Downs Team Leader and Field Technician<br />
Nicolas Griffin Team Leader and Field Technician<br />
Sonja Lapinski Field Technician<br />
Sean Morrison Field Technician<br />
Douglas Shepherd Field Biologist<br />
Whitney Warren Team Leader and Field Technician<br />
Northwest <strong>Wildlife</strong> Consultants <strong>Inc</strong>.<br />
Karen Kronner TAC Coordinator, <strong>Project</strong> Biologist, Field <strong>Project</strong> Manager for NWC<br />
Bob Gritski Team Leader, Field Supervisor and Field Biologist<br />
Jerry Baker Team Leader and Field Technician<br />
Cory Cooley Field Biologist<br />
Riley Hall Field Technician<br />
Jane Holmes Field Technician<br />
Julie Miller Field Technician<br />
Laurie Ness Field Biologist<br />
Michele Talley Field Biologist<br />
Cindy Wood Field Technician<br />
Cliff Hoeft Contractor Pilot<br />
<strong>Report</strong> Reference:<br />
Erickson, W.P., J. Jeffrey, K. Kronner, and K. Bay. 2004. <strong>Stateline</strong> <strong>Wind</strong> <strong>Project</strong> <strong>Wildlife</strong><br />
<strong>Monitoring</strong> <strong>Final</strong> <strong>Report</strong>, July 2001 – December 2003. Technical report peer-reviewed<br />
by and submitted to FPL Energy, the Oregon Energy Facility Siting Council, and the<br />
<strong>Stateline</strong> Technical Advisory Committee.<br />
<strong>Stateline</strong> <strong>Monitoring</strong> <strong>Final</strong> <strong>Report</strong> vi<br />
December 2004
1.0 INTRODUCTION<br />
This report contains comprehensive results of the avian and bat monitoring program conducted at<br />
the <strong>Stateline</strong> <strong>Wind</strong> <strong>Project</strong>. Data and results are representative of the Oregon and Washington<br />
facilities. Data were collected during the monitoring period: July 2001 through December 2003.<br />
The <strong>Stateline</strong> <strong>Wind</strong> <strong>Project</strong> was developed, constructed, and is operated by FPL Energy<br />
Vansycle LLC (FPL Energy). It is located in Umatilla County, Oregon and Walla Walla County,<br />
Washington, and was built in multiple phases between the years 2001 and 2002.<br />
The Washington facilities were studied in 1994, 1995, 1999-2001 and analyzed and permitted in<br />
2000 and 2001 under the Walla Walla County conditional use permit process. Subsequently, 273<br />
wind turbine generators (Vestas V47 660-kilowatt [kW]), capable of producing approximately<br />
180 megawatts (MW) were constructed in 2001 (referred to as Washington <strong>Stateline</strong> 1 area). At<br />
the same time, underground collector cables, a substation, and transmission lines that deliver<br />
power to the western power grid system were constructed in Washington. In 2002, FPL Energy<br />
submitted an application and required environmental analysis data to amend the Walla Walla<br />
County Conditional Use Permit to enable the construction of an additional 29 turbines (FPL<br />
Energy et al. 2002), which were not constructed during the timeframe of the monitoring studies<br />
reported in this document.<br />
The Oregon facilities were studied in 1994, 1995, 1999-2001 and initially analyzed and<br />
permitted in 2001 using the Oregon Energy Facility Siting Council (OEFSC) site certificate<br />
process administered by the Oregon Department of Energy (ODOE). Subsequently, 126 wind<br />
turbine generators (Vestas V47 660-kW), capable of producing approximately 83 MW were<br />
constructed in 2001 and are located in the Oregon <strong>Stateline</strong> 1 area. Upon completion, FPL<br />
Energy submitted an application to amend the <strong>Stateline</strong> <strong>Wind</strong> <strong>Project</strong> site certificate, requesting<br />
authorization to construct an additional 60 wind turbine generators. In 2002, the <strong>Stateline</strong> <strong>Wind</strong><br />
<strong>Project</strong> site certificate amendment (Amendment #1) was granted by OEFSC and FPL Energy<br />
constructed 55 of the 60 authorized wind turbine generators. These 60 turbines are referred to as<br />
the Oregon <strong>Stateline</strong> 2 area. A third phase of expansion was permitted and authorized in Oregon<br />
in 2003. This project permit was the second amendment (Amendment #2) of the <strong>Stateline</strong> <strong>Wind</strong><br />
<strong>Project</strong> site certificate and is referred to as the <strong>Stateline</strong> 3 area. The remaining 5 turbines<br />
approved within the Oregon <strong>Stateline</strong> 2 area as well as the turbines in the <strong>Stateline</strong> 3 area had not<br />
been constructed during the time frame of the monitoring studies reported in this document.<br />
Each permitting agency required specific pre-construction studies and impact analyses to meet<br />
their standards. There was general consistency among the agencies. The primary objective in<br />
the Washington TAC monitoring plan (WWMP) was to “estimate the number of avian and bat<br />
fatalities attributable to wind turbine collisions for the entire <strong>Project</strong> on an annual basis". The<br />
primary objectives in the Oregon <strong>Wildlife</strong> <strong>Monitoring</strong> Plan (OWMP) were to “determine<br />
whether the facility causes significant fatalities of birds and bats and to determine whether the<br />
facility results in a loss of habitat quality".<br />
<strong>Stateline</strong> <strong>Monitoring</strong> <strong>Final</strong> <strong>Report</strong> 1<br />
December 2004
Operational monitoring requirements for wildlife varied slightly in the two plans. However,<br />
most components of the monitoring program were conducted in both states including:<br />
• Standardized Carcass Searches (OWMP and WWMP requirement)<br />
• Protocol searches and <strong>Inc</strong>idental Injured Animal/Fatality Discoveries, otherwise described as<br />
the <strong>Wildlife</strong> Response and <strong>Report</strong>ing System (OWMP and WWMP requirement)<br />
• Carcass Removal Bias Experimental Trials (OWMP and WWMP requirement)<br />
• Observer Detection Bias Experimental Trials (OWMP and WWMP requirement)<br />
• Avian Use Surveys (OWMP and WWMP requirement)<br />
• Burrowing Owl Surveys (OWMP and WWMP requirement)<br />
• Short-eared Owl Surveys (WWMP requirement)<br />
• Raptor Nest Surveys (OWMP and WWMP requirement)<br />
The OWMP had an additional monitoring component that was conducted in Oregon only:<br />
• Grassland <strong>Monitoring</strong> Transect Surveys (OWMP requirement)<br />
As of December 31, 2003, wildlife monitoring studies in Washington were completed. The<br />
Walla Walla County Community Development Department, formerly Regional Planning<br />
Department, has accepted the Technical Advisory Committee’s 1 (TAC) recommendations that<br />
the monitoring effort has fulfilled FPL Energy’s permit requirements. However, the TAC<br />
remains operative and receives monitoring results collected from the <strong>Stateline</strong> <strong>Wind</strong> <strong>Project</strong> on<br />
an annual basis. In Oregon, this report is being submitted to the ODOE for compliance with the<br />
conditions in the <strong>Stateline</strong> <strong>Wind</strong> <strong>Project</strong> site certificate. Some components of the study<br />
described in this document for the existing turbines are ongoing, including the <strong>Wildlife</strong> Response<br />
and <strong>Report</strong>ing System (WRRS) for documentation and reporting of incidentally discovered<br />
injured animal and bird and bat fatalities, grassland bird displacement studies, and raptor nest<br />
monitoring studies. If additional turbines are built, additional monitoring studies will be required<br />
(OEFSC 2003). This monitoring report does not include detailed information about previously<br />
implemented and ongoing mitigation. Mitigation is discussed in various permit documents<br />
administered by the OEFSC and the Walla Walla County Regional Planning Department. For<br />
example, some potential turbine locations in saddles of ridges were dropped from consideration<br />
due to higher avian collision risk. In addition, habitat improvement projects are underway that<br />
will enhance or expand grassland habitat for a variety of wildlife. Temporarily disturbed habitat<br />
resulting from construction is being restored and weeds are being controlled.<br />
1 TAC is a Committee formed to oversee the wildlife monitoring program and to advise Walla Walla County.<br />
Members, including the landowners, a County official, a local Audubon representative, Washington Department of<br />
Fish and <strong>Wildlife</strong>, U.S. Fish and <strong>Wildlife</strong>, and FPL Energy.<br />
<strong>Stateline</strong> <strong>Monitoring</strong> <strong>Final</strong> <strong>Report</strong> 2<br />
December 2004
2.0 STUDY AREA AND PROJECT DESCRIPTION<br />
The <strong>Stateline</strong> project area is in a semi-arid environment in the Columbia Basin Province.<br />
Precipitation averages 25 to 38 centimeters annually, most of which falls from October through<br />
March. Average annual air temperature is 10 to 12 degrees Celsius, and the average frost-free<br />
period is 135 to 170 days. It is situated on privately-owned land zoned Exclusive Farm Use in<br />
Umatilla County, Oregon and Primary Agriculture in Walla Walla County, Washington.<br />
Elevation of the turbine strings ranges from approximately 274 m (900 ft) near turbine string<br />
WSB to 533 m (1,750 ft) near the northern portion of the project (Figure 1). The land is<br />
currently used for dryland (not irrigated) wheat production and cattle grazing. Wheat is<br />
generally grown on a two-year rotation cycle - fields are rested (fallow) in alternation with crop<br />
production (seeding, tilling, harvesting). Portions of the <strong>Stateline</strong> wind-leased lands that were<br />
previously farmed have been placed in the Conservation Reserve Program (CRP) during the past<br />
twenty years. Some fields have been taken out of the CRP through the various enrollment cycles<br />
and these fields are now being grazed. Land cover of the <strong>Stateline</strong> landscape is a mosaic of large<br />
wheat fields, native bunchgrass on deep and shallow soil, non-native mature CRP grassland<br />
(crested wheatgrass), and narrow bands of sagebrush along major riparian corridors such as<br />
Vansycle Canyon. Trees are very limited in the uplands. Scattered trees (black locust, Robinia<br />
pseudoacacia) that were planted during early settlement can be found intermittently on dry sites;<br />
native trees are limited to moist drainages and consist of willows (Salix spp.) and scattered<br />
cottonwoods (Populus spp.). <strong>Wildlife</strong> habitat types in the wildlife monitoring study area (search<br />
plots, etc.) are described elsewhere in this report.<br />
The wind project consists of 454 Vestas V-47 wind turbines, rated at 660 kW each, with 273<br />
turbines located in Washington and 181 turbines located in Oregon. Turbines are mounted on<br />
50-m (165-ft) tubular steel towers (Figure 2). The rotor diameter of the three-bladed turbines is<br />
47 m (154 ft), resulting in a rotor swept area (RSA) of 1735 m 2 . The maximum height above<br />
ground to the top of the RSA is 72 m (242 ft). The minimum height above ground to the lower<br />
portion of the RSA is 27 m (88 ft) (Figure 2). The V-47 wind turbines operate at wind speeds<br />
from 10 to 90 kilometers per hour (kph) (8 to 56 miles per hour [mph]), at a relatively constant<br />
(± 10%) speed of 28.5 revolutions per minute (rpm).<br />
Approximately 140 of the wind turbines are lit with obstruction lighting. Turbines located at the<br />
end of turbine strings are lit, and typically every fourth turbine within a string is also lit (Figure<br />
1). Each lit turbine is equipped with Honeywell L-865 medium intensity red/white dual lighting,<br />
with white strobe during the day (40 flashes per minute), and red flashing at night (20-40 flashes<br />
per minute). The red lights also operate during dense fog conditions occurring during the<br />
daylight periods.<br />
3.0 METHODS<br />
Detailed protocols have been developed for the monitoring studies and can be found in FPL<br />
Energy et al. (2001), OEFSC (2001, 2002, and 2003), in Erickson et al. (2003a), and in the<br />
<strong>Stateline</strong> Washington TAC meeting minutes and recommendations memos submitted to the<br />
Washington permitting agency in 2002 and 2003. The methods are summarized in this report.<br />
<strong>Stateline</strong> <strong>Monitoring</strong> <strong>Final</strong> <strong>Report</strong> 3<br />
December 2004
3.1 Seasons<br />
This study uses the following dates for defining seasons 2 :<br />
Season<br />
Dates<br />
Spring/Migration March 16 to May 15<br />
Summer/Breeding May 16 to August 15<br />
Fall/Migration August 16 to October 31<br />
Winter November 1 to March 15<br />
3.2 Avian and Bat Fatality Study<br />
This section describes methods for the various components of the avian and bat fatality study,<br />
including methods for standardized search plot delineation and sampling design, carcass<br />
searching, carcass removal and observer detection trials, fatality estimation, and the <strong>Wildlife</strong><br />
Response and <strong>Report</strong>ing System (WRRS) consisting of reporting incidental finds and FPL<br />
Energy protocol searches of a sample of turbines (see section 3.2.6).<br />
3.2.1 Standardized Search Plots<br />
The original study design called for carcass searching at turbines and permanent guyed<br />
meteorological towers. However, turbine locations were the focus of carcass searches on<br />
standardized search plots because all permanent meteorological towers were subsequently<br />
designed to be unguyed structures, eliminating avian mortality due to collision with wires, and<br />
the need to search these structures for casualties. Bird mortality at a tall unguyed monopole<br />
structure is expected to be extremely low, but not necessarily zero.<br />
Turbine search plots were rectangular in shape and typically contained three turbines, but some<br />
contained one, two, or four turbines (Figure 1, Figure 3, Appendix A1 – A4 and Appendix B1 -<br />
B3). Plot boundaries were delineated a minimum distance of 63 meters from the turbines.<br />
<strong>Stateline</strong> 1 turbine towers are typically spaced slightly over 70 m apart within a string. The<br />
survey plot boundary extended to the center point of the turbines adjacent to the survey turbine.<br />
<strong>Stateline</strong> 2 turbine towers were approximately 105 m apart, so a smaller portion of the area<br />
around adjacent turbines was sampled in this case. The area of a typical three-turbine plot was<br />
approximately 0.3 hectares (0.8 acres). The sampling design used in 2001-2002 and in 2003 for<br />
standardized carcass searches is described below.<br />
3.2.1.1 Standardized Carcass Search Sampling Design, 2001-2002<br />
The sampling framework for the 2001 and 2002 standardized searches consisted of 399 (273 in<br />
Washington, 126 in Oregon) turbines that were in operation by January 1, 2002 in the <strong>Stateline</strong><br />
<strong>Wind</strong> <strong>Project</strong>. Turbine plots representative of the entire project area were systematically selected<br />
and surveyed in Washington (20 plots, 60 turbines) and Oregon (21 plots, 64 turbines)<br />
(Appendix A-1 and A-2, Figure 1). Approximately 13 hectares (33 acres) were surveyed during<br />
each search period 3 , with approximately 7 hectares (17 acres) in Oregon and 6 hectares (16<br />
acres) in Washington. The 20 plots in Washington comprised approximately 27% 4 of the<br />
2 Carcass removal studies often overlapped seasons<br />
3 Based on calculations of the total area within 63 m of the sampled turbines.<br />
4 Approximate sampling fractions based on calculations of the total area within 63 m of all turbines.<br />
<strong>Stateline</strong> <strong>Monitoring</strong> <strong>Final</strong> <strong>Report</strong> 4<br />
December 2004
possible search area in Washington and the 21 plots in Oregon comprised approximately 58% 4 of<br />
the possible search area in Oregon.<br />
Construction for the Washington portion of the project started in late summer 2001. A total of<br />
292 turbine searches 5 were conducted in Washington from late July through December 31, 2001<br />
(Table 1 and Appendix B-1). Not all plots were searched an equal number of times because<br />
some of the turbine strings and circuits were still being constructed and tested before being fully<br />
operational during this period. Standardized searches on the Oregon sample of turbine plots<br />
began in January 2002 shortly after all Oregon turbines became operational; 1162 and 1176<br />
turbine searches 5 were conducted in Oregon and Washington, respectively, between January 1<br />
and December 2002 (Appendix B-2).<br />
3.2.1.2 Standardized Carcass Search Sampling Design, 2003<br />
The sampling framework for the 2003 standardized searches consisted of 454 (273 in<br />
Washington, 181 in Oregon) turbines that were in operation by January 1, 2003 in the <strong>Stateline</strong><br />
<strong>Wind</strong> <strong>Project</strong> (<strong>Stateline</strong> 1 and 2 Facility). Turbine plots representative of the entire project area<br />
were systematically selected and surveyed in Washington (20 plots, 60 turbines) and Oregon (30<br />
plots, 93 turbines) (Appendix A-3 and A-4, Figure 1). The 2003 plots were different than those<br />
surveyed in 2001 and 2002. Approximately 40 acres were surveyed during each search period 3 ,<br />
with approximately 24 acres in Oregon and 16 acres in Washington. The 20 plots in Washington<br />
comprised approximately 27% 4 of the possible search area in Washington and the 30 plots in<br />
Oregon comprised approximately 57% 4 of the possible search area in Oregon. Approximately<br />
1,779 and 1,250 turbine searches 5 were conducted in Oregon and Washington, respectively,<br />
between January 1 and December 2003 (Table 1 and Appendix B-3).<br />
3.2.2 Standardized Searches<br />
Personnel trained in proper search techniques (“the searchers”) conducted standardized carcass<br />
searches by walking parallel transects. Searches were conducted within rectangular search plots<br />
with the long axis of the plot centered on the turbine string. All area within a minimum of 63<br />
meters from turbines was searched. Transects were set at 6 meters apart in the area to be<br />
searched. Searchers walked at a rate of approximately 45 to 60 meters per minute along each<br />
transect searching both sides out to three meters for casualties. All fatalities that meet one of the<br />
following criteria were included in the fatality estimates, unless cause of death was determined<br />
not to be wind project related:<br />
• Intact – a carcass that is completely intact, is not badly decomposed and shows no<br />
sign of being fed upon by a predator or scavenger<br />
• Scavenged – an entire carcass that shows signs of being fed upon by a predator or<br />
scavenger, or portions of a carcass in one location (e.g., wings, skeletal remains,<br />
legs, pieces of skin, etc.)<br />
• Feather Spot – 10 or more feathers at one location indicating predation or<br />
scavenging<br />
5 If a plot contains 3.5 turbines and was searched 3 times, the number of turbine searches would be reported as 10.5<br />
<strong>Stateline</strong> <strong>Monitoring</strong> <strong>Final</strong> <strong>Report</strong> 5<br />
December 2004
Some casualties that were discovered and used in fatality rate estimation may not be wind<br />
project-related because cause of death could not be determined. Natural mortality and predation<br />
occurs, but the level of this background mortality in the project area was not studied. <strong>Inc</strong>luding<br />
non-project-related casualties in calculations for fatality estimates may contribute to<br />
overestimation of project-related fatality rates. For data reporting and analysis, the turbine<br />
nearest the fatality was assumed the turbine responsible for the fatality.<br />
3.2.3 Observer Detection Bias Experimental Trials<br />
The objective of observer detection bias experimental trials 6 is to estimate the percentage of<br />
actual bird and bat fatalities that searchers are able to find. These trials were conducted in the<br />
same area in which standardized searches occurred in both grassland/shrub-steppe and cultivated<br />
agriculture habitat types. Trials were conducted in each season of each monitoring year.<br />
Estimates of observer detection rates were used to adjust the number of carcasses found,<br />
correcting for detection bias. Each season, approximately 10 bird carcasses of two size classes<br />
(20 total carcasses) were distributed at plots classified into one of two habitat types<br />
(grassland/shrub-steppe and cultivated agriculture).<br />
Personnel conducting searches did not know when trials were scheduled, but became aware once<br />
a trial bird was found. Personnel were not aware of how many trial carcasses were placed within<br />
a search plot. Before the beginning of a standardized search, observer detection trial carcasses<br />
were placed at random locations. Each non-domestic carcass was discreetly marked so that it<br />
could be identified as a searcher efficiency trial carcass after it was found. The number and<br />
location of trial carcasses found during the standardized search were recorded. The number of<br />
efficiency trial carcasses available for detection during each trial was determined immediately<br />
after the trial by the person responsible for distributing the carcasses, since scavengers may have<br />
removed trial birds before searches were conducted.<br />
3.2.4 Carcass Removal Bias Experimental Trials<br />
The objective of carcass removal bias experimental trials 7 was to estimate the length of time<br />
avian and bat carcasses remain in the search area before being removed by scavengers or other<br />
means. Carcass removal studies were conducted during each season each monitoring year in the<br />
vicinity of the search plots. Estimates of carcass removal were used to adjust carcass counts for<br />
removal bias. “Carcass removal” was the disappearance of a carcass from the search area due to<br />
predation, scavenging, or other means such as farming activity.<br />
Field crews periodically placed trial carcasses in the project area and monitored them over time<br />
to assess scavenging and removal rates. A variety of species were used in the trials. Trial<br />
carcasses were removed from a freezer 8 to 24 hours prior to start of the trial.<br />
Planted carcasses were not placed in standardized search plots being searched that year because<br />
they might be confused with wind turbine-related fatalities, especially if these trial carcasses<br />
6 Observer detection bias trials are often referred to as searcher efficiency trials.<br />
7 Carcass removal trials are often referred to as scavenging bias trials, since most carcass removal is done by<br />
scavengers (wild or feral domestic). However, removal could also be due means other than scavengers (e.g.,<br />
farming activities)<br />
<strong>Stateline</strong> <strong>Monitoring</strong> <strong>Final</strong> <strong>Report</strong> 6<br />
December 2004
were scavenged (e.g. feathers spread out). Most of the planted carcasses were placed at turbines<br />
not searched, with a few placed near the standardized search plots but not within the plots. The<br />
planted carcasses were located randomly within the carcass removal trial plots (random distance<br />
and direction from turbine, or random location within plot). Each season within each monitoring<br />
year, approximately 10 bird carcasses of two size classes (20 total carcasses) were distributed in<br />
each of two general landcover types (grassland/shrub-steppe and cultivated agriculture). In the<br />
fall of 2003, one bat carcass removal trial was conducted using 7 fresh bat carcasses (4 hoary<br />
bats and 3 silver-haired bats).<br />
3.2.5 Statistical Methods for Fatality Estimates<br />
The estimate of the total number of wind facility-related fatalities is based on:<br />
(1) Observed number of carcasses found during standardized searches during the 2002<br />
and 2003 monitoring years for which the cause of death is either unknown or is<br />
probably facility-related.<br />
(2) Searcher efficiency expressed as the proportion of planted carcasses found by<br />
searchers during the entire survey period<br />
(3) Non-removal rates expressed as the estimated average probability a carcass is<br />
expected to remain in the study area and be available for detection by the searchers<br />
during the entire survey period<br />
3.2.5.1 Definition of Variables<br />
The following variables are used in the equations below:<br />
c i the number of carcasses detected at plot i for the study period of interest (e.g., one<br />
year) for which the cause of death is either unknown or is attributed to the facility<br />
n the number of search plots<br />
k the number of turbines searched (includes the turbines centered within each<br />
search plot and a proportion of the number of turbines adjacent to search plots to<br />
account for the effect of adjacent turbines on the 63-meter search plot buffer area)<br />
c the average number of carcasses observed per turbine per year<br />
s the number of carcasses used in removal trials<br />
s c the number of carcasses in removal trials that remain in the study area after 40<br />
days<br />
se standard error (square of the sample variance of the mean)<br />
t i the time (days) a carcass remains in the study area before it is removed<br />
t the average time (days) a carcass remains in the study area before it is removed<br />
d the total number of carcasses placed in searcher efficiency trials<br />
p the estimated proportion of detectable carcasses found by searchers<br />
I the average interval between searches in days<br />
ˆπ the estimated probability that a carcass is both available to be found during a<br />
search and is found<br />
m the estimated annual average number of fatalities per turbine per year, adjusted<br />
for removal and observer detection bias<br />
<strong>Stateline</strong> <strong>Monitoring</strong> <strong>Final</strong> <strong>Report</strong> 7<br />
December 2004
3.2.5.2 Observed Number of Carcasses<br />
The estimated average number of carcasses ( c ) observed per turbine per year is:<br />
c =<br />
n<br />
∑<br />
i=<br />
1<br />
k<br />
c<br />
i<br />
. (1)<br />
3.2.5.3 Estimation of Carcass Removal<br />
Estimates of carcass removal are used to adjust carcass counts for removal bias. Mean carcass<br />
removal time ( t ) is the average length of time a carcass remains at the site before it is removed:<br />
s<br />
∑t<br />
t =<br />
s − s<br />
i<br />
i=<br />
1<br />
c<br />
. (2)<br />
This estimator is the maximum likelihood estimator assuming the removal times follow an<br />
exponential distribution and there is right-censoring of data. In our application, any trial<br />
carcasses still remaining at 40 days are collected, yielding censored observations at 40 days. If<br />
all trial carcasses are removed before the end of the trial, then s c is 0, and t is just the arithmetic<br />
average of the removal times. For the bat trial, carcasses were monitored every day for 20 days.<br />
Removal rates were estimated by carcass size (small and large) and season.<br />
3.2.5.4 Estimation of Observer Detection Rates<br />
Observer detection rates (i.e., searcher efficiency rates) are expressed as p, the proportion of trial<br />
carcasses that are detected by searchers. Observer detection rates were estimated by carcass size<br />
and season.<br />
3.2.5.5 Estimation of Facility-Related Fatality Rates<br />
The estimated per turbine annual fatality rate (m) is calculated by:<br />
c<br />
m = , (3)<br />
^<br />
π<br />
where ˆ π includes adjustments for both carcass removal (from scavenging and other means) and<br />
observer detection bias assuming that the carcass removal times t i<br />
follow an exponential<br />
distribution. Data for carcass removal and observer detection bias were pooled across the study<br />
to estimate ˆ π . Under these assumptions, this detection probability is estimated by<br />
I<br />
( t )<br />
( )<br />
⎡<br />
^<br />
exp −1<br />
⎤<br />
t⋅p<br />
⎢ ⎥<br />
π = ⋅<br />
I ⎢ ⎥ .<br />
⎢exp I − 1+<br />
p ⎥<br />
⎣ t ⎦<br />
This formula has been independently verified by Shoenfeld (2004). The amount of data<br />
collected in 2001 at individual plots varied depending on when turbines became operational.<br />
Some plots were only surveyed once in late winter, while a few plots were searched up to 8 times<br />
between July and December 2001. Due to the variation in effort in 2001, and the effects of<br />
<strong>Stateline</strong> <strong>Monitoring</strong> <strong>Final</strong> <strong>Report</strong> 8<br />
December 2004
seasonal differences in fatality rates, standardized estimates do not include the 2001 fatality data.<br />
Standardized fatality estimates were calculated for 2002, 2003, and the average of the two years.<br />
The potential effects of omitting the 2001 data from annual estimates of fatality rates are<br />
quantitatively and qualitatively reviewed in the discussion section. The report summarizing<br />
results from July 2001 through December 2002 did include the 2001 data in overall fatality rate<br />
calculations (Erickson et al. 2003a).<br />
Fatality estimates were calculated for: (1) all birds, (2) small birds, (3) large birds, (4) raptors, (5)<br />
grassland birds, (6) nocturnal migrants, and (7) bats. The final reported estimates of m and<br />
associated standard errors and 90% confidence intervals were calculated using bootstrapping<br />
(Manly 1997). Bootstrapping is a computer simulation technique that is useful for calculating<br />
point estimates, variances, and confidence intervals for complicated test statistics. For each<br />
iteration of the bootstrap, the plots were sampled with replacement, trial carcasses were sampled<br />
with replacement, and c , t , p, ˆ π , and m were calculated. A total of 5,000 bootstrap iterations<br />
were used. The reported estimates are the means of the 5,000 bootstrap estimates. The standard<br />
deviation of the bootstrap estimates is the estimated standard error. The lower 5 th , and upper 95 th<br />
percentiles of the 5000 bootstrap estimates are estimates of the lower limit and upper limit of<br />
90% confidence intervals.<br />
Differences in observed nocturnal migrant and bat fatality rates for lit turbines, unlit turbines<br />
that are adjacent to lit turbines, and unlit turbines that are not adjacent to lit turbines were<br />
compared graphically and statistically.<br />
3.2.6 <strong>Wildlife</strong> Response and <strong>Report</strong>ing System (WRRS)<br />
FPL Energy’s <strong>Stateline</strong> WRRS is a monitoring program set up to search for, report, and handle<br />
avian and bat casualties found by maintenance personnel. A description of this system and<br />
associated data forms used for the <strong>Stateline</strong> <strong>Wind</strong> <strong>Project</strong> is found in FPL Energy (2003). This<br />
system includes systematic searches (“WRRS protocol searches”) of a turbine sample set<br />
(“WRRS protocol search plots”, Appendix C) conducted by FPL Energy maintenance personnel.<br />
The WRRS also reports and documents fatalities discovered incidentally. These incidental finds<br />
may include fatalities discovered by maintenance personnel, contractors, or by others (e.g.,<br />
project biologists) during field activities other than carcass searching. <strong>Inc</strong>idental carcass finds<br />
that were found on standardized search plots were included in the fatality rate estimation.<br />
No WRRS searches were conducted in 2001. Appendix C-1 contains a list of turbines that were<br />
searched (“protocol searches”) in 2002 by FPL Energy on a quarterly basis using the <strong>Stateline</strong><br />
WRRS protocol. The WRRS protocol search plots are different from and in addition to the<br />
standardized search plots. Casualties discovered incidentally by maintenance personnel or others<br />
(project biologists during other activities) were reported and documented with the WRRS.<br />
Appendix C-2 lists the turbines that were searched in 2003 using the WRRS protocol.<br />
3.3 Avian Use Surveys and <strong>Inc</strong>idental <strong>Wildlife</strong> Observations<br />
Prior to or immediately after each standardized carcass search, observers recorded birds detected<br />
in a ten-minute period at a station. Stations were established at each standardized search plot<br />
using standard variable circular plot point count survey methods. Surveys were conducted at<br />
<strong>Stateline</strong> <strong>Monitoring</strong> <strong>Final</strong> <strong>Report</strong> 9<br />
December 2004
various times during daylight hours. The first avian use survey was conducted the first week in<br />
August 2001, approximately when the Washington monitoring commenced.<br />
3.4 Raptor Nest Surveys<br />
In addition to the pre-construction surveys, aerial surveys for raptor nests were conducted by<br />
helicopter after construction in 2002 of <strong>Stateline</strong> 1 (Oregon and Washington), and also in 2003 after<br />
construction of both <strong>Stateline</strong> 1 (Oregon and Washington) and 2 (Oregon only). The objectives of<br />
raptor nest surveys were to estimate the size of the local breeding populations of some raptor<br />
species in the vicinity of the facility and to determine whether operation of the facility resulted in<br />
a reduction of nesting activity or nesting success in the local populations of “target raptor<br />
species”: Swainson’s hawk, ferruginous hawk, golden eagle and prairie falcon.<br />
During surveys, information was gathered on nesting species in the study area including nest<br />
locations, timing, and success (if possible to determine). Surveys were conducted within an 8-km<br />
buffer (5-mile) of Oregon and Washington <strong>Stateline</strong> 1 turbines in 2002 and within a 3-km buffer (2-<br />
mile) of <strong>Stateline</strong> 1 and 2 turbines in 2003. The reduced survey area was agreed upon by the<br />
permitting agencies and the TAC. Two helicopter aerial surveys were conducted in 2002 and one<br />
survey was conducted in 2003. The first survey in 2002 was conducted between May 5 and 17,<br />
and the second survey was conducted between June 8 and 28. Aerial surveys in 2003 were<br />
conducted between May 6 and June 17. In addition to aerial surveys, ground surveys were also<br />
conducted during 2002 and 2003 for active ferruginous hawk and Swainson’s hawk nests within 3<br />
km (2 miles) of <strong>Stateline</strong> 1 and 2 turbines. This survey information was used to quantitatively and<br />
qualitatively assess impacts on local nesting populations and to direct mitigation efforts.<br />
All potential raptor nests 8 were recorded, regardless of whether they were occupied. Notes were<br />
taken on the presence of adults, eggs, chicks, and fledglings. Nest structure type and other<br />
details were recorded. Nest sites were considered active during the first survey if adult birds<br />
were observed perched or flying near the nest but nest contents were not visible. Breeding pairs<br />
are defined as incubating adults, eggs, chicks, or fledglings perched at the nest. A few nests in<br />
Oregon were flown twice in 2003 because activity status was impossible to determine from the<br />
ground. Nest site locations are withheld from this report due to the sensitivity of the data.<br />
3.5 Burrowing Owl Surveys<br />
Burrowing owl surveys were conducted in 2002 and 2003 to document the presence of this<br />
species during the nesting season and the location of the burrowing owl activity in relation to<br />
turbine locations. The objectives were to estimate the size of the local breeding population in the<br />
vicinity of the facility and to determine whether operation of the facility results in a reduction of<br />
nesting activity or nest success in the local burrowing owl population. In 2002, burrowing owl<br />
survey methods varied between Oregon and Washington due to permitting agency requirements<br />
and differences in pre-construction baseline survey efforts. In 2003, as agreed upon by the<br />
Washington TAC, surveys in Washington followed Oregon methods.<br />
In Washington, surveys during 2002 were conducted within 305 m (1000 ft) of turbines that were<br />
located in suitable habitat. In 2003, surveys were conducted within suitable habitat in<br />
8 Stick nests or eyries potentially capable of supporting nesting large birds.<br />
<strong>Stateline</strong> <strong>Monitoring</strong> <strong>Final</strong> <strong>Report</strong> 10<br />
December 2004
association with the fatality monitoring plots. In both years, historic nest sites located outside<br />
the search plots (including the sites first discovered in 2002) were checked for activity.<br />
In Oregon, surveys were conducted during the breeding seasons of 2002 and 2003 in suitable<br />
habitat associated with the fatality monitoring plots. Two surveys for burrowing owls were<br />
conducted in both states between June 16 and August 8 in both years. Taped burrowing owl<br />
vocalizations were played to detect response calls within and adjacent to the survey areas.<br />
Historic nest sites and habitat within 100 m of previously documented nest burrows were<br />
checked for use a minimum of two days between March 4 and August 13 as required in the<br />
OEFSC permit. Most of the first surveys were conducted by April 15 and most of the second<br />
surveys were conducted by June 17. Newly discovered 2003 active sites were also checked a<br />
minimum of two times between March 4 and August 13.<br />
Other portions of the project area were also surveyed for other field studies being conducted<br />
during the same monitoring study period (2001-2003). New burrowing owl activity areas were<br />
recorded when discovered during those studies.<br />
3.6 Short-eared Owl Surveys<br />
Driving surveys along roads associated with the <strong>Stateline</strong> turbines in Oregon and Washington<br />
were conducted once during the breeding season of 2002 to document short-eared owl presence<br />
in the study area. As agreed upon by the Washington TAC, no formal short-eared owl surveys<br />
were conducted in 2003, but observations of the species were recorded while monitoring crews<br />
were on-site conducting other monitoring tasks throughout the year. In 2002, surveys were<br />
conducted on April 11 and 17 between 1600 hrs (4:00 p.m.) and darkness. Approximately 34 km<br />
(21 miles) of project roads were surveyed in 6.5 hours; most roads were traveled twice during the<br />
survey (ingress and egress). Surveys were conducted at driving speeds between 8 and 16 kph (5<br />
and 10 mph). While accessing facility roads via public roads (Hatch Grade and Dorran Rds.),<br />
surveyors looked for short-eared owls as well.<br />
3.7 Grassland Bird Displacement Surveys<br />
A total of 20 transects were monitored both pre-construction (2001) and after commercial<br />
operation (2002) in Oregon at <strong>Stateline</strong> 1 turbines to estimate displacement impacts, if any exist,<br />
to grassland nesting songbirds adjacent to wind turbine strings. Transects 300 m in length were<br />
located in suitable grassland habitat and were oriented perpendicular to the turbine string.<br />
Additional transects were established and monitored in 2003 at locations where turbines have<br />
been permitted in Oregon but have not yet been built. Surveys will also be conducted in 2006 at<br />
the 20 <strong>Stateline</strong> 1 transects. If any <strong>Stateline</strong> 3 turbines are built, surveys will be conducted for an<br />
additional breeding season at the 20 <strong>Stateline</strong> 1 transects and six <strong>Stateline</strong> 3 turbines in 2008.<br />
Each transect was visited three times during the breeding seasons of 2001 and 2002. These<br />
searches were conducted between mid-April and late June. Observers recorded observations of<br />
grassland/steppe avian species within 50 m of both sides of the transect. Numbers of individual<br />
birds of each species were recorded for each transect segment.<br />
A qualified observer walked the pre-established transects and recorded detections of grasshopper<br />
sparrows, long-billed curlews, and other grassland/steppe avian species that were either seen or<br />
<strong>Stateline</strong> <strong>Monitoring</strong> <strong>Final</strong> <strong>Report</strong> 11<br />
December 2004
heard. The approximate distance along the transect is recorded for each detection, and the<br />
habitat type is recorded for each 50-m segment of the transect (6 segments).<br />
A gradient analysis (Morrison et al. 2001) was used to determine the relationship between<br />
density of grassland/steppe avian species and distance from turbines. A “gradient analysis”<br />
assesses whether a significant or a biologically substantial relationship exists between distance<br />
from project structures and abundance or use of the area. The differences between grassland bird<br />
use during the post-construction period and pre-construction period are calculated for each 50-m<br />
segment away from the turbines. The averages of these differences for each 50-m segment are<br />
compared using t-tests and 95% confidence intervals.<br />
3.8 <strong>Inc</strong>idental <strong>Wildlife</strong> Observations<br />
Additional observations of wildlife species of interest (e.g., raptors, bird and mammal species not<br />
previously documented, uncommon species) were recorded while conducting other surveys or<br />
while in-transit within the <strong>Project</strong> area and are presented in table format in section 4.9.<br />
4.0 RESULTS<br />
This section summarizes results of <strong>Stateline</strong> monitoring in Oregon and Washington for data<br />
collected between July 2001 and December 31, 2003. Standardized fatality estimates are based<br />
on the two complete years of study (January 1 2002 – December 31, 2003).<br />
4.1 Bird Casualty Finds<br />
Bird fatalities observed between July 2001 and December 31, 2003 are listed in Appendix D.<br />
Since July 2001, 232 bird fatalities comprising 35 identified species were found, with 210<br />
associated with standardized search plots. In Washington, 92 fatalities were observed on<br />
standardized search plots, and 19 fatalities were reported incidentally off search plots. In<br />
Oregon, 118 fatalities were observed on standardized search plots, and 3 fatalities were reported<br />
incidentally off search plots. Bird fatalities on standardized search plots were found near 144<br />
different turbines (i.e. closest turbine to fatality). The maximum number of fatalities found at<br />
any one turbine during searches in a monitoring year was 4 fatalities found closest to turbines<br />
BGC16 and BGB19 (Table 2). The average distance of bird casualties (calculated for all 232<br />
records) to the nearest turbine was 36 m (Figure 4).<br />
Horned larks comprised 38.6% of the fatalities on search plots (81 fatalities, Table 3, Figure 5).<br />
Golden-crowned kinglet (20 fatalities), ring-necked pheasant (18), western meadowlark (12),<br />
chukar (7) and gray (Hungarian) partridge (7), were the next most common species of fatalities<br />
(Table 3, Figure 5). Passerines comprised 75.2% of the fatalities (158), 50.0% of which were<br />
considered resident (105) and 25.2% of which were considered migrants (53, Figure 5). Upland<br />
gamebirds (15.2%, 32 fatalities) was the only other group with more than 10% of reported<br />
fatalities. Some of the fatalities may not be turbine- or facility-related, including many of the<br />
upland gamebird fatalities. It is suspected that vehicles, raptors, and other predators could have<br />
been the cause of death for some of the gamebird, meadowlark and horned lark fatalities.<br />
<strong>Stateline</strong> <strong>Monitoring</strong> <strong>Final</strong> <strong>Report</strong> 12<br />
December 2004
Migrant passerine casualties comprised 25.2% of mortality on search plots (Figure 5) and<br />
included golden-crowned kinglet (20 fatalities), white-crowned sparrow (5), yellow-rumped<br />
warbler (4), winter wren (4), house wren (3), dark-eyed junco (3), golden-crowned sparrow (3),<br />
savannah sparrow (2), vesper sparrow (2), American pipit (1), house finch (1), MacGillivray’s<br />
warbler (1), red-breasted nuthatch (1), red-winged blackbird (1), ruby-crowned kinglet (1) and<br />
Swainson’s thrush (1). Using the 2002 and 2003 fatalities, approximately 20% of the migrant<br />
passerine mortality occurred in the spring, and approximately 80% occurred in the fall.<br />
During the two and one-half year study period, 17 raptor carcasses were found, 13 of which were<br />
found in standardized search plots. Fourteen of the 17 raptors were of two species; red-tailed<br />
hawk (9 fatalities) and American kestrel (5 fatalities). The other 3 fatalities included a<br />
ferruginous hawk, Swainson’s hawk, and short-eared owl. The short-eared owl was found<br />
incidentally beneath a fence more than 100 m from a turbine in 2001. It was unclear whether<br />
this fatality was turbine-related. The ferruginous hawk was an adult bird and was found on July<br />
18, 2003 near turbine HGM13 in Oregon. The nearest active ferruginous hawk nest was<br />
approximately 0.8 km (0.5 mile from HGM13). This nest had successfully fledged 2 young in<br />
2003. It is not known if the fatality was an adult from this nest. The Swainson’s hawk was also<br />
an adult and was found on August 12, 2002 nearest to turbine HGA9. The nearest known active<br />
Swainson’s hawk nest was over 3 km (2 miles) northwest of HGA9. Five of the red-tailed hawks<br />
were considered juveniles, 2 were adults, and age could not be determined for the remaining 2<br />
(feather spots). Two of the kestrels were considered adults and age could not be determined for<br />
the 3 kestrel feather spots.<br />
In 2002, 4 of 6 raptor fatalities on standardized search plots were discovered on string HGA.<br />
The other two fatalities were located at two other strings (HGH and WSA). A fire that burned<br />
Hatch Grade Canyon (located Northwest of Washington <strong>Stateline</strong>) and adjacent slopes may have<br />
increased prey availability (e.g., pocket gophers and deer mice) and increased raptor use. There<br />
were also some relatively large groups of raptors observed in the project area in early September<br />
2002. For example, on September 6, 2002, a large kettle (group) of Swainson’s hawks<br />
(approximately 25) was observed near string HGB soaring on thermals. On September 3, a<br />
group of 7 red-tailed hawks and a group of 7 Swainson’s hawks were observed hunting in<br />
agriculture fields near HGA in conjunction with active field cultivation. In 2003, no raptor<br />
fatalities were found at HGA. In 2003, 3 of 7 raptor fatalities were discovered on the string<br />
BGB, with the other 4 fatalities located at 4 different strings (HGJ, HGS, HGM, HGL). All 3<br />
were American kestrels, with fatalities observed in May, June, and July. No raptor fatalities<br />
were discovered in 2002 at BGB.<br />
Fatalities reported in 2002 and 2003 were found throughout the year, but rates appeared lowest in<br />
the winter and highest in October during fall migration (Figure 6). When considering all birds,<br />
fatalities do not appear strongly localized and have been found throughout the wind project<br />
(Figure 7). Raptor fatalities have been observed primarily in the summer and early fall (Figure<br />
6), with no fatalities in the winter months. All raptor fatalities in 2002 occurred in the<br />
Washington portion of the project area (8 fatalities), while all raptor fatalities in 2003 occurred in<br />
the Oregon portion of the project (8 fatalities, Figure 8). However, one injured (and successfully<br />
rehabilitated) raptor was found in Oregon in 2002, and the one short-eared owl fatality found<br />
near the fence was found in 2001.<br />
<strong>Stateline</strong> <strong>Monitoring</strong> <strong>Final</strong> <strong>Report</strong> 13<br />
December 2004
None of the bird species found is listed as Federal or State Threatened or Endangered. One<br />
grasshopper sparrow and one ferruginous hawk were found in Oregon and both these species are<br />
listed in Oregon as a State Sensitive status species (Table 3).<br />
4.2 Bat Casualty Finds<br />
Bat fatalities observed between July 2001 and December 31, 2003 are listed in Appendix E.<br />
During this period, 150 bat fatalities were found, 128 of which were found on standardized<br />
search plots. Of the 128 bats, silver-haired bats comprised 50.0%, hoary bats comprised 46.1%<br />
and little and big brown bats each comprised less than 2 perecent (Table 4 and Figure 9). These<br />
fatalities were found near 100 different turbines (i.e. closest turbine to fatality, Figure 10). The<br />
maximum number of fatalities found at any one turbine during searches was 4 fatalities found<br />
closest to turbine PB30 (Table 5). The average distance from bat casualties to the nearest turbine<br />
was 19 m (Figure 4).<br />
The 150 bat carcasses were examined to determine age and gender, if possible. Aging and<br />
sexing of fatalities followed criteria in Anthony (1988) and Racey (1988). For hoary bats, 68 %<br />
were adults, 28 % were juveniles, and 4% were unidentified to age. For silver-haired bats, 60%<br />
were adults, 36% were juveniles, and 4% were unidentified to age. Fewer bats were in good<br />
enough condition to determine gender. Of the 32 hoary bats where sex could be determined,<br />
53% were males and 47% were females. Of the 18 silver-haired bats where sex could be<br />
determined, 83% were males and 17% were females.<br />
Bat fatalities reported in 2002 and 2003 were found primarily during fall, an apparent migration<br />
period for hoary and silver-haired bats, with mortality peaking during September (Figure 11).<br />
Peak mortality of silver-haired bats appeared to be earlier than hoary bats. Bat fatalities were<br />
observed throughout the wind project (Figure 10).<br />
None of the bat species found are Federal or State Threatened or Endangered. Silver-haired bats<br />
were found in both Oregon and Washington and this species is listed as an Oregon Sensitive<br />
status species (Table 4).<br />
4.3 WRRS Casualty Finds<br />
WRRS casualty finds (from protocol searches and incidental finds by FPL Energy and other<br />
contractors) that were not found on standardized search plots are listed in Appendix D-3 and E-3.<br />
4.3.1 Birds<br />
Thirty bird fatalities (12 horned larks, 5 red-tailed hawks, 2 white-crowned sparrows, 2 gray<br />
partridge, 2 ring-necked pheasants, 2 European starlings, 1 Canada goose, 1 white-throated swift,<br />
1 chukar, 1 golden-crowned kinglet, and a short-eared owl feather spot) were found incidentally<br />
or during a WRRS protocol search and reported between July 2001 and December 2003<br />
(Appendix D-3). In 2002, an injured Swainson’s hawk was found and was successfully<br />
rehabilitated and released. The short-eared owl feather spot was found 103 meters from the<br />
nearest turbine at the base of a fencepost along a barbed wire fence in 2001. It is not clear from<br />
this evidence if this was a turbine-related fatality. It was 38 m outside the formal search area.<br />
During the 2.5-year period, two red-tailed hawks, 4 horned larks, 1 European starling, and 1 ring-<br />
<strong>Stateline</strong> <strong>Monitoring</strong> <strong>Final</strong> <strong>Report</strong> 14<br />
December 2004
necked pheasant were found incidentally (not during a scheduled search) within a standardized<br />
carcass search plot (Appendix D-1 and D-2). These fatalities contributed to estimation of annual<br />
bird fatality rates.<br />
4.3.2 Bats<br />
Twenty-seven bat fatalities (13 hoary bats, 11 silver-haired bats, 1 big brown bat, and 2<br />
unidentified bats) were also reported incidentally or found during a WRRS protocol search<br />
between July 1, 2001 and December 2003 (Appendix E-3). Five of the incidental finds (2 silverhaired<br />
bats, 1 hoary bat, 1 big brown bat, and an unidentified bat) were discovered on<br />
standardized search plots (Appendix E-1 and E-2). Most incidental finds were discovered by<br />
FPL Energy personnel or contractors and were reported using the WRRS. WRRS fatalities<br />
found on the standardized search plots were included in estimation of annual bat fatality rates.<br />
4.4 Observer Detection Bias Experimental Trials<br />
A total of 156 medium/large and 171 small trial carcasses were used in detection trials,<br />
representing approximately 40 different species. In 2001, two trials were conducted in both the<br />
fall and winter season. In 2002, two trials were conducted in the winter, spring and summer<br />
seasons each and three trials were conducted in the summer. In 2003, five trials were conducted<br />
in the winter, three trials were conducted in the summer and two were conducted in both the<br />
spring and fall. Overall, observers detected 78% of the medium/large carcasses and 42% of the<br />
small carcasses (Table 6). Detection rates for large birds were slightly higher in cultivated<br />
agriculture (86%) than in grassland (71%), whereas detection rates for small birds were similar<br />
in cultivated agriculture (39%) and grassland (43%). In agriculture, detection rates were lowest<br />
in the summer for both large birds (68%) and small birds (28%). In grassland, detection rates<br />
were highest in the winter for both large birds (83%) and small birds (48%).<br />
4.5 Carcass Removal Bias Experimental Trials<br />
In 2001, one trial was conducted in both the fall and winter (winter trial started in 2001 and<br />
ended in 2002). In 2002 and 2003, two trials were conducted in both the spring and fall, and<br />
three trials were conducted in both the summer and winter. Scavenging and carcass removal data<br />
for 430 carcasses representing over 40 different bird species were recorded. Mean removal time<br />
is estimated at 35.7 days (31.0, 41.4) 9 for large birds and 16.7 days (14.7, 19.0) 9 for small birds.<br />
For large birds, 62.4% remained until day 14 of the trial, 45.5% remained until day 30, and<br />
34.2% were still present on day 40 of the trial (Table 7, Figure 12). For small birds, 43.3%<br />
remained on day 14, 17.1% lasted until day 30, and 11.5% of small birds remained until day 40<br />
of the trial.<br />
Seven bat carcasses that were fresh when collected during standardized searches were monitored<br />
on a daily basis for 20 days in the fall of 2003. The mean time to removal was 16.5 days. and<br />
29% of the carcasses (2) were remaining on day 20 (Figure 13). Results of the bat scavenging<br />
study were not used in the adjusted estimates of bat fatalities due to small sample sizes.<br />
9<br />
upper and lower limits of 90% confidence intervals (bootstrapping)<br />
<strong>Stateline</strong> <strong>Monitoring</strong> <strong>Final</strong> <strong>Report</strong> 15<br />
December 2004
4.6 Fatality Estimates<br />
Fatality estimates, standard errors, and confidence intervals for: (1) all birds, (2) small birds, (3)<br />
large birds, (4) raptors, (5) grassland birds, (6) nocturnal migrants, and (7) bats are found in<br />
Table 8 and Figure 14. Estimates, standard errors and confidence intervals were calculated from<br />
bootstrap distributions. These fatality estimates are adjusted for carcass removal and observer<br />
detection bias. Fatality estimates extrapolated to the entire <strong>Stateline</strong> Facility (454 turbines) are<br />
presented for some bird groups, bird species and bat species in sections 4.6.4 (raptors), 4.6.5<br />
(grassland birds), 4.6.6 (nocturnal migrants) and 4.6.7 (bats). Based on the average number of<br />
days between searches, the estimated average probability a small bird casualty will remain until a<br />
scheduled search and will be found is 0.275 (0.241, 0.327) 10 . The estimated average probability<br />
a large bird casualty will remain until a scheduled search and will be found is 0.660 (0.612,<br />
0.693) 10 . Estimates extrapolated to the entire facility (454 wind turbines) for some species and<br />
taxonomic (e.g., grassland birds) and migrant groups (e.g., nocturnal migrants) are provided in<br />
sections 4.6.4 – 4.6.7.<br />
4.6.1 Small Birds<br />
One hundred fifty small bird fatalities were observed on search plots between January 1, 2002<br />
and December 31, 2003. Small bird fatality estimates were approximately 21% lower in 2003<br />
compared to 2002 (Figure 14). The estimated number of small bird fatalities per turbine per year<br />
and associated 90% confidence limits for the <strong>Stateline</strong> <strong>Wind</strong> Facility using the two complete<br />
years of study is 1.70 (1.33, 1.96) 10 (Table 8). Horned larks and golden-crowned kinglets were<br />
the most commonly observed fatalities with estimated fatality rates of 0.89 and 0.20 per turbine<br />
per year respectively.<br />
4.6.2 Large Birds<br />
Fifty large birds were observed on search plots between January 1, 2002 and December 31, 2003.<br />
Large bird fatality estimates were approximately 18% higher in 2003 compared to 2002 (Figure<br />
14). The estimated number of large bird fatalities per turbine per year and associated 90%<br />
confidence limits for the <strong>Stateline</strong> <strong>Wind</strong> Facility using the two complete years of study is 0.23<br />
(0.17, 0.29) 10 (Table 8).<br />
4.6.3 All Birds<br />
The fatality estimate for all birds was obtained by summing the estimates for small and large<br />
birds. All-bird fatality estimates were approximately 17% lower in 2003 compared to 2002<br />
(Figure 14). Estimated bird fatalities and associated 90% confidence limits for the <strong>Stateline</strong><br />
<strong>Wind</strong> Facility using the two complete years of study is 1.93 bird fatalities per turbine per year<br />
(1.56, 2.20) 10 (Table 8). Three European starlings, which are not protected under the Migratory<br />
Bird Treaty Act, were included in the estimate. By excluding the starlings, our estimate is<br />
approximately 1.89 bird fatalities per turbine per year. The estimated number of bird fatalities<br />
per turbine per year at plots located in cultivated agriculture ranged from 1.67 in 2002 to 2.13 in<br />
2003, yielding a two-year average of 1.90 fatalities per turbine per year. The estimated number<br />
of bird fatalities per turbine per year at plots located in grassland habitats ranged from 2.32 in<br />
2003 to 1.65 in 2003, yielding a two-year average of 1.98 fatalities per turbine per year.<br />
10<br />
upper and lower limits of 90% confidence intervals (bootstrapping)<br />
<strong>Stateline</strong> <strong>Monitoring</strong> <strong>Final</strong> <strong>Report</strong> 16<br />
December 2004
4.6.4 Raptors<br />
Thirteen raptor casualties were discovered on standardized search plots between January 1, 2002<br />
and December 31, 2003. Raptor fatality estimates were approximately equal in 2002 and 2003<br />
(Figure 14). The estimated number of raptor fatalities per turbine per year and associated 90%<br />
confidence limits for the <strong>Stateline</strong> <strong>Wind</strong> Facility using the two complete years of study is 0.060<br />
(0.028, 0.099) 11 (Table 8), resulting in an estimated 27 raptor fatalities per year for the entire<br />
facility (454 wind turbines). Based on composition of observed fatalities, red-tailed hawks and<br />
American kestrels are estimated to comprise over 80% of the total average annual raptor<br />
fatalities. In 2001 no raptors were recorded on search plots. In 2002, all raptor fatalities that<br />
were observed on standardized search plots were found in Washington, while in 2003 all were<br />
observed in Oregon.<br />
4.6.5 Grassland Birds<br />
Between January 1, 2002 and December 31, 2003, 131 grassland bird casualties 12 were observed<br />
on the standardized search plots. Grassland bird fatality estimates were approximately 18%<br />
lower in 2003 compared to 2002 (Figure 14). The estimated number of grassland bird fatalities<br />
per turbine per year and associated 90% confidence limits for the <strong>Stateline</strong> <strong>Wind</strong> Facility using<br />
the two complete years of study is 1.28 (0.98, 1.62) 11 , or approximately 580 per year for the<br />
entire facility (454 wind turbines). The highest fatality rate for individual grassland bird species<br />
is horned lark (0.89 fatalities/turbine/year, 400/year for the 454 wind turbines), followed by ringnecked<br />
pheasant (0.13 fatalities/turbine/year, 60/year) and western meadowlark (0.11<br />
fatalities/turbine/year, 50/year). No other single species is estimated to comprise more than 5%<br />
of grassland bird fatalities. By eliminating non-native upland gamebirds, grassland bird fatality<br />
estimates are 1.10 per turbine per year based on the two complete years of study.<br />
4.6.6 Nocturnal Migrants<br />
Forty-nine likely nocturnal migrant songbird fatalities 13 were observed on the standardized<br />
search plots between January 1, 2002 and December 31, 2003. Nocturnal migrant fatality<br />
estimates were very similar among years (Figure 14). The estimated number of nocturnal<br />
migrant fatalities per turbine per year and associated 90% confidence limits for the <strong>Stateline</strong><br />
<strong>Wind</strong> Facility using the two complete years of study is 0.55 (0.39, 0.68), or approximately 250<br />
per year for the entire facility (454 wind turbines). Golden-crowned kinglets were the most<br />
common nocturnal migrant observed, with total estimates per year of 90 per year for the entire<br />
facility. Most of the migrant passerine fatalities (approximately 80%) occurred in the fall.<br />
4.6.7 Bats<br />
One hundred and three bat fatalities (including three that were found injured and died later) were<br />
observed on search plots between January 1, 2002 and December 31, 2003. Bat fatality<br />
estimates in 2003 were approximately two times higher than in 2002 (Figure 14). Adjustments<br />
for observer detection bias and removal bias for bats were made using the estimates for small<br />
11<br />
upper and lower limits of 90% confidence intervals (bootstrapping)<br />
12<br />
<strong>Inc</strong>ludes all grassland nesting birds including upland gamebirds, as well as casualties identified as “unidentified<br />
bird”, “unidentified passerine”, “unidentified sparrow”<br />
13<br />
<strong>Inc</strong>ludes all nocturnal migrant passerines, as well as casualties identified as “unidentified bird”, “unidentified<br />
passerine”, “unidentified sparrow”. Spring and fall season horned lark and meadow lark casualities were not<br />
included as “migrants” because it was not known if the individual bird was a year-round resident in the <strong>Stateline</strong><br />
project or a migrating individual nesting elsewhere and passing through <strong>Stateline</strong>.<br />
<strong>Stateline</strong> <strong>Monitoring</strong> <strong>Final</strong> <strong>Report</strong> 17<br />
December 2004
irds, although the one fall trial using seven bat fatalities suggests scavenging rates may be<br />
similar or lower than for small birds (Figure 10 and 11). The estimated number of bat fatalities<br />
per turbine per year and associated 90% confidence limits for the <strong>Stateline</strong> <strong>Wind</strong> Facility using<br />
the two complete years of study is 1.12 (0.84, 1.35) 14 (Table 8 and Figure 14), resulting in an<br />
estimated 500 bat fatalities per year for the entire facility. Silver-haired (250/year for the 454<br />
wind turbines) and hoary bats (230/year for the 454 wind turbines) are estimated to comprise<br />
most of the fatalities.<br />
4.7 Lighting Effects and Other Analyses<br />
Observed nocturnal migrant and bat fatality rates for lit turbines, unlit turbines that are adjacent<br />
to lit turbines, and unlit turbines that are not adjacent to lit turbines were similar (p>0.10, Figure<br />
15). Pearson correlations were calculated among the all bird, bat, and nocturnal migrant fatality<br />
rates by plot. The largest observed correlation (r=0.31) was between bats and nocturnal<br />
migrants, but none of the associations were statistically significant (p>0.10). This analysis<br />
suggests the locations of bird fatalities in general, and nocturnal migrants are not strongly<br />
associated with the locations of bat fatalities in the <strong>Stateline</strong> <strong>Wind</strong> <strong>Project</strong>.<br />
Fatality rates were calculated by turbine string to investigate relationships between location<br />
within the wind project and bird and bat fatality rates (Figure 16). Relatively low variation in<br />
bird fatality rates among strings was observed for all birds combined, with no apparent outliers<br />
(very high or very low rates). Higher variation was observed in bat fatality rates among strings<br />
with no bat fatalities observed at three turbine strings and two strings with fatality rates<br />
approximately 2.5 times higher than the mean. It cannot be confirmed whether specific factors<br />
associated with these five strings are the cause of perceived lower or higher bat mortality, or if it<br />
is random chance. One of the strings with a higher bat fatality rate, BGC, is located in the<br />
southeast corner of the project area at a lower elevation (approximately 350 feet) than the HGA<br />
string, also with a higher bat fatality rate, which is located in the northern portion of the project<br />
site.<br />
4.8 Avian Use Surveys<br />
A standard 10-minute point count survey was conducted in conjunction with each carcass search.<br />
Approximately 1,600 counts were conducted between August 2001 and December 2003. Results<br />
of the surveys are reported in Tables 9-12. These data provide information on the species<br />
composition and levels of diurnal use of the project site. Fifty species were identified during the<br />
point counts at the <strong>Stateline</strong> <strong>Project</strong> Site (Table 9, August 2001 – December 2003).<br />
4.8.1 Avian Use and Frequency of Occurrence by Species<br />
A total of 5,125 individual bird detections within 2,429 separate groups of birds were recorded<br />
from August 2001 through December 2003 (Table 10) during the point count surveys. Slightly<br />
over 81% of the observations were of horned larks, western meadowlarks, Canada geese, and<br />
common ravens. All other species comprised less than 5% of the observations.<br />
14<br />
upper and lower limits of 90% confidence intervals (bootstrapping)<br />
<strong>Stateline</strong> <strong>Monitoring</strong> <strong>Final</strong> <strong>Report</strong> 18<br />
December 2004
Mean use estimates (number of birds/10-minute survey) were calculated (using detections within<br />
800m of each point) by species (Table 11). Canada goose (0.141/survey), common raven<br />
(0.097), red-tailed hawk (0.040), gray partridge (0.039), chukar (0.034), northern harrier (0.022),<br />
ring-necked pheasant (0.015), mallard (0.015), Swainson’s hawk (0.014), rough-legged hawk<br />
(0.013), and American kestrel (0.010) were the large bird species with the highest overall use.<br />
The small bird species with the highest use were horned lark (1.649), western meadowlark<br />
(0.334), European starling (0.041), and white-crowned sparrow (0.018). Horned lark, western<br />
meadowlark, and common raven were the only species observed on more than 5% of the<br />
surveys.<br />
4.8.2 Avian Use by Seasons and Groups<br />
Passerines were the most abundant group with 86.0% of the observations, while all other groups<br />
each comprised less than 7% of the observations (Figure 17).<br />
Passerines - Passerines were the most abundant avian group observed during all seasons (Figure<br />
18). Passerines showed higher abundance in the summer (2.833) compared to spring (2.239), fall<br />
(2.266) and winter (1.680).<br />
Raptors - Raptor use was second highest to passerines in the spring (0.143) and summer (0.129),<br />
third to passerines and upland gamebirds in the fall (0.085) and third to passerines and waterfowl<br />
in the winter (0.104) (Figure 18). Raptors made up less than 5% of avian use (Figure 17).<br />
Waterfowl/Waterbirds - The majority of waterfowl/waterbird use occurred in the winter, and<br />
consisted primarily of several groups of Canada geese. A large group of American white<br />
pelicans (40) was observed outside the 800-m view shed during the summer. In the spring, a<br />
large group of unidentified gulls (30) was also observed outside the 800-m view shed.<br />
4.9 <strong>Inc</strong>idental Wildife Observations<br />
A total of 1,007 individual bird detections within 223 separate groups were recorded incidentally<br />
from August 2001 through December 2003 (Table 12). Over 64% of the observations were of<br />
American pipits, sandhill cranes, and Canada geese, but they only made up 3% of the groups.<br />
All other species comprised less than 8% of the observations. Red-tailed hawks and Swainson’s<br />
hawks were the most frequently observed raptors.<br />
A total of 170 mammal detections within 101 groups were recorded incidentally (Table 12).<br />
Washington ground squirrels, white-tailed jackrabbit, and mule deer made up 87% of the<br />
observations.<br />
A total of 10 reptile detections were recorded including 7 northern pacific rattlesnakes, 2 yellowbellied<br />
racers, and a gopher snake (Table 12).<br />
4.10 Raptor Nest Surveys<br />
Burrowing owl nesting activity is described in a section 4.11 below. No golden eagle or prairie<br />
falcon nests were observed in the survey area during the 2002 and 2003 aerial surveys and none<br />
were documented prior to construction (FPL Energy and CH2M Hill 2000, FPL Energy 2001).<br />
Table 13 provides summary results for the 2001 pre-construction and the 2002-2003 post-<br />
<strong>Stateline</strong> <strong>Monitoring</strong> <strong>Final</strong> <strong>Report</strong> 19<br />
December 2004
construction surveys. Three buteo species were documented – red-tailed, ferruginous and<br />
Swainson’s hawk. A very similar number of active buteo nests was observed in 2001 prior to<br />
completion of construction compared to 2002 within 8 km (5 miles, 30 nests versus 32 nests) and<br />
within 3 km (2 miles, 11 nests versus 12 nests) of the <strong>Stateline</strong> 1 turbines (Table 13). In 2003,<br />
the enlarged survey buffer (inclusive of <strong>Stateline</strong> 1 and 2 turbines) added one additional buteo<br />
nest site that was located outside of the original <strong>Stateline</strong> 1 2001 and 2002 3 km (2 mile) buffer.<br />
There were a similar number of active buteo nests from 2001 (before most of the construction<br />
occurred) through 2003 within 3 km (2 miles) of the turbines; the largest number of active nests<br />
for all buteo species combined were observed in 2003.<br />
One ferruginous hawk nest in Washington and three in Oregon were monitored from the ground<br />
to determine their success. These nests occurred within two miles of <strong>Stateline</strong> 1 and <strong>Stateline</strong> 2<br />
turbines (Table 14). The nest in Washington was active and successfully fledged young in 2001<br />
and 2002, but vandals shot both adult birds in 2003 early in the nesting season. Similar<br />
vandalism was periodically documented in a two-county area of eastern Oregon from 1997<br />
through 2003. This was reported to the state and federal wildlife enforcement agents and an<br />
investigation is on-going. One historic ferruginous hawk nest in Oregon that was successful in<br />
2001 and 2002 was used in 2003 by great-horned owls. The second nest was active all three<br />
years and was successful in 2001 and 2003 but not in 2002. The third nest was not active in<br />
2001 but was active and successful in 2002 and 2003.<br />
Two Swainson’s hawk nests were monitored from the ground in 2001 and 2002 (Table 14). One<br />
historic nest in Oregon (#82, active intermittently since 1988) was active but not successful in<br />
2001 or 2002. In 2003 the old nest was repaired by Swainson’s hawks but was later abandoned.<br />
In 2001, 2002, and 2003 a common raven nested nearby, possibly impacting the pair of<br />
Swainson’s (interactions between the species were noted by field biologists). In addition, the<br />
historic nest tree has been dying for several years, resulting in weak branches and weak nest<br />
support. The other nest within 3 km (2 miles, #11) monitored in 2001 and 2002 was not active in<br />
2003. It was active in 2001 but later abandoned and did not produce young. In 2002 it was not<br />
active. The nest showed sign of having recent repair in 2003, and an adult Swainson’s hawk was<br />
near the nest early in the season, but the nest was not used. Great-horned owls were observed in<br />
the area and nested nearby.<br />
Three additional nests were located within the 2-mile buffer area in 2003. One new Swainson’s<br />
hawk nest was found in Washington approximately 3 km (2 miles) from the nearest turbine, near<br />
an historic Swainson’s hawk nest site. It was successful (fledged young), but the number of<br />
young successfully fledged could not be confirmed due to difficulty in accessing the site from<br />
the ground. Two new Swainson’s hawk nest sites were found in Oregon within 3 km (2 miles)<br />
of the turbines; one having been used by ferruginous hawks several years prior (#150, Kronner,<br />
field notes 1987-1996). Table 14 describes proximity to turbines for the two new nests. Nest<br />
#139 was constructed by Swainson’s hawks and had some activity early to mid-season but was<br />
later abandoned. Nest #150 was active and successfully produced two young but just prior to<br />
fledging, one young and one of the adults were found dead from gunshots. Both were found on<br />
the ground under the nest. This was reported to the state and federal wildlife law enforcement<br />
agents and an investigation is on-going.<br />
<strong>Stateline</strong> <strong>Monitoring</strong> <strong>Final</strong> <strong>Report</strong> 20<br />
December 2004
In summary, nesting by sensitive raptor species and common buteo raptor species after<br />
construction of <strong>Stateline</strong> 1 and 2 was slightly higher than the year prior to construction. Species<br />
have shifted locations somewhat over the monitoring period. As of 2003, sensitive species are<br />
still nesting in the area at approximately the same levels. Common ravens are somewhat more<br />
abundant than noted historically (K. Kronner, pers. comm) prior to construction and one new<br />
nest was discovered. In 2003 vandals reduced the number of successful ferruginous hawk nests<br />
and reduced the number of young fledged at one Swainson’s hawk nest from two potentially<br />
fledged to one fledged.<br />
4.11 Burrowing Owl Surveys<br />
<strong>Monitoring</strong> of nesting burrowing owls consisted of conducting surveys in habitat near turbines<br />
and checking historic nest sites, some not located near the turbines (Section 3.5). Table 15<br />
displays the active sites documented prior to the first monitoring year in 2002 and includes new<br />
sites discovered during the monitoring or during other on-site activities.<br />
In 2002, five historic burrowing owl nest sites initially discovered in 2001 or earlier were<br />
checked for activity (two in Washington, three in Oregon). One of two historic nest sites in<br />
Washington was active again in 2002 (ID 1, Table 15). A complex of three burrows was located<br />
112 m (367 ft) from turbine HGF-1. It was not possible to determine if there were one or two<br />
breeding pairs. Ten birds were seen on June 16 in 2002, and most were juveniles. The other<br />
historic nest site in Washington was approximately 400 m (1,300 ft) east of turbine string PB<br />
along a closed farm road (ID 3). The specific burrows were not active in 2002, but a new site (a<br />
different complex of burrows) with three burrows was found in 2002 just south of this historic<br />
site. Two adults were observed there during the June 19, 2002 survey; none were observed July<br />
1, 2002. In Oregon, three historic nest sites were checked. One of the three sites was active. A<br />
new active site was discovered in 2002 during pre-construction surveys for the <strong>Stateline</strong><br />
expansion (FPL Energy 2002). The site was very near (396 m [1,300 ft]) one of the two, inactive<br />
historic sites.<br />
In 2002 two new active burrowing owl nest sites were found during surveys in Washington. On<br />
June 23, a new site was found with observations of one adult and one juvenile at one new burrow<br />
located approximately 180 m (587 ft) from turbine HGH-9 (ID 4, Table 15). One owl (age<br />
unknown) was detected at a nearby new burrow located 229 m (752 ft) from turbine HGH-9.<br />
Three (unknown age) owls were observed at the same site (but not at the same burrow) during<br />
the second survey conducted on July 9. The other new site (burrows) was found on June 26<br />
approximately 111 m (365 ft) from HGC-14 (ID 5). One adult was observed. Two adults were<br />
observed at the same site during the second survey conducted on July 5. Due to the limited<br />
survey corridor size it is not known if the birds were present in the adjacent landscape in<br />
previous years.<br />
In 2003 no new burrowing owl nest sites were located while conducting the surveys in and<br />
adjacent to the fatality monitoring plots. Two historic nest sites and the new 2002 nest sites were<br />
checked. One of these sites (111 m, 365 ft from HGF-1) that had been active since 2000 could<br />
not be confirmed as active in 2003 (ID 1, Table 15), but several active burrows (likely two pairs<br />
of owls) were discovered within 299 m (980 ft) of the original site (ID 2). The other historic nest<br />
site located 488 m (1,600 ft) east of turbine string PB that was active prior to construction but not<br />
<strong>Stateline</strong> <strong>Monitoring</strong> <strong>Final</strong> <strong>Report</strong> 21<br />
December 2004
during the 2001-2002 construction/operations period was active in 2003 (ID 3), as well as a<br />
nearby nest site that was first discovered in 2002. Further north, near a project access road,<br />
approximately 2 km (1.25 miles) from the nearest turbine, a new active nest site was discovered<br />
(ID 6).<br />
In Oregon, one historic nest site that was last active in 1999 (prior to construction) remained<br />
inactive in 2003 (ID 7, Table 15). A coyote den was noted in the nearby area. Another site that<br />
was active in 2001 during construction of an underground electrical line 1.6 km northwest of<br />
turbine string BGB was not active in 2002 or 2003 (ID 8). A nearby nest site first discovered in<br />
2002 was not active in 2003 (ID 9). However, two nest sites were discovered within<br />
approximately 400 m (1300 ft) of the 2002 nest site in 2003; one was abandoned due to some<br />
grassland (CRP) tilling (ID 10), the other successfully produced young (ID 11). Another new<br />
nest site was discovered within 305 m (1,000 ft) of BGB-16 while conducting walking transects<br />
for presence of Washington ground squirrels (ID 12). Further east, a nest site active in 2001 and<br />
2002 was active again in 2003 (ID 13).<br />
Sample sizes for statistically determining impacts to burrowing owls are limited. Based on this<br />
limited information, burrowing owl nesting activity appears to have continued at similar levels<br />
for at least two years after construction of <strong>Stateline</strong> 1 and 2 compared to the year prior to<br />
construction, with some apparent natural shifts in nest site locations independent of the facility<br />
and its associated human activity.<br />
4.12 Short-eared Owl Surveys<br />
In 2002 no owls were detected during project surveys. A project site security guard said he<br />
observed short-eared owls flying from areas near turbine strings HGE and HGF over Hatch<br />
Grade Road west to turbine string HGG. Three short-eared owls were observed while biologists<br />
conducted other monitoring tasks. Observations were recorded near turbines WSA-45, WSB-58,<br />
and HGJ-44 in the May-June period in grassland.<br />
In 2003, two short-eared owls were observed on March 7 between turbine strings BGB and<br />
WSB. This is near where one was seen during the pre-construction surveys conducted in 2002<br />
(FPL Energy 2002).<br />
4.13 Grassland Bird Displacement Surveys<br />
Table 16 contains the mean number of observations recorded during pre-operation and during the<br />
first year of operation for four species (grasshopper sparrow, horned lark, savannah sparrow, and<br />
western meadowlark) and for all grassland passerines combined. Grassland species combined<br />
had very similar overall use estimates in the pre and post-construction periods (0.578<br />
observations/survey to 0.583 observations/survey). Two species had estimated increases in use<br />
during the post-construction period (horned lark and savannah sparrow) while the other two<br />
species showed decreases (grasshopper sparrow and western meadowlark). Only grasshopper<br />
sparrow had a statistically significant change 15 (p
Based on preliminary data, grassland passerines as a group showed a statistically significant<br />
decline (p
5.0 SUMMARY/DISCUSSION<br />
5.1 Assumptions<br />
The 2001 fatality data were not included in the calculation of fatality estimates because of<br />
difficulty in incorporating the highly variable search efforts within a portion of two seasons (fall<br />
and winter). The 2001 data was included in calculations of the fatality estimates in the 2001-<br />
2002 annual report (Erickson et al. 2003a), and contributed to the lower annual fatality estimate<br />
in that report. The overall mortality estimates for raptors would also be less if 2001 data were<br />
included, since no raptor fatalities were observed in search plots in 2001. Reasonably consistent<br />
data (7 or 8 searches) were gathered at six plots from August through December 2001 (Appendix<br />
B-1). At these six plots, 6 bird (all small) and 19 bat carcasses were observed. Using this very<br />
limited information from six months of data collection, 2001 bird fatality rates would be less<br />
than the average of the estimates from 2002 and 2003. Estimated bat fatality rates would be<br />
higher than the average of the estimates from the 2002 and 2003, based on the limited<br />
information collected in 2001.<br />
All bird casualties observed within standardized search plots in 2002 and 2003 were included in<br />
the fatality estimates. True cause of death is unknown for most of these fatalities. Several of the<br />
horned lark fatalities are suspected to be caused by vehicles (e.g., vehicles from wind turbine<br />
maintenance personnel, other vehicles) and not by wind turbines, given the locations of the finds<br />
near public and private roads. There is likely some background 14 mortality that is included in the<br />
fatality rate estimates. An unknown number of the fatalities likely are caused by other factors<br />
not related to the wind facility (e.g., caused by raptors, coyotes, and long-tailed weasels). No<br />
comparable background information on natural fatality rates is known for the <strong>Stateline</strong> <strong>Wind</strong><br />
Facility.<br />
A few wind project studies have provided information on background mortality. During a fouryear<br />
study at Buffalo Ridge (Minnesota), 2,482 fatality searches were conducted on study plots<br />
without turbines to estimate reference mortality in the study area, and 31 avian fatalities<br />
comprising 15 species were found (Johnson et al. 2000). Reference mortality consisted of eight<br />
upland gamebirds, seven doves, five sparrows, three waterfowl, three raptors, two blackbirds,<br />
one waterbird, one shorebird, and one unidentified bird. The exact cause of death of many birds<br />
found in reference plots could not be determined; however, most appeared to have been caused<br />
by predators or vehicles. Reference mortality was estimated to average 1.1 fatalities per plot per<br />
year, compared to 0.98, 2.27, and 4.45 fatalities per turbine search plot per year in the Phase 1, 2<br />
and 3 wind plants, respectively (Johnson et al. 2000). Some pre-project carcass searches were<br />
conducted at a proposed wind project in Montana (Harmata et al. 1998). Three bird fatalities<br />
were found, two presumed raptor kills and another from an unknown cause during 8 searches of<br />
5 transects, totaling 17.61 km per search. On average, approximately 5.6 km of transect is<br />
searched within every three-turbine search plot at <strong>Stateline</strong>. Therefore, the amount of transect<br />
searched at the Montana site per search was equivalent to searching approximately 9 turbines at<br />
<strong>Stateline</strong>. The background estimate for observed mortality would be approximately 0.33 per<br />
turbine plot per year, which is unadjusted for scavenging and searcher efficiency. This<br />
14 fatalities that were caused by factors unrelated to the <strong>Stateline</strong> <strong>Wind</strong> <strong>Project</strong> (e.g., predator kills, farm equipment<br />
collisions)<br />
<strong>Stateline</strong> <strong>Monitoring</strong> <strong>Final</strong> <strong>Report</strong> 24<br />
December 2004
ackground mortality information from Minnesota and Montana suggest that the estimates of<br />
bird fatality rates likely include some avian fatalities not related to turbine collision, and this<br />
factor alone would lead to an over-estimate of true avian collision mortality at wind plants.<br />
However, avian behavioral changes after a wind facility is built (e.g., avoidance) are not<br />
calculated into the background fatality estimates at Buffalo Ridge and Montana.<br />
No adjustments were made for fatalities possibly occurring outside of the rectangular plot<br />
boundaries. Plot boundaries were established a minimum distance of 63 m from the turbines and<br />
can extend up to 94 m at the end of the strings (Figure 3). This search plot distance was selected<br />
based on results of other studies (Higgins et al. 1996) where this distance appeared to capture a<br />
very large percentage of fatalities at turbines of similar sizes. Based on the distribution of<br />
fatalities as a function of distance from turbines (Figure 4), a small percentage of bird fatalities<br />
likely were located outside the search plots and would have been missed. The distribution of bat<br />
fatalities at this site (Figure 4) and at other sites (e.g., Erickson et al. 2003b, Johnson et al.<br />
2003a, Kerlinger and Kerns 2004) suggest bat casualties are located closer to turbines than bird<br />
casualties. This factor alone would lead to an underestimate of bird and to a lesser extent of bat<br />
fatality rates. Neither this factor, nor a factor for reference or background mortality, was<br />
accounted for in the fatality estimates.<br />
The carcass removal and observer detection trial carcasses are believed to be reasonably<br />
representative of actual fatalities and the protocol for the carcass removal trials are designed to<br />
simulate actual fatalities as much as possible. It would be preferred to use “fresh” trial carcasses<br />
that have not been frozen in carcass removal trials, although this is not practical. Rock doves<br />
and hen pheasants comprised most of the moderate to large sized birds used in the trials. Game<br />
bird chicks and house sparrows represented most of the small birds. Native bird carcasses that<br />
meet suitability criteria for trials were used when available. They were obtained from local<br />
wildlife rehabilitators and state agencies or were collected as road-kills (all authorized with<br />
permits). The trial carcasses were frozen; most were in the freezer for less than 6 months. The<br />
carcasses were left at room temperature for approximately 8 to 24 hours before the trial began.<br />
Ravens were observed in a few cases following the technicians who were placing carcasses for<br />
searcher efficiency and carcass removal trials. In a few instances, these trial carcasses were<br />
removed very quickly by these scavengers. This visual cue by scavengers has the potential to<br />
bias carcass removal rates, and lead to subsequent bias in fatality rates. In future carcass removal<br />
studies when ravens and other scavengers are cueing in on personnel who are placing trial<br />
carcasses, carcasses should be placed randomly before daybreak to reduce or eliminate this<br />
source of bias.<br />
In most fatality monitoring studies, including Nine Canyon (Washington) and <strong>Stateline</strong>, small<br />
birds were used to represent bats for carcass removal. In a few studies, very fresh bat carcasses<br />
(estimated to die the previous night) were available for use in some trials (Johnson et al. 2003a).<br />
These two studies suggest similar to lower scavenging rates on bat carcasses compared to small<br />
bird carcasses; however, sample sizes were low, especially at <strong>Stateline</strong>, and the bat trial<br />
carcasses, although believed to have died within the past 24 hours, may have had characteristics<br />
slightly different from a fresh bat carcass that could influence attractiveness to scavengers.<br />
Research regarding this issue is being coordinated by Bat Conservation International at two wind<br />
energy facilities in the eastern U.S., with participation by <strong>WEST</strong> <strong>Inc</strong>. (Erickson et al. 2004a).<br />
<strong>Stateline</strong> <strong>Monitoring</strong> <strong>Final</strong> <strong>Report</strong> 25<br />
December 2004
For this study, bird carcass removal data from the entire study period was used for bats, since the<br />
overall mean removal time estimate (16.7 days) was very similar to the estimates for the fall<br />
(17.0 days) when the majority of the bat fatalities occurred.<br />
Carcass removal rates at the <strong>Stateline</strong> <strong>Wind</strong> <strong>Project</strong> were low relative to most other wind<br />
projects, including Buffalo Ridge, Minnesota, Foote Creek Rim, Wyoming, and Nine Canyon,<br />
Washington (Erickson et al. 2003b), and were similar to the nearby Vansycle <strong>Wind</strong> <strong>Project</strong><br />
(Erickson et al. 2000). Observer detection rates for the <strong>Stateline</strong> Facility were similar to rates at<br />
the Vansycle <strong>Wind</strong> <strong>Project</strong> (Erickson et al. 2000). Potential variation in carcass removal rates<br />
should be considered when designing mortality studies.<br />
5.2 Bird Fatality Estimates<br />
The overall bird fatality rate observed at <strong>Stateline</strong> (1.93 per turbine per year based on average of<br />
2002 and 2003 estimates [Table 8]) is slightly lower than the average bird fatality rates reported<br />
for new generation wind projects in the U.S. (2.11 per turbine per year, Erickson et al. 2004b).<br />
Fatality estimates on a per turbine basis may be misleading when comparing different wind<br />
energy projects, since turbine sizes vary among projects. For example, the Vestas V-47 turbines<br />
at <strong>Stateline</strong> are 0.66-kW turbines with a rotor swept area of approximately 1735 m 2 . In<br />
comparison, the turbines at Nine Canyon are 1.3-MW turbines with a rotor swept area of 3019<br />
m 2 . Fatality estimates for smaller turbines may be less per turbine than for larger turbines, but<br />
this may be misleading since it would take more small turbines to generate the same amount of<br />
electricity. Therefore, to better account for differences in turbine size and output, other metrics<br />
have been proposed (Erickson et al. 2004b, Smallwood and Thelander 2004). One such metric<br />
for comparing fatality rates among sites is on a per MW capacity output per year. Using this<br />
metric, the <strong>Stateline</strong> bird fatality estimate per MW capacity per year (2.9) is slightly below the<br />
average for new generation wind projects in the U.S (3.05, Erickson et al. 2004b), and within the<br />
range reported for sites in the Columbia Basin and Rocky Mountain region (Figure 21). Bird<br />
fatality estimates at new projects have been fairly consistent, with the possible exception of the<br />
Buffalo Mountain Tennessee site (Figure 21). The OWMP stated “The certificate holder shall<br />
calculate the “all birds” estimate and the “small birds” estimate for all species and, separately,<br />
for only those species protected by law”. In this case, “protected by law” means species<br />
protected under the Migratory Bird Treaty Act and upland gamebirds protected under state law.<br />
Three European starlings, which are not protected under the MBTA or other regulations, were<br />
included in the <strong>Stateline</strong> fatality estimate. By excluding these, the fatality estimate for the<br />
<strong>Stateline</strong> <strong>Wind</strong> <strong>Project</strong> for all other birds would be approximately 1.89 fatalities per turbine per<br />
year or 2.8 fatalities per MW capacity per year. By excluding these three European starlings,<br />
small bird fatality estimates would be 1.65 fatalities per turbine per year or 2.5 fatalities per MW<br />
capacity per year.<br />
5.3 Relative Risk of Collision and Species Impacts<br />
Fatality rates alone do not provide information on what species are most susceptible to collision.<br />
Comparing the ratio of % composition of fatalities to relative abundance among species is useful<br />
for understanding the relative risk of collision with turbines of individual species (Anderson et<br />
al. 1999). Species commonly observed during avian use surveys but infrequently found as a<br />
fatality may be considered less susceptible to collision. Species commonly observed as a<br />
fatality, but infrequently observed during avian use surveys may be considered more susceptible<br />
<strong>Stateline</strong> <strong>Monitoring</strong> <strong>Final</strong> <strong>Report</strong> 26<br />
December 2004
to collision. Species that are commonly observed as a fatality may also be commonly observed<br />
during avian use surveys. Some example species that fall into these different “susceptibility”<br />
categories are discussed below. Nearly 40% of bird fatalities observed on search plots were<br />
composed of horned larks, a very common yearlong resident songbird, and over half of the bird<br />
observations from point counts were horned larks. This suggests that horned larks are the most<br />
commonly found fatality and fatality rates appear in proportion to their abundance. Horned larks<br />
are year-round residents from southern British Columbia east to southern Manitoba, south along<br />
the west coast of the United States to Mexico, and to the east coast. Horned larks are one of the<br />
most common birds observed in the Columbia Plateau, which is the Breeding Bird Survey (BBS)<br />
physiographic province between the Rocky Mts. and the Cascade Range in Washington, Oregon,<br />
Idaho, and Nevada (Sauer et al. 2003). Crudely extrapolating BBS data collected in the<br />
Columbia Plateau, similar to the approach used in Bart (2004 in press), it is estimated that<br />
approximately 10,000,000 to 20,000,000 million horned larks exist within the Columbia Plateau.<br />
Based on observations over several years in the <strong>Stateline</strong> wind facility area, the numbers<br />
fluctuate somewhat from season to season, and in winter they are commonly observed in larger<br />
flocks than in spring or summer. No other individual species comprised more than 10% of the<br />
fatalities.<br />
The next most abundant fatality, golden-crowned kinglet, does not breed in the vicinity of the<br />
<strong>Stateline</strong> project, and was not observed during diurnal avian use surveys. This species likely was<br />
migrating through the project area at night. This songbird nests primarily in coniferous forests<br />
and is often found in dense stands of spruce and fir trees. The golden-crowned kinglet breeds in<br />
Alaska, Canada, and mountains of the Pacific Northwest and Rocky Mountain region. This<br />
species winters in southern Canada, throughout the United States (excluding southern Florida),<br />
and south to Central America. During the avian baseline study conducted in 1994-1995 for the<br />
Vansycle and <strong>Stateline</strong> wind projects (FPL Energy et al. 2001) golden-crowned kinglets were not<br />
observed in the Oregon or Washington <strong>Wind</strong> Resource Area where point counts were conducted<br />
during the one-year study but they were observed during spring and fall while surveyors were intransit<br />
to and from the avian plots. In Oregon, they were observed along access roads in canyons<br />
where more trees and shrubs provide cover for migrating birds.<br />
There are also a few species, including common ravens and rough-legged hawks, that were<br />
commonly observed during avian use surveys but no fatalities were observed, suggesting these<br />
species may be less susceptible to collision. Common ravens do not appear very susceptible to<br />
collision with wind turbines in other studies as well (Erickson et al. 2002). Rough-legged hawks<br />
are one of the most common wintering raptors at most new generation wind projects studied in<br />
the Pacific Northwest (Erickson et al. 2002), but we are aware of only one fatality at a new<br />
generation wind project.<br />
<strong>Stateline</strong> <strong>Monitoring</strong> <strong>Final</strong> <strong>Report</strong> 27<br />
December 2004
5.4 Raptor Fatalities<br />
The thirteen raptor fatalities 15 observed on the standardized search plots equated to an overall<br />
estimate of 0.06 raptor fatalities per turbine per year for the project. If the limited search effort<br />
in 2001 had been included, the estimates would be lower, since no raptor fatalities were observed<br />
on search plots. This rate was very consistent between the 2002 and 2003 monitoring years,<br />
although composition of fatalities differed among years. Four of the five American kestrels were<br />
found in 2003, while 6 of the 9 red-tailed hawks were observed in 2002. Four additional raptor<br />
fatalities were found at turbines not searched and were documented using the WRRS. Nine of<br />
the 17 raptor fatalities were observed in Washington, all in 2001 and 2002, and the other eight<br />
raptor fatalities were found in Oregon, all in 2003. Seven of the thirteen raptor fatalities found<br />
on standardized search plots were found along two strings: HGA and BGB. However, no raptors<br />
were found on HGA in 2003 and no raptors were found at BGB in 2002. It is unclear if the<br />
perceived higher mortality at HGA and BGB in one of two years are due to factors related to that<br />
location, location and year, or to random chance.<br />
A single adult ferruginous hawk fatality was detected on July 18, 2003 near turbine HGM13 in<br />
Oregon. The nearest active ferruginous hawk nest was approximately 0.8 km (0.5 miles) from<br />
HGM13. This nest was within 342 m (1122 feet) of turbine string HGK. This nest had<br />
successfully fledged two young in 2003. It is not known if the fatality was an adult from this<br />
nest. A single Swainson’s hawk fatality, also an adult, was detected on August 12, 2002 near<br />
turbine HGA9. The nearest known active Swainson’s hawk nest was over two miles northwest<br />
of HGA9. It is not possible to determine if these fatalities were local breeding birds or postbreeding<br />
transients from another region. The red-tailed hawk fatalities were a mixture of<br />
juvenile and adult birds, while the American kestrel fatalities were adults. Future nest<br />
monitoring of the target raptor species (Swainson’s hawks and ferruginous hawks) will provide<br />
information on whether nests, especially those nearest the wind project, continue to be occupied.<br />
Burrowing owls successfully nested in close proximity to turbines and no fatalities were<br />
observed during the study. Recent studies at the Altamont Pass WRA in California documented<br />
a high incidence of burrowing owl fatalities at older generation small turbines (Smallwood and<br />
Thelander 2004). Burrowing owl nest densities at the Altamont have not been measured, but the<br />
species is commonly observed residing within the WRA near turbines (Smallwood and<br />
Thelander 2004). Smallwood and Thelander (2004) suggest repowering the Altamont Pass<br />
WRA with larger taller turbines might greatly reduce burrowing owl fatalities. This information<br />
and our limited information at <strong>Stateline</strong> suggests burrowing owl collision risk at the <strong>Stateline</strong><br />
wind facility and other new generation wind energy facilities may be lower than collision risk for<br />
smaller turbines such as those at the Altamont. The cause of the perceived differences in<br />
collision risk is unknown, but related factors may include clearance area below turbine blades<br />
and other characteristics. Repowering (replacing old turbines with new larger turbines) is<br />
currently being implemented at a limited scale within the Altamont Pass, and monitoring will<br />
provide more direct measures of the differences in risk between new and old turbines.<br />
15 Eleven were found during standardized searches, and two were found on a standardized search plot but not during<br />
a scheduled search (reported incidentally)<br />
<strong>Stateline</strong> <strong>Monitoring</strong> <strong>Final</strong> <strong>Report</strong> 28<br />
December 2004
5.5 Nocturnal Migrants and Lighting<br />
Tall lighted structures are suspected of attracting nocturnal migrating birds, especially during<br />
inclement weather (Kerlinger 2000). Lighting at communication towers is typically different<br />
than lighting at wind turbines. Communication towers commonly have more than one light<br />
location on a tower, while wind turbines have only one location for the light (on top of the<br />
nacelle, see FAA circular on lighting). Communication towers often have one red pulsating or<br />
flashing light on the top of the tower, and several solid red lights at various heights.<br />
Communication tower lighting may be more of an attractant than wind turbine lighting<br />
(Kerlinger 2003), but research and data are limited.<br />
Nocturnal migrant and bat fatality rates for lit turbines, turbines adjacent to lit turbines, and<br />
other unlit turbines were compared. Observed fatality rates at lit turbines were slightly higher<br />
than at unlit turbines, although none of the differences were statistically significant (p>0.10).<br />
Based on this information, it is unlikely that lights on <strong>Stateline</strong> turbines attracted large numbers<br />
of birds or bats during this study. Similar results were found at the Nine Canyon wind project<br />
(Erickson et al. 2003b), which has the same lighting characteristics (red-flashing at night) but on<br />
larger and taller turbines than <strong>Stateline</strong> turbines. The Buffalo Ridge wind project (Johnson et al.<br />
2002) showed a similar result for turbines similar in size to <strong>Stateline</strong>, although lighting types<br />
differ (solid red incandescent). Turbines in Phase I of the Buffalo Ridge wind project were not<br />
lit. Phase II of the project had approximately every other turbine lit (approximately 70 of 143<br />
turbines) with solid red lights. Six of the 138 Phase III turbines along the outer boundary of the<br />
site were lit with solid red lights.<br />
Several factors may be the cause for this lack of an association between lighting and fatalities at<br />
this location and the other locations. The height of the turbines and rotors (74 m, 242 ft) are<br />
below the heights of tall communication towers associated with large fatality events, and no<br />
large single mortality event has been reported at a wind project. Only two small events have<br />
been reported. At Buffalo Ridge in Minnesota, fourteen migrating passerine fatalities (vireos,<br />
warblers, flycatchers) were found at two turbines during a single night in May 2002 (Johnson et<br />
al. 2002), with one of the turbines lit and the other unlit. Approximately 25 to 30 migrating<br />
passerine fatalities (mostly warblers and vireos) were observed near three turbines and a well-lit<br />
substation at the Mountaineer wind project in West Virginia during a foggy night (Kerlinger and<br />
Kerns 2004). The data suggest that sodium vapor lamps at the substation were the primary<br />
attractant, since fatality locations were correlated with the location of the substation, and the<br />
other turbines away from the substation had few fatalities documented the morning after the<br />
event. After the lights were turned off at the substation, no events occurred. Research is<br />
currently being conducted at some communication towers in Michigan to test the effect of<br />
lighting on migrant bird mortality (Gehring pers. comm. 2004).<br />
Some studies and observations have documented migrating birds being attracted to structure<br />
lights, especially during inclement weather, apparently leading to large mortality events at tall<br />
communication towers. Light type (solid, flashing, strobe), color (red, white), and intensity (low,<br />
medium, high) may be important factors in the attractiveness to birds, but these factors are not<br />
well understood. Solid colored, high intensity lights may be more attractive to migrating birds<br />
than other types (Manville pers. comm.). Lighting of turbines at wind projects has varied, and is<br />
<strong>Stateline</strong> <strong>Monitoring</strong> <strong>Final</strong> <strong>Report</strong> 29<br />
December 2004
dictated by FAA requirements for a particular location. Some wind projects with turbines taller<br />
than 61 m (200 ft) have not been required to light turbines (e.g., Foote Creek Rim).<br />
5.6 Grassland Bird Displacement<br />
Preliminary results suggest a relatively small-scale impact of the wind facility on grassland<br />
nesting passerines, with a large portion of the impact due to direct loss of habitat from turbine<br />
pads and roads and temporary disturbance of habitat between turbines and road shoulders.<br />
Small-scale displacement impacts to grassland nesting birds have been documented in two other<br />
studies (Leddy et al. 1999, Johnson et al. 2000). The level of displacement of grassland birds by<br />
development of the <strong>Stateline</strong> wind facility and its associated operations will be further elucidated<br />
after future surveys are conducted. Although temporarily disturbed areas were reseeded, this<br />
revegetation is not likely to produce similar habitat to pre-construction conditions for several<br />
years. Additional grassland bird displacement data collected in 2006 and possibly in 2008 will<br />
provide better information on impact levels and causes (e.g., loss of habitat or displacement from<br />
turbines and vehicles). Several other studies of indirect impacts to grassland songbirds are ongoing<br />
at proposed and existing wind projects in Colorado (Ryder pers. comm.), North Dakota<br />
(Shaffer and Johnson 2003), South Dakota (<strong>WEST</strong> 2004), and Montana (Erickson and<br />
Hazelwood 2004), and these should provide a better understanding of impacts, including<br />
estimation of effects for several individual species.<br />
5.7 Raptor Nesting and Owl Use<br />
Nesting by sensitive raptor species and common buteo raptor species after <strong>Stateline</strong> 1 and 2 were<br />
constructed was slightly higher than the year prior to construction. Species shifted locations<br />
somewhat over the monitoring period. Based on extensive monitoring using helicopter flights<br />
and ground observations, sensitive species still nested in the area at approximately the same<br />
levels. Burrowing owls were present in similar locations to those documented during preconstruction<br />
investigations. New nest sites were discovered in the wind facility after<br />
construction, though some of these were likely natural fluctuations of site selection within the<br />
landscape. Short-eared owls were not a common species detected during the pre-construction<br />
surveys or after construction within and adjacent to the wind facility. A few were found during<br />
supplementary wildlife surveys conducted after construction.<br />
5.8 Bat Fatality Estimates<br />
The overall bat fatality rate for <strong>Stateline</strong> (1.12 per turbine per year) is below the average bat<br />
fatality rates reported for new generation wind projects in the U.S. (1.5 per turbine per year).<br />
Similarly, the <strong>Stateline</strong> bat fatality estimate per MW capacity per year (1.7) is below the average<br />
rate for new generation wind projects in the U.S. (2.1) and is within the range reported for the<br />
sites in the Pacific Northwest and the West (Figure 22). Bat fatality estimates at new projects are<br />
more variable (Figure 22) than bird estimates, with the highest estimates occurring at sites in the<br />
east (Nicholson 2003, Kerlinger and Kerns 2004).<br />
Species composition was similar to composition at other sites in the Pacific Northwest (Johnson<br />
et al. 2004). Only one bat casualty (silver-haired bat on May 15 th 2003) was found between<br />
January 1 and June 30, 2002 and 2003 in Oregon or Washington during standardized searches.<br />
Virtually all bat fatalities were found in the late summer and fall during the time period when<br />
both silver-haired and hoary bats are migrating and these two species comprised 96.1% of the<br />
<strong>Stateline</strong> <strong>Monitoring</strong> <strong>Final</strong> <strong>Report</strong> 30<br />
December 2004
fatalities. Little is known about the details of hoary bat and silver-haired bat migration in<br />
Oregon and Washington (Hayes and Waldien 2000). Fatality rates at this project and other<br />
projects in the West and Midwest are much lower than estimates from two of the most recently<br />
studied wind projects in the East (Kerlinger and Kerns 2004, Nicholson 2003). Bat Conservation<br />
International (BCI), the American <strong>Wind</strong> Energy Association (AWEA), the U.S. Fish and<br />
<strong>Wildlife</strong> Service, and the U.S. Department of Energy’s National Renewable Energy Laboratory<br />
(NREL) have initiated a research effort to understand bats and wind turbine interactions and how<br />
bat fatalities can be prevented or minimized. FPL Energy is participating in this research effort.<br />
Funding has been provided to support BCI in coordinating the research.<br />
5.9 Additional <strong>Monitoring</strong><br />
Components of the study will be continued, including: 1) the <strong>Wildlife</strong> Response and <strong>Report</strong>ing<br />
System (WRRS) for documentation and reporting of incidentally discovered bird fatalities for the<br />
duration of the project, 2) grassland bird displacement studies, 3) fatality monitoring in the<br />
<strong>Stateline</strong> 2 area in 2006, and 4) raptor nest monitoring studies. There are also requirements for<br />
additional standardized fatality monitoring, grassland bird displacement, and raptor nest surveys<br />
if new turbines are built (OEFSC 2003).<br />
6.0 ACKNOWLEDGEMENTS<br />
We would like to thank FPL Energy for funding and other support for this project. We would<br />
especially like to thank Tara Dinman, Denny George, Vito Giarrusso, Jim Lindsay, Rick Lynn,<br />
Don Miller, Joanie Stewart, and Anne Walsh of FPL Energy. We would like to thank all the<br />
landowners in the project area for their continued cooperation in allowing property access. We<br />
thank helicopter pilot Cliff Hoeft of South County Helicopters, <strong>Inc</strong>., who safely and<br />
unobtrusively negotiated the helicopter near raptor nests. We appreciate the comments, support,<br />
and meeting attendance of the <strong>Stateline</strong> Washington Technical Advisory Committee members<br />
including Mark Grandstaff 16 (Washington Department of Fish and <strong>Wildlife</strong>), Howard Browers 16<br />
(U.S. Fish and <strong>Wildlife</strong> Service), Mike Denny 16 (Blue Mountain Audubon), Shirley Muse (Blue<br />
Mountain Audubon), Denny George (FPL Energy) 16 , Jim Lindsay (FPL Energy), Anne Walsh<br />
(FPL Energy), Vito Giarrusso (FPL Energy), Hugh Preston 16 (landowner), Cliff Bracher 16<br />
(landowner), Pete Harvey 16 (Whitman College, landowner), Connie Krueger and Ken Kuhn<br />
(Walla Walla County Regional Planning Department), Dennis Olsen and Tamra Mabbott<br />
(Umatilla County Department of Resources Services and Development), Chris Brong (U.S. Fish<br />
and <strong>Wildlife</strong> Service),and Lynn Thompkins (Blue Mountain <strong>Wildlife</strong> Rehabilitation Center). We<br />
are very appreciative of Lynn Thompkins’ successful rehabilitation of the injured Swainson’s<br />
hawk. We also appreciate report comments and support from John White and Tom Meehan of<br />
the Oregon Department of Energy, and Mark Kirsch, Kevin Blakley, and Gail McEwen of the<br />
Oregon Department of Fish and <strong>Wildlife</strong>. <strong>Final</strong>ly, we want to acknowledge the field personnel<br />
who conducted the carcass searches, often under very difficult environmental conditions (see<br />
page v for the list of project participants).<br />
16 indicates this person is a primary voting member of the <strong>Stateline</strong> Technical Advisory Committee<br />
<strong>Stateline</strong> <strong>Monitoring</strong> <strong>Final</strong> <strong>Report</strong> 31<br />
December 2004
7.0 REFERENCES<br />
Anderson, R., M. Morrison, K. Sinclair and D. Strickland. 1999. Studying wind energy/bird<br />
interactions: A guidance document. National <strong>Wind</strong> Coordinating Committee/RESOLVE,<br />
Washington, D.C. 87pp.<br />
Anthony, E.L.P. 1988. Age determination in bats. Pages 47-58 in T. H. Kunz, editor.<br />
Ecological and behavioral methods for the study of bats. Smithsonian Institution,<br />
Washington, D.C., USA.<br />
Bart. J. 2004 in press. Estimating total population size for songbirds. Bird Populations.<br />
Erickson, W.P., J. Kerns, and E. Arnett. 2004a. Bat Mortality at <strong>Wind</strong> Energy Facilities during<br />
Fall Migration: A Proposal for Intensive Mortality Searches. Peer-reviewed research<br />
proposal and field protocol. Bats and <strong>Wind</strong> Energy Cooperative. Bat Conservation<br />
International.<br />
Erickson, W.P., G.D. Johnson, and D.P. Young. 2004b. Summary of anthropogenic causes of<br />
bird mortality. Proceedings of the 2002 International Partner’s in Flight Conference,<br />
Monterrey, California.<br />
Erickson, W.P. and R. Hazlewood. 2004. Avian and Bat <strong>Monitoring</strong> Plan for the Judith Gap<br />
<strong>Wind</strong> Farm, Wheatland County, Montana. Protocol prepared for FPL Energy. <strong>WEST</strong><br />
<strong>Inc</strong>., 2003 Central Ave., Cheyenne, WY 82001.<br />
Erickson, W.P., J. Jeffrey, K. Kronner, and K. Bay. 2003a. <strong>Stateline</strong> <strong>Wind</strong> <strong>Project</strong> <strong>Wildlife</strong><br />
<strong>Monitoring</strong> Annual <strong>Report</strong>, Results for the Period July 2001 – December 2002.<br />
Technical report submitted to FPL Energy, the Oregon Office of Energy, and the<br />
<strong>Stateline</strong> Technical Advisory Committee.<br />
Erickson, W.P., B. Gritski, and K. Kronner. 2003b. Nine Canyon <strong>Wind</strong> Power <strong>Project</strong> Avian<br />
and Bat <strong>Monitoring</strong> <strong>Report</strong>, September 2002 – August 2003. Technical report submitted<br />
to Energy Northwest and the Nine Canyon Technical Advisory Committee.<br />
Erickson, W.P., G. D. Johnson, D. P. Young, Jr., M. D. Strickland, R.E. Good, M. Bourassa, K.<br />
Bay. 2002. Synthesis and Comparison of Baseline Avian and Bat Use, Raptor Nesting<br />
and Mortality Information from Proposed and Existing <strong>Wind</strong> Developments. Technical<br />
<strong>Report</strong> prepared for Bonneville Power Administration, Portland, Oregon.<br />
Erickson, W.P., G.D. Johnson, M.D. Strickland, and K. Kronner. 2000. Avian and bat mortality<br />
associated with the Vansycle <strong>Wind</strong> <strong>Project</strong>, Umatilla County, Oregon: 1999 study year.<br />
Technical <strong>Report</strong> prepared by <strong>WEST</strong>, <strong>Inc</strong>. for Umatilla County Department of Resource<br />
Services and Development, Pendleton, Oregon. 21pp.<br />
FPL Energy Vansycle LLC. 2003. <strong>Stateline</strong> <strong>Wildlife</strong> Response and <strong>Report</strong>ing System Manual.<br />
February 2003.<br />
<strong>Stateline</strong> <strong>Monitoring</strong> <strong>Final</strong> <strong>Report</strong> 32<br />
December 2004
FPL Energy LLC, CH2M Hill, Northwest <strong>Wildlife</strong> Consultants, <strong>Inc</strong>. and <strong>WEST</strong>, <strong>Inc</strong>. 2002.<br />
SEPA <strong>Final</strong> Supplemental Environmental Impact Statement (Addendum to Draft) on FPL<br />
Energy’s Proposal for the <strong>Stateline</strong> <strong>Wind</strong> <strong>Project</strong> 2A Expansion. June 2002. Submitted<br />
to Walla Walla County Regional Planning Department.<br />
FPL Energy Vansycle LLC. 2002. Revised Application to Amend Site Certificate, Amendment<br />
2. Submitted to the Oregon Energy Facility Siting Council, October 2002. Baseline and<br />
Other Relevant <strong>Wildlife</strong> Data for Portions of <strong>Stateline</strong> 3 <strong>Wind</strong> Power <strong>Project</strong>, October 8,<br />
2002. <strong>Report</strong> by Northwest <strong>Wildlife</strong> Consultants, <strong>Inc</strong>.<br />
FPL Energy Vansycle LLC. W.P. Erickson and K. Kronner. 2001. Avian and bat monitoring<br />
plan for the Washington portion of the <strong>Stateline</strong> <strong>Wind</strong> <strong>Project</strong>. Technical <strong>Report</strong><br />
prepared for Walla Walla Regional Planning Department. May, 2001.<br />
FPL Energy Vansycle LLC. 2001. Application for Site Certificate. <strong>Stateline</strong> <strong>Wind</strong> <strong>Project</strong>.<br />
Submitted to the Oregon Energy Facility Siting Council, January 2001. Expanded<br />
Biological Survey. Technical Appendixes to Exhibits P and Q for EFSC Site<br />
Certification Application.<br />
FPL Energy, CH2M Hill. 2000. SEPA <strong>Final</strong> Environmental Impact Statement on FPL Energy’s<br />
Proposal for the Satteline <strong>Wind</strong> <strong>Project</strong>. Submitted to Walla Walla County Regional<br />
Planning Department.<br />
Harmata, A.R., K. M. Podruzny, and J. R. Zelenak. 1998. Avian use of Norris Hill <strong>Wind</strong><br />
Resource Area, Montana. NREL/SR-500-23822.<br />
Hayes, J.P. and D.L. Waldien. 2000. Potential influences of the <strong>Stateline</strong> <strong>Wind</strong> <strong>Project</strong> on bats.<br />
Technical report submitted to FPL Energy.<br />
Higgins, K. F., R. G. Osborn, C. D. Dieter and R. E. Usgaard. 1996. <strong>Monitoring</strong> of seasonal<br />
bird activity and mortality at the Buffalo Ridge <strong>Wind</strong> Resource Area, Minnesota, 1994-<br />
1995. Completion <strong>Report</strong> for the Research Period May 1, 1994 - December 31, 1995.<br />
Unpubl. report prepared for Kenetech <strong>Wind</strong>power, <strong>Inc</strong>. by the South Dakota Cooperative<br />
Fish and <strong>Wildlife</strong> Research Unit, Brookings, SD. 84pp.<br />
Howe, R.W., W. Evans, and A.T. Wolf. 2002. Effects of wind turbines on birds and bats in<br />
Northeastern Wisconsin. Technical report prepared for the Wisconsin Public Service<br />
Commission and Madison Gas and Electric Company. 104 pp.<br />
Johnson, G.D., W.P. Erickson, and M.D. Strickland. 2004. A review of bat collision mortality at<br />
wind plants. National <strong>Wind</strong> Coordinating Committee Resource Document. In<br />
preparation.<br />
<strong>Stateline</strong> <strong>Monitoring</strong> <strong>Final</strong> <strong>Report</strong> 33<br />
December 2004
Johnson, G.D., M. Perlik, W.P. Erickson, M.D. Strickland, D.A. Shepherd, and P. Sutherland, Jr.<br />
2003a. Bat interactions with wind turbines at the Buffalo Ridge, Minnesota <strong>Wind</strong><br />
Resource Area. Electric Power Research Institute, Concord, Calif., In Press.<br />
Johnson, G.D., W.P. Erickson, and J. White. 2003b. Avian and bat mortality at the Klondike,<br />
Oregon Phase I <strong>Wind</strong> Plant. Technical report prepared for Northwestern <strong>Wind</strong> Power by<br />
<strong>WEST</strong>, <strong>Inc</strong>.<br />
Johnson, G.D., W.P. Erickson, M.D. Strickland, M.F. Shepherd, D.A. Shepherd, and S.A.<br />
Sarappo. 2002. Collision mortality of local and migrant birds at a large-scale wind<br />
power development on Buffalo Ridge, Minnesota. <strong>Wildlife</strong> Society Bulletin 30:879-887.<br />
Johnson, G. D., W. P. Erickson, M. D. Strickland, M. F. Shepherd and D. A. Shepherd. 2000.<br />
Avian monitoring studies. Buffalo Ridge, Minnesota <strong>Wind</strong> Resource Area, 1996-1999,<br />
results of a 4-year study. Technical <strong>Report</strong> prepared for Northern States Power Co.,<br />
Minneapolis, MN. 212 pp.<br />
Kerlinger P. and J. Kerns. 2004. A study of bird and bat collisions at the Mountaineer <strong>Wind</strong><br />
Energy Facility, Tucker County, West Virginia. Prepared for FPL Energy and the<br />
Mountain <strong>Wind</strong> Energy Center Technical Review Committee.<br />
Kerlinger, P. 2003. FAA and Lighting. Presentation at the NWCC Biological Significance Workshop.<br />
November 17-18, 2003. Washington D,C.<br />
Kerlinger, P. 2000. Avian mortality at communication towers: a review of recent literature,<br />
research, and methodology. Unpublished report prepared for the U.S. Fish and <strong>Wildlife</strong><br />
Service, Office of Migratory Bird Management.<br />
http://migratorybirds.fws.gov/issues/towers/review.pdf<br />
Leddy, K.L., K.F. Higgins, and D.E. Naugle. 1999. Effects of wind turbines on upland nesting<br />
birds in Conservation Reserve Program grasslands. Wilson Bulletin 111:100-104.<br />
Manly, B.F.J. 1997. Randomization, Bootstrap and Monte Carlo Methods in Biology. 2 nd<br />
edition. Chapman and Hall, New York. pp 399.<br />
Moore, D.S. 1995. The Basic Practice of Statistics. W.H. Freeman and Company, New York.<br />
pp 672.<br />
Morrison, M., W. Block, M.D. Strickland and W.L. Kendall. 2001. <strong>Wildlife</strong> study design.<br />
Springer. New York. 210 pp.<br />
Nicholson, C.P. 2003. Buffalo Mountain <strong>Wind</strong>farm bird and bat mortality monitoring report:<br />
October 2001 - September 2002. Tennessee Valley Authority, Knoxville.<br />
Oregon Energy Facility Siting Council. 2001. <strong>Final</strong> Order for the <strong>Stateline</strong> <strong>Wind</strong> Facility.<br />
<strong>Stateline</strong> <strong>Monitoring</strong> <strong>Final</strong> <strong>Report</strong> 34<br />
December 2004
September 2001. Attachment A. <strong>Stateline</strong> <strong>Wind</strong> <strong>Project</strong>: Oregon <strong>Wildlife</strong> <strong>Monitoring</strong><br />
Plan.<br />
Oregon Energy Facility Siting Council. 2002. <strong>Final</strong> Order on <strong>Stateline</strong> Amendment #1. May<br />
17, 2002. Attachment A. <strong>Stateline</strong> <strong>Wind</strong> <strong>Project</strong>: Oregon <strong>Wildlife</strong> <strong>Monitoring</strong> Plan.<br />
Oregon Energy Facility Siting Council. 2003. <strong>Final</strong> Order on <strong>Stateline</strong> Amendment #2. June 6<br />
2003. Attachment A. <strong>Stateline</strong> <strong>Wind</strong> <strong>Project</strong>: Oregon <strong>Wildlife</strong> <strong>Monitoring</strong> Plan.<br />
Racey, P. A. 1988. Reproductive assessment in bats. Pages 31−46 in T. H. Kunz, editor.<br />
Ecological and behavioral methods for the study of bats. Smithsonian Institution,<br />
Washington, D.C., USA.<br />
Sauer, J. R., J. E. Hines, and J. Fallon. 2003. The North American Breeding Bird Survey,<br />
Results and Analysis 1966 - 2002. Version 2003.1, USGS Patuxent <strong>Wildlife</strong> Research<br />
Center, Laurel, MD.<br />
Shaffer, J.A. and D. Johnson. 2003. Influence of wind generators on grassland breeding birds.<br />
Annual report 2003. U.S. Geological Survey. Northern Prairie <strong>Wildlife</strong> Research Center.<br />
Jamestown, North Dakota.<br />
Shoenfeld, P. 2004. Suggestions regarding avian mortality extrapolation. Technical memo<br />
provided to FPL Energy. West Virginia Highlands Conservancy, HC70, Box 553. Davis,<br />
West Virginia. 26260.<br />
Smallwood, K. S. and C. G. Thelander. 2004. Developing methods to reduce bird fatalities in<br />
the Altamont <strong>Wind</strong> Resource Area. <strong>Final</strong> <strong>Report</strong> by BioResource Consultants to the<br />
California Energy Commission, Public Interest Energy Research-Environmental Area,<br />
under Contract No. 500-01-019 (L. Spiegel, <strong>Project</strong> Manager).<br />
<strong>WEST</strong> 2004. Ecological Baseline Study for the Rosebud Sioux <strong>Wind</strong> Power <strong>Project</strong>. Protocol<br />
prepared for Distributed Generation Systems. <strong>WEST</strong>, 2003 Central Ave., Cheyenne, WY<br />
82001.<br />
Young, D.P. Jr., Johnson, G. D., W. P. Erickson, M. D. Strickland, R. E. Good and P. Becker.<br />
2003. Avian and bat mortality associated with the initial phase of the Foote Creek Rim<br />
<strong>Wind</strong> Power <strong>Project</strong>, Carbon County, Wyoming: November 1998 – June 2002. Tech.<br />
<strong>Report</strong> prepared by <strong>WEST</strong>, <strong>Inc</strong>. for Pacific Corp, <strong>Inc</strong>., SeaWest <strong>Wind</strong>power <strong>Inc</strong>., and<br />
Bureau of Land Management. 35pp.<br />
<strong>Stateline</strong> <strong>Monitoring</strong> <strong>Final</strong> <strong>Report</strong> 35<br />
December 2004
Table 1. Total effort for standardized search plots surveys from July 2001 through<br />
December 2003.<br />
State<br />
Washington<br />
Oregon<br />
Year<br />
# Turbines<br />
Completely<br />
Searched a<br />
Effective<br />
# Turbines<br />
Searched b<br />
# Plot<br />
Searches<br />
Effective<br />
# Turbine<br />
Searches<br />
2001 60 73.5 81 292<br />
2002 60 73.5 320 1176<br />
2003 60 73.5 340 1249.5<br />
total 180 220.5 741 2717.5<br />
2002 64 73 350 c 1161.5<br />
2003 93 104.75 509 1778.75<br />
total 157 177.75 859 2940.25<br />
Overall total 337 398.25 1600 5657.75<br />
a # turbines that are searched at least 63 m in all directions<br />
b Most adjacent turbines within a string are slightly over 70 m apart for <strong>Stateline</strong> 1 and<br />
turbine plots were extended to the adjacent turbines. <strong>Stateline</strong> 2 turbines are 105 m apart,<br />
and plots were not extended to the adjacent turbines.<br />
c One survey period was missed for two turbines due to construction and maintenance<br />
activities in the area.<br />
<strong>Stateline</strong> <strong>Monitoring</strong> <strong>Final</strong> <strong>Report</strong> 36<br />
December 2004
Table 2. List of turbines and number of avian fatalities observed in standardized search<br />
plots from July 2001 through December 2003.<br />
2001/2002 2003<br />
Turbine<br />
#<br />
Fatalities Turbine<br />
#<br />
Fatalities Turbine<br />
#<br />
Fatalities Turbine<br />
#<br />
Fatalities<br />
HGA7 3 HGD4 1 BGB19 4 HGJ24 1<br />
HGC14 3 HGD5 1 BGC16 4 HGJ36 1<br />
HGC24 3 HGD6 1 HGJ23 3 HGJ37 1<br />
HGH16 3 HGG3 1 HGJ25 3 HGJ40 1<br />
PB30 3 HGH17 1 HGS27 3 HGK4 1<br />
PB39 3 HGH18 1 HGS35 3 HGK5 1<br />
BGB16 2 HGJ12 1 HGA1 2 HGK6 1<br />
BGB23 2 HGJ18 1 HGC19 2 HGK7 1<br />
HGA22 2 HGJ35 1 HGC20 2 HGK11 1<br />
HGB13 2 HGJ40 1 HGE2 2 HGK12 1<br />
HGJ21 2 HGJ7 1 HGJ10 2 HGL3 1<br />
HGL2 2 HGJ8 1 HGJ11 2 HGL5 1<br />
HGM2 2 HGK9 1 HGK13 2 HGL6 1<br />
HGM18 2 HGL1 1 HGM11 2 HGM13 1<br />
HGM9 2 HGM14 1 HGN5 2 HGM8 1<br />
HGN8 2 HGM17 1 HGN7 2 HGS12 1<br />
HGN9 2 HGM8 1 HGS18 2 HGS29 1<br />
PB29 2 PB15 1 HGS51 2 HGS31 1<br />
PB41 2 PB16 1 PB67 2 HGS37 1<br />
PB50 2 PB17 1 PB78 2 HGS47 1<br />
WSA19 2 PB28 1 WSA38 2 HGS48 1<br />
WSA21 2 PB40 1 BGB18 1 HGS59 1<br />
WSA44 2 PB53 1 BGB22 1 PB11 1<br />
WSB16 2 PB76 1 BGC14 1 PB12 1<br />
WSB45 2 PB81 1 BGC15 1 PB35 1<br />
BGB17 1 PB87 1 BGC17 1 PB47 1<br />
BGB19 1 PB95 1 HGB7 1 PB79 1<br />
BGC17 1 PB97 1 HGC17 1 PB80 1<br />
BGC18 1 WSA22 1 HGC21 1 PB91 1<br />
BGC19 1 WSA43 1 HGC32 1 WSA16 1<br />
HGA20 1 WSB29 1 HGE4 1 WSA37 1<br />
HGA6 1 WSB31 1 HGG11 1 WSA39 1<br />
HGA9 1 WSB46 1 HGH11 1 WSA40 1<br />
HGB11 1 WSB47 1 HGJ3 1 WSB10 1<br />
HGB12 1 WSB48 1 HGJ4 1 WSB24 1<br />
HGB4 1 WSB52 1 HGJ12 1 WSB55 1<br />
HGC23 1 WSB53 1 HGJ13 1 WSB57 1<br />
HGC25 1 HGJ18 1<br />
<strong>Stateline</strong> <strong>Monitoring</strong> <strong>Final</strong> <strong>Report</strong> 37<br />
December 2004
Table 3. Summary of avian fatality composition based on fatalities observed in<br />
standardized search plots from July 2001 through December 2003.<br />
Fatalities found on<br />
All Fatalities<br />
Standardized Search Plots<br />
%<br />
2001 2002 2003 Total 2001 2002 2003 Total<br />
%<br />
Comp.<br />
Species<br />
Comp.<br />
horned lark 3 43 35 81 38.6 3 47 39 89 38.4<br />
golden-crowned kinglet 2 4 14 20 9.5 2 4 15 21 9.1<br />
ring-necked pheasant 0 4 14 18 8.6 0 5 14 19 8.2<br />
western meadowlark 1 5 6 12 5.7 1 5 6 12 5.2<br />
chukar 0 2 5 7 3.3 0 3 5 8 3.4<br />
gray partridge 0 4 3 7 3.3 0 6 3 9 3.9<br />
red-tailed hawk 0 4 2 6 2.9 0 6 3 9 3.9<br />
American kestrel 0 1 4 5 2.4 0 1 4 5 2.2<br />
European starling 0 2 3 5 2.4 0 3 3 6 2.6<br />
white-crowned sparrow 0 4 1 5 2.4 0 6 1 7 3.0<br />
unidentified passerine 2 1 1 4 1.9 2 1 1 4 1.7<br />
winter wren 0 2 2 4 1.9 0 2 2 4 1.7<br />
yellow-rumped warbler 0 2 2 4 1.9 0 2 2 4 1.7<br />
dark-eyed junco 1 0 2 3 1.4 1 0 2 3 1.3<br />
golden-crowned sparrow 1 1 1 3 1.4 1 1 1 3 1.3<br />
house wren 0 2 1 3 1.4 0 2 1 3 1.3<br />
unidentified bird 0 1 2 3 1.4 0 1 2 3 1.3<br />
savannah sparrow 0 1 1 2 1.0 0 1 1 2 0.9<br />
vesper sparrow 0 2 0 2 1.0 0 2 0 2 0.9<br />
American pipit 0 0 1 1 0.5 0 0 1 1 0.4<br />
black-billed magpie 0 1 0 1 0.5 0 1 0 1 0.4<br />
Canada goose 0 0 0 0 0.0 0 1 0 1 0.4<br />
ferruginous hawk a 0 0 1 1 0.5 0 0 1 1 0.4<br />
grasshopper sparrow b 0 1 0 1 0.5 0 1 0 1 0.4<br />
great blue heron 0 1 0 1 0.5 0 1 0 1 0.4<br />
house finch 0 1 0 1 0.5 0 1 0 1 0.4<br />
MacGillivray’s warbler 0 1 0 1 0.5 0 1 0 1 0.4<br />
mallard 0 1 0 1 0.5 0 1 0 1 0.4<br />
northern flicker 0 0 1 1 0.5 0 0 1 1 0.4<br />
red-breasted nuthatch 0 0 1 1 0.5 0 0 1 1 0.4<br />
red-winged blackbird 0 1 0 1 0.5 0 1 0 1 0.4<br />
rock dove 0 0 1 1 0.5 0 0 1 1 0.4<br />
ruby-crowned kinglet 0 1 0 1 0.5 0 1 0 1 0.4<br />
short-eared owl 0 0 0 0 0.0 1 0 0 1 0.4<br />
Swainson's hawk b 0 1 0 1 0.5 0 1 0 1 0.4<br />
Swainson's thrush 0 1 0 1 0.5 0 1 0 1 0.4<br />
unidentified sparrow 0 1 0 1 0.5 0 1 0 1 0.4<br />
white-throated swift 0 0 0 0 0.0 1 0 0 1 0.4<br />
Total (35 identified species) 10 96 104 210 100.0 12 110 110 232 100.0<br />
a Oregon Sensitive-critical: Species for which listing as threatened or endangered is pending; or those for which<br />
listing as threatened or endangered may be appropriate if immediate conservation activities are not taken.<br />
b Oregon Sensitive-vulnerable: Species for which listing as threatened or endangered is not believed to be<br />
imminent and can be avoided through continued or expanded use of adequate protective measures and<br />
monitoring.<br />
<strong>Stateline</strong> <strong>Monitoring</strong> <strong>Final</strong> <strong>Report</strong> 38<br />
December 2004
Table 4. Summary of bat fatality composition based on fatalities observed in standardized<br />
search plots from July 2001 through December 31, 2003.<br />
Fatalities found in<br />
Standardized Search Plots<br />
All Fatalities<br />
%<br />
%<br />
2001 2002 2003 Total 2001 2002 2003 Total<br />
Species<br />
Comp.<br />
Comp.<br />
silver-haired bat a 12 13 39 64 50.0 14 19 40 73 48.7<br />
hoary bat 12 13 34 59 46.1 14 20 37 71 47.3<br />
big brown bat 1 1 0 2 1.6 1 1 0 2 1.3<br />
unidentified bat 0 1 1 2 1.6 1 1 1 3 2.0<br />
little brown bat 0 1 0 1 0.8 0 1 0 1 0.7<br />
Total 25 29 74 128 100.0 30 42 78 150 100.0<br />
a Oregon Sensitive-undetermined: Animals in this category are species whose status is unclear. They may be<br />
susceptible to population decline of sufficient magnitude that they could qualify for endangered, threatened, critical<br />
or vulnerable status, but scientific study will be required before a judgment can be made.<br />
<strong>Stateline</strong> <strong>Monitoring</strong> <strong>Final</strong> <strong>Report</strong> 39<br />
December 2004
Table 5. List of turbines and number of bat fatalities observed in standardized search plots<br />
from July 2001 through December 2003.<br />
2001/2002 2003<br />
Turbine<br />
#<br />
Fatalities Turbine<br />
#<br />
Fatalities Turbine<br />
#<br />
Fatalities Turbine<br />
#<br />
Fatalities<br />
PB30 4 PB28 1 HGA1 3 HGJ12 1<br />
HGC14 3 PB29 1 HGA14 3 HGJ18 1<br />
BGC18 2 PB31 1 HGA15 3 HGJ32 1<br />
PB53 2 PB40 1 HGK5 3 HGJ38 1<br />
BGB17 1 PB41 1 PB23 3 HGJ40 1<br />
BGB21 1 PB42 1 PB94 3 HGJ44 1<br />
BGC16 1 PB50 1 HGA16 2 HGL4 1<br />
BGC17 1 PB6 1 PB11 2 HGL5 1<br />
HGB1 1 PB76 1 PB68 2 HGM5 1<br />
HGC10 1 PB84 1 PB86 2 HGM14 1<br />
HGC11 1 PB88 1 WSB55 2 HGS13 1<br />
HGC23 1 PB97 1 WSB56 2 HGS36 1<br />
HGC25 1 WSA19 1 BGB18 1 HGS37 1<br />
HGD4 1 WSA44 1 BGB19 1 PB10 1<br />
HGD6 1 WSA45 1 BGB23 1 PB22 1<br />
HGJ14 1 WSB16 1 BGC13 1 PB24 1<br />
HGK2 1 WSB19 1 BGC16 1 PB45 1<br />
HGM16 1 WSB4 1 BGC17 1 PB46 1<br />
HGM4 1 WSB46 1 HGA2 1 PB84 1<br />
HGM9 1 WSB52 1 HGB8 1 PB85 1<br />
PB15 1 WSB53 1 HGC4 1 PB93 1<br />
PB16 1 WSB54 1 HGC5 1 WSA14 1<br />
PB18 1 WSB7 1 HGC20 1 WSA15 1<br />
PB27 1 HGC30 1 WSB10 1<br />
HGH10 1 WSB22 1<br />
HGH12 1 WSB25 1<br />
HGJ3 1 WSB48 1<br />
HGJ5 1 WSB50 1<br />
<strong>Stateline</strong> <strong>Monitoring</strong> <strong>Final</strong> <strong>Report</strong> 40<br />
December 2004
Table 6. Results of observer detection trials conducted July 2001 through December 2003.<br />
2001/2002 2003 Overall<br />
Season # Placed % Found # Placed % Found # Placed % Found<br />
Large Birds<br />
Agriculture<br />
Winter 13 92% 11 91% 24 92%<br />
Spring 11 100% 5 60% 16 88%<br />
Summer 10 60% 12 75% 22 68%<br />
Fall 5 100% 10 100% 15 100%<br />
Subtotal 39 87% 38 84% 77 86%<br />
Grassland<br />
Winter 15 80% 9 89% 24 83%<br />
Spring 10 80% 6 67% 16 75%<br />
Summer 12 67% 9 44% 21 57%<br />
Fall 10 60% 8 75% 18 67%<br />
Subtotal 47 72% 32 69% 79 71%<br />
Overall 86 79% 70 77% 156 78%<br />
Small Birds<br />
Agriculture<br />
Winter 14 36% 11 36% 25 36%<br />
Spring 7 86% 7 29% 14 57%<br />
Summer 9 11% 16 38% 25 28%<br />
Fall 5 40% 10 60% 15 53%<br />
Subtotal 35 37 44 41% 79 39%<br />
Grassland<br />
Winter 11 45% 12 50% 23 48%<br />
Spring 7 43% 6 33% 13 38%<br />
Summer 13 46% 11 45% 24 46%<br />
Fall 19 47% 13 31% 32 41%<br />
Subtotal 50 46% 42 40% 92 43%<br />
Overall 85 42% 86 41% 171 42%<br />
<strong>Stateline</strong> <strong>Monitoring</strong> <strong>Final</strong> <strong>Report</strong> 41<br />
December 2004
Table 7. Results of carcass removal trials conducted July 2001 through December 2003.<br />
Medium/Large Birds<br />
Small Birds<br />
% remaining % remaining<br />
year # birds Mean Day 40 Day 30 Day 14 # birds Mean Day 40 Day 30 Day 14<br />
Fall<br />
2001 10 18.4 10.0% 10.0% 40.0% 10 11.7 0.0% 0.0% 30.0%<br />
2002 19 36.3 31.6% 47.4% 63.2% 21 19.7 9.5% 23.8% 57.1%<br />
2003 20 38.3 40.0% 40.0% 60.0% 20 17.0 15.0% 15.0% 45.0%<br />
Subtotal 49 32.3 30.6% 36.7% 57.1% 51 17.0 9.8% 15.7% 47.1%<br />
Winter<br />
2001 10 32.4 40.0% 40.0% 50.0% 10 27.8 20.0% 30.0% 70.0%<br />
2002 20 44.0 45.0% 50.0% 60.0% 20 18.1 15.0% 25.0% 40.0%<br />
2003 30 23.5 13.3% 40.0% 53.3% 30 12.3 0.0% 6.7% 40.0%<br />
Subtotal 60 30.0 28.3% 43.4% 55.0% 60 16.3 8.3% 16.7% 45.0%<br />
Spring<br />
2002 20 45.6 45.0% 45.0% 70.0% 20 16.4 15.0% 20.0% 35.0%<br />
2003 19 29.7 21.1% 47.4% 68.4% 21 12.9 0.0% 4.8% 38.1%<br />
Subtotal 39 36.4 33.3% 46.2% 69.2% 41 14.5 7.3% 12.2% 36.6%<br />
Summer<br />
2002 30 58.9 53.3% 60.0% 66.7% 30 35.1 36.7% 36.7% 63.3%<br />
2003 35 36.4 34.3% 48.6% 71.4% 35 9.3 2.9% 8.6% 25.7%<br />
Subtotal 65 44.9 43.1% 53.8% 69.2% 65 19.3 18.5% 21.5% 43.1%<br />
Overall 213 35.7 34.2% 45.5% 62.4% 217 16.7 11.5% 17.1% 43.3%<br />
<strong>Stateline</strong> <strong>Monitoring</strong> <strong>Final</strong> <strong>Report</strong> 42<br />
December 2004
Table 8. Annual fatality rate estimates based on <strong>Stateline</strong> monitoring in 2002 and 2003.<br />
# Fatalities 90% Confidence Intervals a<br />
/Turbine/Year SE LL UL<br />
All Birds<br />
2002 2.09 0.26 1.64 2.49<br />
2003 1.77 0.27 1.27 2.16<br />
Overall 1.93 0.20 1.56 2.20<br />
Small Birds<br />
2002 1.88 0.26 1.43 2.27<br />
2003 1.51 0.26 1.04 1.90<br />
Overall 1.70 0.19 1.33 1.96<br />
Grassland Birds<br />
2002 1.51 0.23 1.07 1.85<br />
2003 1.12 0.24 0.70 1.55<br />
Overall 1.28 0.18 0.98 1.62<br />
Nocturnal Migrant Passerines and Unidentified Passerines<br />
2002 0.57 0.12 0.38 0.77<br />
2003 0.53 0.13 0.31 0.73<br />
Overall 0.55 0.09 0.39 0.68<br />
Large Birds<br />
2002 0.21 0.05 0.14 0.29<br />
2003 0.26 0.06 0.15 0.35<br />
Overall 0.23 0.04 0.17 0.29<br />
Raptors<br />
2002 0.060 0.031 0.019 0.114<br />
2003 0.060 0.030 0.017 0.115<br />
Overall 0.060 0.021 0.028 0.099<br />
Bats<br />
2002 0.72 0.15 0.46 0.94<br />
2003 1.51 0.26 1.08 1.94<br />
Overall 1.12 0.16 0.84 1.35<br />
a An interval computed from the sample data by a method that has a 90% probability of producing an<br />
interval containing the true value of the parameter being estimated (Moore 1995).<br />
<strong>Stateline</strong> <strong>Monitoring</strong> <strong>Final</strong> <strong>Report</strong> 43<br />
December 2004
Table 9. List of avian species observed during fixed-point surveys (July 2001 through<br />
December 2003).<br />
Species/Group Scientific Name Species/Group Scientific Name<br />
American white pelican Pelecanus erythrorhyncos house finch Carpodacus mexicanus<br />
Canada goose Branta canadensis lark sparrow Chondestes grammacus<br />
mallard Anas platyrhynchos red-winged blackbird Agelaius phoeniceus<br />
ring-billed gull Larus delawarensis rock wren Salpinctes obsoletus<br />
American kestrel Falco sparverius savannah sparrow Passerculus sandwichensis<br />
Cooper's hawk Accipiter cooperii Say's phoebe Sayornis saya<br />
ferruginous hawk Buteo regalis snow bunting Plectrophenax nivalis<br />
golden eagle Aquila chrysaetos tree swallow Tachycineta bicolor<br />
merlin Falco columbarius vesper sparrow Pooecetes gramineus<br />
northern harrier Circus cyaneus violet-green swallow Tachycineta thalassina<br />
prairie falcon Falco mexicanus western bluebird Sialia mexicana<br />
red-tailed hawk Buteo jamaicensis western kingbird Tyrannus verticalis<br />
rough-legged hawk Buteo lagopus western meadowlark Sturnella neglecta<br />
Swainson's hawk Buteo swainsoni white-crowned sparrow Zonotrichia leucophrys<br />
American crow Corvus brachyrhynchos winter wren Troglodytes troglodytes<br />
American goldfinch Carduelis tristis yellow-headed blackbird<br />
Xanthocephalus<br />
xanthocephalus<br />
American pipit Anthus rubescens chukar Alectoris chukar<br />
American robin Turdus migratorius gray partridge Perdix perdix<br />
barn swallow Hirundo rustica ring-necked pheasant Phasianus colchicus<br />
Bewick's wren Thryomanes bewickii mourning dove Zenaida macroura<br />
black-billed magpie Pica pica unidentified duck<br />
Brewer's blackbird Euphagus cyanocephalus unidentified gull<br />
cliff swallow Petrochelidon pyrrhonota unidentified buteo<br />
common raven Corvus corax unidentified raptor<br />
dark-eyed junco Junco hyemalis unidentified bluebird<br />
European starling Sturnus vulgaris unidentified finch<br />
golden-crowned kinglet Regulus satrapa unidentified passerine<br />
grasshopper sparrow Ammodramus savannarum unidentified sparrow<br />
gray-crowned rosy finch Leucosticte arctoa unidentified swallow<br />
horned lark Eremophila alpestris unidentified bird<br />
<strong>Stateline</strong> <strong>Monitoring</strong> <strong>Final</strong> <strong>Report</strong> 44<br />
December 2004
Table 10. Bird observations and groups recorded during avian use surveys conducted July<br />
2001 through December 2003.<br />
2001 2002 2003 Total<br />
Group/Species obs. groups obs. groups obs. groups obs. groups<br />
WaterfowlWaterbirds<br />
American white pelican 0 0 40 1 6 1 46 2<br />
Canada goose 118 5 31 3 214 3 363 11<br />
mallard 0 0 0 0 30 1 30 1<br />
ring-billed gull 0 0 6 1 12 3 18 4<br />
unidentified duck 0 0 0 0 10 1 10 1<br />
unidentified gull 0 0 30 1 0 0 30 1<br />
Subtotal 118 5 107 6 272 9 497 20<br />
Raptors<br />
Accipiters<br />
Cooper's hawk 0 0 0 0 1 1 1 1<br />
Buteos<br />
ferruginous hawk 0 0 5 4 7 7 12 11<br />
red-tailed hawk 1 1 76 59 44 31 121 91<br />
rough-legged hawk 3 3 9 9 15 15 27 27<br />
Swainson's hawk 1 1 42 15 20 16 63 32<br />
unidentified buteo 3 2 33 28 34 27 70 57<br />
Subtotal 8 7 165 115 120 96 293 218<br />
northern harrier 1 1 26 24 17 16 44 41<br />
Eagles<br />
golden eagle 0 0 6 5 0 0 6 5<br />
Falcons<br />
American kestrel 0 0 4 4 18 15 22 19<br />
merlin 0 0 0 0 1 1 1 1<br />
prairie falcon 0 0 2 2 3 3 5 5<br />
Subtotal 0 0 6 6 22 19 28 25<br />
unidentified raptor 0 0 0 0 1 1 1 1<br />
Raptor Subtotal 9 8 203 150 161 133 373 291<br />
Table continues on next page.<br />
<strong>Stateline</strong> <strong>Monitoring</strong> <strong>Final</strong> <strong>Report</strong> 45<br />
December 2004
Table 10 (continued)<br />
2001 2002 2003 Total<br />
Group/Species obs. groups obs. groups obs. groups obs. groups<br />
Passerines<br />
American crow 0 0 1 1 0 0 1 1<br />
American goldfinch 0 0 12 4 1 1 13 5<br />
American pipit 0 0 0 0 14 2 14 2<br />
American robin 0 0 1 1 1 1 2 2<br />
barn swallow 0 0 1 1 6 3 7 4<br />
Bewick's wren 0 0 1 1 0 0 1 1<br />
black-billed magpie 0 0 2 1 8 1 10 2<br />
Brewer's blackbird 0 0 0 0 2 1 2 1<br />
cliff swallow 0 0 2 1 0 0 2 1<br />
common raven 4 4 107 75 158 98 269 177<br />
dark-eyed junco 0 0 0 0 12 9 12 9<br />
European starling 0 0 18 3 62 13 80 16<br />
golden-crowned kinglet 0 0 0 0 2 2 2 2<br />
grasshopper sparrow 0 0 3 2 5 4 8 6<br />
gray-crowned rosy finch 0 0 0 0 1 1 1 1<br />
horned lark 42 29 1281 550 1601 706 2924 1285<br />
house finch 0 0 0 0 1 1 1 1<br />
lark sparrow 0 0 0 0 1 1 1 1<br />
red-winged blackbird 0 0 1 1 0 0 1 1<br />
rock wren 0 0 2 2 5 4 7 6<br />
savannah sparrow 0 0 2 2 3 3 5 5<br />
Say's phoebe 0 0 1 1 1 1 2 2<br />
snow bunting 0 0 0 0 16 1 16 1<br />
tree swallow 0 0 1 1 0 0 1 1<br />
unidentified bluebird 0 0 3 1 0 0 3 1<br />
unidentified finch 0 0 1 1 0 0 1 1<br />
unidentified passerine 0 0 3 3 10 6 13 9<br />
unidentified sparrow 0 0 2 2 9 7 11 9<br />
unidentified swallow 0 0 0 0 3 2 3 2<br />
vesper sparrow 0 0 0 0 6 6 6 6<br />
violet-green swallow 0 0 12 1 0 0 12 1<br />
western bluebird 0 0 0 0 2 1 2 1<br />
western kingbird 0 0 5 4 2 1 7 5<br />
western meadowlark 10 7 231 193 362 287 603 487<br />
white-crowned sparrow 0 0 5 3 31 9 36 12<br />
winter wren 0 0 2 2 0 0 2 2<br />
yellow-headed blackbird 0 0 0 0 1 1 1 1<br />
Subtotal 56 40 1700 857 2326 1173 4082 2070<br />
Table continues on next page.<br />
<strong>Stateline</strong> <strong>Monitoring</strong> <strong>Final</strong> <strong>Report</strong> 46<br />
December 2004
Table 10 (continued)<br />
2001 2002 2003 Total<br />
Group/Species obs. groups obs. groups obs. groups obs. groups<br />
Doves<br />
mourning dove 0 0 0 0 2 1 2 1<br />
Upland gamebirds<br />
chukar 0 0 23 4 41 6 64 10<br />
gray partridge 0 0 33 5 41 5 74 10<br />
ring-necked pheasant 0 0 13 12 15 10 28 22<br />
Subtotal 0 0 69 21 97 21 166 42<br />
unidentified bird 0 0 0 0 5 5 5 5<br />
Total 183 53 2079 1034 2863 1342 5125 2429<br />
<strong>Stateline</strong> <strong>Monitoring</strong> <strong>Final</strong> <strong>Report</strong> 47<br />
December 2004
Table 11. Mean use (#/survey) and % frequency of occurrence (% of surveys where species<br />
was observed) by year conducted July 2001 through December 2003.<br />
Use (#/survey) % Frequency of Occurrence<br />
Species '01-'02 '03 mean '01-'02 '03 mean<br />
horned lark 1.482 1.885 1.649 46.44 57.00 50.82<br />
western meadowlark 0.269 0.426 0.334 18.19 25.31 21.14<br />
Canada goose 0.079 0.228 0.141 0.42 0.24 0.34<br />
common raven 0.077 0.125 0.097 6.13 9.06 7.34<br />
European starling 0.018 0.073 0.041 0.30 1.29 0.72<br />
red-tailed hawk 0.046 0.032 0.040 3.69 2.24 3.09<br />
gray partridge 0.033 0.048 0.039 0.51 0.59 0.54<br />
chukar 0.023 0.049 0.034 0.41 0.71 0.53<br />
northern harrier 0.023 0.020 0.022 2.24 1.88 2.09<br />
white-crowned sparrow 0.005 0.037 0.018 0.31 1.06 0.62<br />
ring-necked pheasant 0.013 0.018 0.015 1.13 1.06 1.10<br />
mallard 0.000 0.035 0.015 0.00 0.12 0.05<br />
Swainson's hawk 0.016 0.011 0.014 1.38 0.94 1.20<br />
rough-legged hawk 0.013 0.012 0.013 1.31 1.18 1.26<br />
American kestrel 0.004 0.019 0.010 0.41 1.41 0.82<br />
snow bunting 0.000 0.019 0.008 0.00 0.12 0.05<br />
American goldfinch 0.012 0.001 0.008 0.41 0.12 0.29<br />
violet-green swallow 0.012 0.000 0.007 0.10 0.00 0.06<br />
American pipit 0.000 0.016 0.007 0.00 0.24 0.10<br />
unidentified passerine 0.003 0.012 0.007 0.30 0.71 0.47<br />
dark-eyed junco 0.000 0.014 0.006 0.00 1.06 0.44<br />
unidentified sparrow 0.002 0.011 0.006 0.20 0.82 0.46<br />
black-billed magpie 0.002 0.009 0.005 0.10 0.12 0.11<br />
unidentified buteo 0.004 0.005 0.004 0.41 0.47 0.44<br />
grasshopper sparrow 0.003 0.006 0.004 0.20 0.47 0.31<br />
ring-billed gull 0.006 0.001 0.004 0.10 0.12 0.11<br />
western kingbird 0.005 0.002 0.004 0.41 0.12 0.29<br />
rock wren 0.002 0.006 0.004 0.21 0.47 0.32<br />
barn swallow 0.001 0.007 0.004 0.10 0.35 0.21<br />
vesper sparrow 0.000 0.007 0.003 0.00 0.71 0.29<br />
savannah sparrow 0.002 0.004 0.003 0.21 0.36 0.27<br />
unidentified bird 0.000 0.006 0.002 0.00 0.59 0.24<br />
golden eagle 0.004 0.000 0.002 0.41 0.00 0.24<br />
prairie falcon 0.002 0.002 0.002 0.20 0.24 0.22<br />
unidentified bluebird 0.003 0.000 0.002 0.10 0.00 0.06<br />
ferruginous hawk 0.001 0.002 0.002 0.10 0.24 0.16<br />
unidentified swallow 0.000 0.004 0.001 0.00 0.24 0.10<br />
Table continues on next page.<br />
<strong>Stateline</strong> <strong>Monitoring</strong> <strong>Final</strong> <strong>Report</strong> 48<br />
December 2004
Table 11 (continued)<br />
Use (#/survey) % Frequency of Occurrence<br />
'01-'02 '03 mean '01-'02 '03 mean<br />
winter wren 0.002 0.000 0.001 0.20 0.00 0.12<br />
cliff swallow 0.002 0.000 0.001 0.10 0.00 0.06<br />
American robin 0.001 0.001 0.001 0.10 0.12 0.11<br />
Say's phoebe 0.001 0.001 0.001 0.10 0.12 0.11<br />
western bluebird 0.000 0.002 0.001 0.00 0.12 0.05<br />
golden-crowned kinglet 0.000 0.002 0.001 0.00 0.24 0.10<br />
Brewer's blackbird 0.000 0.002 0.001 0.00 0.12 0.05<br />
mourning dove 0.000 0.002 0.001 0.00 0.12 0.05<br />
American crow 0.001 0.000 0.001 0.10 0.00 0.06<br />
red-winged blackbird 0.001 0.000 0.001 0.10 0.00 0.06<br />
tree swallow 0.001 0.000 0.001 0.10 0.00 0.06<br />
unidentified finch 0.001 0.000 0.001 0.10 0.00 0.06<br />
Bewick's wren 0.001 0.000 0.001 0.10 0.00 0.06<br />
merlin 0.000 0.001 0.000 0.00 0.12 0.05<br />
gray-crowned rosy finch 0.000 0.001 0.000 0.00 0.12 0.05<br />
house finch 0.000 0.001 0.000 0.00 0.12 0.05<br />
lark sparrow 0.000 0.001 0.000 0.00 0.12 0.05<br />
yellow-headed blackbird 0.000 0.001 0.000 0.00 0.12 0.05<br />
<strong>Stateline</strong> <strong>Monitoring</strong> <strong>Final</strong> <strong>Report</strong> 49<br />
December 2004
Table 12. Avian and mammal observations and groups recorded incidentally between<br />
avian use surveys conducted July 2001 through December 2003.<br />
Group / Species Groups Obs<br />
Avian Species<br />
American pipit 1 325<br />
sandhill crane 2 225<br />
Canada goose 4 99<br />
red-tailed hawk 46 72<br />
killdeer 1 47<br />
Swainson's hawk 28 45<br />
long-billed curlew 14 22<br />
northern harrier 20 20<br />
loggerhead shrike 11 16<br />
American kestrel 12 15<br />
prairie falcon 10 14<br />
common raven 2 13<br />
grasshopper sparrow 12 12<br />
gray partridge 1 12<br />
burrowing owl a 7 11<br />
ferruginous hawk 10 10<br />
rough-legged hawk 9 9<br />
short-eared owl 5 6<br />
chukar 1 4<br />
common nighthawk 4 4<br />
golden eagle 3 3<br />
gray-crowned rosy finch 2 3<br />
Vaux's swift 1 3<br />
bald eagle 2 2<br />
merlin 2 2<br />
northern shrike 2 2<br />
sage thrasher 2 2<br />
sharp-shinned hawk 2 2<br />
golden-crowned kinglet 1 1<br />
great-horned owl 1 1<br />
house wren 1 1<br />
lark sparrow 1 1<br />
Lincoln's sparrow 1 1<br />
unidentified buteo 1 1<br />
white-crowned sparrow 1 1<br />
Avian Subtotal 223 1007<br />
Mammal Species<br />
Washington ground squirrel b 19 51<br />
white-tailed jack rabbit c 58 49<br />
mule deer d 6 40<br />
coyote 3 9<br />
unidentified deer 1 5<br />
badger 3 4<br />
deer mouse 7 7<br />
pocket gopher 2 2<br />
long-tailed weasel 1 1<br />
white-tailed deer 1 1<br />
Mammal Subtotal 101 170<br />
Reptile Species<br />
northern pacific rattlesnake 6 7<br />
yellow-bellied racer 2 2<br />
gopher snake 1 1<br />
Reptile Subtotal 9 10<br />
a Also, nest with two different droppings no actual individuals seen (no changes to table).<br />
b Also, nine sightings of holes or droppings (no changes to table).<br />
c Also, seven sightings of dropping or tracks and four dead carcasses (no changes to table).<br />
d Also, a lot of urine and feces at a station during one survey (no changes to table).<br />
<strong>Stateline</strong> <strong>Monitoring</strong> <strong>Final</strong> <strong>Report</strong> 50<br />
December 2004
Table 13. Summary of number of active buteo nests within 5 miles of <strong>Stateline</strong> 1 turbines<br />
and number of active and successful buteo nests within 2 miles of <strong>Stateline</strong> 1 and<br />
2 turbines.<br />
Within 5 miles<br />
of <strong>Stateline</strong> 1 turbines<br />
Within 2 miles<br />
of <strong>Stateline</strong> 1 turbines<br />
Within 2 miles<br />
of <strong>Stateline</strong> 1 and 2<br />
turbines<br />
2001 a 2002 2001 2002 2002 2003 2003<br />
# # # # # # #<br />
Species Active Active Active Active Successful Active Successful<br />
Washington<br />
Red-tailed hawk 9 11 5 7 na b 5 na<br />
Ferruginous hawk 1 1 1 1 1 1 0<br />
Swainson's hawk 5 6 0 0 0 1 1<br />
subtotal 15 18 6 8 7<br />
Oregon<br />
Red-tailed hawk 6 5 1 1 na 3 na<br />
Ferruginous hawk 5 5 2 2 1 2 2<br />
Swainson's hawk 4 4 2 1 0 2 1<br />
subtotal 15 14 5 4 7<br />
Overall<br />
Red-tailed hawk 15 16 6 8 na 8 na<br />
Ferruginous hawk 6 6 3 3 2 3 2<br />
Swainson's hawk 9 10 2 1 0 3 2<br />
Total 30 32 11 12 14<br />
a for the 2001 nest monitoring: Washington turbine string construction started in March whereas Oregon<br />
turbine string construction started after the nest season.<br />
b not applicable. Note: in 2002 and 2003 only special status species were monitored for success<br />
<strong>Stateline</strong> <strong>Monitoring</strong> <strong>Final</strong> <strong>Report</strong> 51<br />
December 2004
Table 14. Ferruginous hawk and Swainson’s hawk nesting data for nests active in 2001,<br />
2002, or 2003 that were located within 2 miles of <strong>Stateline</strong> 1 or 2 turbines.<br />
Species and<br />
record #<br />
Washington<br />
Ferruginous<br />
hawk (#5)<br />
Swainson’s<br />
hawk (#144)<br />
Oregon<br />
Ferruginous<br />
hawk (#21)<br />
Ferruginous<br />
hawk (#15)<br />
Ferruginous<br />
hawk (#137)<br />
Distance from<br />
nearest turbine<br />
string<br />
(<strong>Stateline</strong> 1 or 2)<br />
~1 mile from HG-A<br />
string<br />
~2 miles from PB<br />
string<br />
~ 1/2 mile from HG-J<br />
string<br />
1,122 ft. from HG-K<br />
string<br />
~1.75 miles from<br />
<strong>Stateline</strong> 2 turbines a .<br />
Not within 2-miles of<br />
<strong>Stateline</strong> 1 turbines.<br />
2001<br />
(preconstruction)<br />
Successful<br />
2 young<br />
fledged<br />
2002<br />
(pre-construction<br />
data for <strong>Stateline</strong> 2,<br />
post-construction<br />
data for <strong>Stateline</strong> 1)<br />
Successful<br />
unknown # of<br />
young fledged,<br />
likely 2<br />
2003<br />
(post-construction data for<br />
both <strong>Stateline</strong> 1 and<br />
<strong>Stateline</strong> 2)<br />
Active<br />
but not successful, adult birds<br />
shot<br />
Not active Not active New one discovered nearby in<br />
2003, near the historic nest<br />
site. Active, successful,<br />
unknown # of young fledged<br />
(not able to access nest site)<br />
Successful<br />
3 young<br />
fledged<br />
Successful<br />
2 young<br />
fledged<br />
Not active<br />
Successful<br />
4 young fledged<br />
Active<br />
but not successful<br />
Successful<br />
2 young fledged<br />
Used by GHOW in 2003<br />
Successful<br />
2 young fledged<br />
Successful<br />
1 or 2 fledged<br />
Swainson’s<br />
hawk (#11)<br />
~1 and ¾ miles<br />
from HG-K string, near<br />
<strong>Stateline</strong> 2 turbines<br />
Active<br />
but not<br />
successful<br />
Not active<br />
Bird in area near nest, nest had<br />
signs of being repaired, nest<br />
not considered active, (great<br />
horned owls roosting in same<br />
tree grove)<br />
Swainson’s<br />
hawk (#82)<br />
Swainson’s<br />
hawk (#139)<br />
~1/4 mile from HG-K<br />
and HG-J strings<br />
Near farm residence,<br />
~1,700 ft from HGJ<br />
Active<br />
but not<br />
successful,<br />
raven nest<br />
nearby<br />
Active<br />
but not successful,<br />
raven nest nearby<br />
Not active,<br />
nest was repaired slightly early<br />
in the season (tree is dying, has<br />
poor supporting branches).<br />
--- --- New nest in 2003. Active,<br />
constructed nest but did not lay<br />
eggs, nest abandoned<br />
Swainson’s<br />
hawk (#150)<br />
Near public road, ~2<br />
miles from HGJ<br />
a <strong>Stateline</strong> 2 was constructed fall of 2002, after the raptor nesting season.<br />
-- -- New nest in 2003<br />
Successful, one adult and one<br />
juvenile (ready to fledge) was<br />
shot by vandals. May have<br />
successfully fledged one<br />
young.<br />
<strong>Stateline</strong> <strong>Monitoring</strong> <strong>Final</strong> <strong>Report</strong> 52<br />
December 2004
Table 15. Burrowing owl locations discovered and monitored during the <strong>Stateline</strong><br />
<strong>Monitoring</strong> Study 2002-2003.<br />
Table<br />
ID<br />
State<br />
Located<br />
Historic Nest Site<br />
Active Prior To<br />
The First<br />
<strong>Monitoring</strong> Year<br />
(2002)<br />
1 WA Yes<br />
2 WA No<br />
3 WA Yes<br />
4 WA No<br />
5 WA No<br />
6 WA No<br />
7 OR Yes<br />
8 OR Yes<br />
9 OR No<br />
10 OR No<br />
11 OR No<br />
12 OR No<br />
13 OR Yes<br />
Nest Site Location Description and Activity Status<br />
(approximate distance to nearest turbine)<br />
Between turbine strings HGE & HGF, 112 meters to<br />
HGF-1. Nesting owls present during construction in 2001<br />
and also during operation in 2002. Specific site not active<br />
in 2003, but new site close to this site active in 2003 (#2).<br />
Down the draw from historic HGE & HGF site, new in<br />
2003. Close to #1, may be same individuals.<br />
Activity area 400 meters east of turbine string PB. Historic<br />
(1996-1999, K. Kronner pers. comm.) nest sites nearby.<br />
Site may support two separate pairs. Specific site not<br />
active in 2002, but new site was discovered and active in<br />
2002. Both new site and original site active in 2003.<br />
Located approximately 180 to 230 meters to turbine HGH<br />
9, new in 2002. Surveyed in 2003, not active<br />
111 meters to HGC-14, first discovered in 2002<br />
(the area was not surveyed prior to 2002) Surveyed in<br />
2003, not active.<br />
North of Nine Mile Substation west of access road, new in<br />
2003. Greater than 2 km from a turbine<br />
Along Warm Springs Rd., near WSA. Last active in 1999,<br />
two years prior to construction..<br />
Near underground elect. line 1.6 km northwest of BGB.<br />
Active in 2001, but not active in 2002 or 2003, but nearby<br />
sites active in 2003.<br />
Near underground elect. line northwest of BGB (the area<br />
was not surveyed prior to 2002). Active in 2002 but not in<br />
2003. Site within 650 m of turbine BGB-16<br />
West of BGB-16<br />
First discovered in 2003 in a new CRP field, area was later<br />
plowed, site was abandoned. Site nearby to #9 and #11.<br />
Approximately 300 meters northwest of BGB-16<br />
First discovered in 2003. In native grassland (pasture)<br />
305 meters northeast of BGB-16, new in 2003. Area<br />
previously surveyed in 2000, 2001 and 2002<br />
Historic - near Raymond Gulch, east of Butler Grade Road<br />
(not located near <strong>Stateline</strong> 1 or 2 turbines). Active in<br />
2001, 2002 and 2003.<br />
<strong>Stateline</strong> <strong>Monitoring</strong> <strong>Final</strong> <strong>Report</strong> 53<br />
December 2004
Table 16. Mean index of bird density for pre- and post- construction and the differences.<br />
Standard errors and 90% confidence intervals for the difference based on<br />
each year of surveys (pre-construction surveys in 2001, post-construction<br />
surveys in 2002).<br />
Pre Post Diff 90% Conf Ints b<br />
Species/Group Mean a mean a mean a Std. Err. LCL UCL<br />
grasshopper sparrow 0.139 0.083 -0.056 c 0.026 -0.101 -0.011<br />
horned lark 0.289 0.350 0.061 0.062 -0.046 0.168<br />
Savannah sparrow 0.025 0.047 0.022 0.016 -0.006 0.050<br />
western meadowlark 0.122 0.092 -0.031 0.031 -0.085 0.023<br />
Subtotal Grassland 0.578 0.583 0.006 0.084 -0.139 0.151<br />
a # observations/survey/5,000 m 2<br />
b Student’s t distribution intervals with 19 degrees of freedom. Degrees of freedom is the sample<br />
size minus 1, (= 19).<br />
c significantly different than 0 and negative, suggesting a negative impact due to the wind facility<br />
<strong>Stateline</strong> <strong>Monitoring</strong> <strong>Final</strong> <strong>Report</strong> 54<br />
December 2004
Table 17. Mean index of bird density for pre- and post- construction and the differences.<br />
Standard errors and 90% confidence intervals for the difference by sub-segment<br />
based on each year of surveys (pre-construction surveys in 2001, postconstruction<br />
surveys in 2002).<br />
Species/Group Subsegment<br />
Premeameamean<br />
Err LCL UCL<br />
Post-<br />
Diff-<br />
Std. 90% 90%<br />
grasshopper sparrow 1: 0-50 m 0.300 0.017 -0.283 a 0.103 -0.462 -0.105<br />
2: 51-100 m 0.083 0.000 -0.083 a 0.041 -0.154 -0.012<br />
3: 101-150 m 0.083 0.083 0.000 0.054 -0.094 0.094<br />
4: 151-200 m 0.117 0.067 -0.050 0.065 -0.163 0.063<br />
5: 201-250 m 0.150 0.100 -0.050 0.070 -0.170 0.070<br />
6: 251-300 m 0.100 0.233 0.133 0.082 -0.008 0.275<br />
horned lark 1: 0-50 m 0.333 0.283 -0.050 0.165 -0.334 0.234<br />
2: 51-100 m 0.367 0.333 -0.033 0.143 -0.280 0.214<br />
3: 101-150 m 0.283 0.267 -0.017 0.078 -0.152 0.119<br />
4: 151-200 m 0.167 0.217 0.050 0.091 -0.108 0.208<br />
5: 201-250 m 0.183 0.333 0.150 0.089 -0.003 0.303<br />
6: 251-300 m 0.400 0.667 0.267 0.191 -0.064 0.598<br />
savannah sparrow 1: 0-50 m 0.033 0.000 -0.033 0.033 -0.091 0.024<br />
2: 51-100 m 0.017 0.033 0.017 0.029 -0.034 0.067<br />
3: 101-150 m 0.017 0.000 -0.017 0.017 -0.045 0.012<br />
4: 151-200 m 0.050 0.033 -0.017 0.051 -0.105 0.072<br />
5: 201-250 m 0.017 0.083 0.067 0.046 -0.013 0.146<br />
6: 251-300 m 0.017 0.133 0.117 0.056 0.021 0.213<br />
western meadowlark 1: 0-50 m 0.050 0.000 -0.050 a 0.027 -0.097 -0.003<br />
2: 51-100 m 0.067 0.067 0.000 0.042 -0.072 0.072<br />
3: 101-150 m 0.150 0.100 -0.050 0.074 -0.177 0.077<br />
4: 151-200 m 0.100 0.067 -0.033 0.041 -0.105 0.038<br />
5: 201-250 m 0.167 0.183 0.017 0.092 -0.142 0.176<br />
6: 251-300 m 0.200 0.133 -0.067 0.107 -0.252 0.118<br />
Subtotal Grassland 1: 0-50 m 0.717 0.300 -0.417 a 0.206 -0.774 -0.060<br />
2: 51-100 m 0.533 0.467 -0.067 0.184 -0.384 0.251<br />
3: 101-150 m 0.533 0.450 -0.083 0.125 -0.300 0.133<br />
4: 151-200 m 0.450 0.383 -0.067 0.132 -0.294 0.161<br />
5: 201-250 m 0.517 0.717 0.200 0.122 -0.011 0.411<br />
6: 251-300 m 0.717 1.183 0.467 0.276 -0.011 0.944<br />
a significantly different than 0 and negative, suggesting a negative impact due to the wind facility<br />
<strong>Stateline</strong> <strong>Monitoring</strong> <strong>Final</strong> <strong>Report</strong> 55<br />
December 2004
Figure 1. Location of 2002 and 2003 standardized carcass search plots.<br />
<strong>Stateline</strong> <strong>Monitoring</strong> <strong>Final</strong> <strong>Report</strong> 56<br />
December 2004
Figure 2. Diagram of the dimensions and components of the <strong>Stateline</strong> <strong>Wind</strong> Turbines.<br />
<strong>Stateline</strong> <strong>Monitoring</strong> <strong>Final</strong> <strong>Report</strong> 57<br />
December 2004
Figure 3. Example carcass search plot HGA 7-9 including dimensions.<br />
<strong>Stateline</strong> <strong>Monitoring</strong> <strong>Final</strong> <strong>Report</strong> 58<br />
December 2004
Birds<br />
20<br />
# of fatalities<br />
15<br />
10<br />
5<br />
0<br />
0 10 20 30 40 50 60 70 80 90<br />
distance (m)<br />
Bats<br />
25<br />
20<br />
# of fatalities<br />
15<br />
10<br />
5<br />
0<br />
0 10 20 30 40 50 60 70<br />
distance (m)<br />
Figure 4. Distribution of distances from turbines to casualties for birds and bats<br />
found from July 2001 - December 2003.<br />
<strong>Stateline</strong> <strong>Monitoring</strong> <strong>Final</strong> <strong>Report</strong> 59<br />
December 2004
horned lark 38.6<br />
golden-crowned kinglet 9.5<br />
ring-necked pheasant 8.6<br />
western meadowlark 5.7<br />
chukar 3.3<br />
gray partridge 3.3<br />
other birds 31.0<br />
Resident Passerines 50.0<br />
Raptors 6.2<br />
Waterfowl/Waterbirds 1.0<br />
Other Birds 1.9<br />
Doves 0.5<br />
Upland Gamebirds 15.2<br />
Migrant Passerines 25.2<br />
Figure 5. The percent of fatalities for avian species and taxonomic groups (July 2001 –<br />
December 2003).<br />
<strong>Stateline</strong> <strong>Monitoring</strong> <strong>Final</strong> <strong>Report</strong> 60<br />
December 2004
2002<br />
Birds<br />
Raptors<br />
2003<br />
Birds<br />
Raptors<br />
Counts per month in 2003<br />
0 5 10 15 20 25<br />
Counts per month in 2003<br />
0 1 2 3 4 5<br />
Counts per month in 2002<br />
0 5 10 15 20<br />
Counts per month in 2002<br />
0 1 2 3 4<br />
Jan Feb Mar Apr May June July Aug Sep Oct Nov Dec<br />
Months<br />
Jan Feb Mar Apr May June July Aug Sep Oct Nov Dec<br />
Months<br />
Jan Feb Mar Apr May June July Aug Sep Oct Nov Dec<br />
Jan Feb Mar Apr May June July Aug Sep Oct Nov Dec<br />
Combined<br />
Months<br />
Birds<br />
Months<br />
Raptors<br />
Counts per month combined for 2002-2003<br />
0 10 20 30 40 50<br />
Jan Feb Mar Apr May June July Aug Sep Oct Nov Dec<br />
Months<br />
Jan Feb Mar Apr May June July Aug Sep Oct Nov Dec<br />
Figure 6. Distribution of all bird and raptor fatalities by month for each year (January<br />
2002 – December 2003).<br />
Counts per month combined for 2002-2003<br />
0 1 2 3 4 5 6<br />
Months<br />
<strong>Stateline</strong> <strong>Monitoring</strong> <strong>Final</strong> <strong>Report</strong> 61<br />
December 2004
Figure 7. Distribution of bird fatalities in the <strong>Stateline</strong> <strong>Wind</strong> <strong>Project</strong> (July 2001 – December 2003)<br />
<strong>Stateline</strong> <strong>Monitoring</strong> <strong>Final</strong> <strong>Report</strong> 62<br />
December 2004
Figure 8. Distribution of raptor fatalities in the <strong>Stateline</strong> <strong>Wind</strong> <strong>Project</strong> (July 2001 – December 2003)<br />
<strong>Stateline</strong> <strong>Monitoring</strong> <strong>Final</strong> <strong>Report</strong> 63<br />
December 2004
silver-haired bat 50.0<br />
little brown bat 0.8<br />
unidentified bat 1.6<br />
big brown bat 1.6<br />
hoary bat 46.1<br />
Figure 9. The percent of fatalities for bat species (July 2001 - December 2003).<br />
<strong>Stateline</strong> <strong>Monitoring</strong> <strong>Final</strong> <strong>Report</strong> 64<br />
December 2004
Figure 10. Distribution of bat fatalities in the <strong>Stateline</strong> <strong>Wind</strong> <strong>Project</strong> (July 2001 - December 2003)<br />
<strong>Stateline</strong> <strong>Monitoring</strong> <strong>Final</strong> <strong>Report</strong> 65<br />
December 2004
2002<br />
Bats<br />
Counts per month in 2002<br />
0 5 10 15<br />
Jan Feb Mar Apr May June July Aug Sep Oct Nov Dec<br />
2003<br />
Months<br />
Bats<br />
Counts per month in 2003<br />
0 10 20 30 40 50<br />
Jan Feb Mar Apr May June July Aug Sep Oct Nov Dec<br />
COMBINED<br />
Months<br />
Bats<br />
Counts per month combined for 2002-2003<br />
0 20 40 60<br />
Jan Feb Mar Apr May June July Aug Sep Oct Nov Dec<br />
Figure 11. Distribution of bat fatalities by month for each year and combined years (January 2002<br />
– December 2003).<br />
Months<br />
<strong>Stateline</strong> <strong>Monitoring</strong> <strong>Final</strong> <strong>Report</strong> 66<br />
December 2004
2002<br />
hoary bat<br />
silver-haired bat<br />
Counts per month in 2002<br />
0 2 4 6 8<br />
2003<br />
Jan Feb Mar Apr May June July Aug Sep Oct Nov Dec<br />
Months<br />
silver-haired bat<br />
Counts per month in 2003<br />
0 10 20 30<br />
Counts per month in 2002<br />
0 2 4 6<br />
Jan Feb Mar Apr May June July Aug Sep Oct Nov Dec<br />
Months<br />
hoary bat<br />
Counts per month in 2003<br />
0 5 10 15 20<br />
Combined<br />
Jan Feb Mar Apr May June July Aug Sep Oct Nov Dec<br />
Months<br />
hoary bat<br />
Jan Feb Mar Apr May June July Aug Sep Oct Nov Dec<br />
Months<br />
silver-haired bat<br />
Counts per month combined for 2002-2003<br />
0 5 10 15 20 25<br />
Jan Feb Mar Apr May June July Aug Sep Oct Nov Dec<br />
Months<br />
Counts per month combined for 2002-2003<br />
0 10 20 30 40<br />
Jan Feb Mar Apr May June July Aug Sep Oct Nov Dec<br />
Figure 11 (cont). Distribution of bat fatalities by month for each year (January 2002 - December<br />
2003) and combined years.<br />
Months<br />
<strong>Stateline</strong> <strong>Monitoring</strong> <strong>Final</strong> <strong>Report</strong> 67<br />
December 2004
100.00%<br />
90.00%<br />
80.00%<br />
70.00%<br />
% Remaining<br />
60.00%<br />
50.00%<br />
40.00%<br />
Large<br />
Small<br />
30.00%<br />
20.00%<br />
10.00%<br />
0.00%<br />
0 10 20 30 40<br />
Trial Day<br />
Figure 12. Results of avian carcass removal trials conducted July 2001 - December 2003.<br />
<strong>Stateline</strong> <strong>Monitoring</strong> <strong>Final</strong> <strong>Report</strong> 68<br />
December 2004
Bat Carcass Removal<br />
n=7 trial carcasses<br />
100<br />
90<br />
80<br />
70<br />
% Remaining<br />
60<br />
50<br />
40<br />
30<br />
20<br />
10<br />
0<br />
0 5 10 15 20<br />
Trial Day<br />
Figure 13. Results of bat carcass removal trials conducted fall 2003.<br />
<strong>Stateline</strong> <strong>Monitoring</strong> <strong>Final</strong> <strong>Report</strong> 69<br />
December 2004
All Birds<br />
Small Birds<br />
fatality estimates<br />
0.0 0.5 1.0 1.5 2.0 2.5<br />
fatality estimates<br />
0.0 0.5 1.0 1.5 2.0 2.5<br />
2002 2003 Overall<br />
Grassland Birds<br />
2002 2003 Overall<br />
Nocturnal Migrants<br />
fatality estimates<br />
0.0 0.5 1.0 1.5 2.0 2.5<br />
fatality estimates<br />
0.0 0.5 1.0 1.5 2.0 2.5<br />
2002 2003 Overall<br />
Large Birds<br />
2002 2003 Overall<br />
Raptors<br />
fatality estimates<br />
0.0 0.1 0.2 0.3 0.4<br />
fatality estimates<br />
0.0 0.1 0.2 0.3 0.4<br />
2002 2003 Overall<br />
Bats<br />
2002 2003 Overall<br />
fatality estimates<br />
0.0 0.5 1.0 1.5 2.0 2.5<br />
2002 2003 Overall<br />
Figure 14. Annual and overall fatality estimates (#/turbine/year adjusted for biases) for<br />
taxonomic and size classes of birds (January 2002 - December 2003).<br />
<strong>Stateline</strong> <strong>Monitoring</strong> <strong>Final</strong> <strong>Report</strong> 70<br />
December 2004
Nocturnal Migrants<br />
0.3<br />
0.25<br />
observed fatality rate<br />
0.2<br />
0.15<br />
0.1<br />
0.05<br />
0<br />
L A N L A N L A N<br />
2002 2003 OVERALL<br />
L: Lit<br />
A: Unlit but adjacent to lit<br />
N: Not lit, not adjacent to lit<br />
Bats<br />
observed fatality rate<br />
0.5<br />
0.45<br />
0.4<br />
0.35<br />
0.3<br />
0.25<br />
0.2<br />
0.15<br />
0.1<br />
0.05<br />
0<br />
L A N L A N L A N<br />
2002 2003 OVERALL<br />
Figure 15. Observed nocturnal migrant and bat fatality rates (#/turbine/year) for lit<br />
turbines “L”, unlit but adjacent to lit turbines “A”, and unlit turbines not<br />
adjacent to lit turbines “N” (January 2002 - December 2003).<br />
<strong>Stateline</strong> <strong>Monitoring</strong> <strong>Final</strong> <strong>Report</strong> 71<br />
December 2004
BIRDS<br />
Observed Fatality Rate<br />
1.6<br />
1.4<br />
1.2<br />
1<br />
0.8<br />
0.6<br />
0.4<br />
0.2<br />
Mean=0.71<br />
0<br />
HGN<br />
HGL<br />
BGC<br />
BGB<br />
HGD<br />
HGH<br />
HGE<br />
HGM<br />
HGA<br />
HGK<br />
HGC<br />
WSA<br />
HGB<br />
HGJ<br />
HGS<br />
PB<br />
WSB<br />
HGG<br />
Turbine Strings<br />
BATS<br />
0.8<br />
Observed Fatality Rate<br />
0.7<br />
0.6<br />
0.5<br />
0.4<br />
0.3<br />
0.2<br />
0.1<br />
Mean=0.28<br />
0<br />
BGC<br />
HGA<br />
WSB<br />
BGB<br />
PB<br />
HGK<br />
HGD<br />
HGH<br />
HGM<br />
HGL<br />
HGB<br />
HGJ<br />
HGC<br />
WSA<br />
HGS<br />
HGE<br />
HGG<br />
HGN<br />
Turbine Strings<br />
Figure 16. Observed fatality rates (#/turbine/year) by turbine string in 2002 and<br />
2003.<br />
<strong>Stateline</strong> <strong>Monitoring</strong> <strong>Final</strong> <strong>Report</strong> 72<br />
December 2004
HOLA= horned lark<br />
MALL= mallard<br />
RNPH= ring-necked pheasant<br />
WCSP= white-crowned<br />
sparrow<br />
NOHA= northern harrier<br />
CHUK= chukar<br />
GRPA= gray partridge<br />
RTHA= red-tailed hawk<br />
EUST= European starling<br />
CORA= common raven<br />
CAGO= Canada goose<br />
OTHE= Other passerine<br />
WEME= western<br />
meadowlark<br />
HOLA 63.7<br />
RTHA 1.6<br />
EUST 1.6<br />
CORA 3.7<br />
MALL 0.6<br />
RNPH 0.6<br />
WCSP 0.7<br />
NOHA 0.9<br />
CHUK 1.3<br />
GRPA 1.5<br />
CAGO 5.4<br />
WEME 12.9 OTHE 5.6<br />
Raptors 4.2<br />
Waterfowl/Waterbirds 6.2<br />
Other Birds 0.1<br />
Upland Gamebirds 3.4<br />
Passerines 86.0 Doves 0.0<br />
Figure 17. The percent composition of avian use for avian species and taxonomic<br />
groups (July 2001 - December 2003).<br />
<strong>Stateline</strong> <strong>Monitoring</strong> <strong>Final</strong> <strong>Report</strong> 73<br />
December 2004
mean use<br />
0.0 0.2 0.4 0.6 0.8 1.0 1.2 1.4<br />
Waterfowl/Waterbirds<br />
mean use<br />
0.0 0.05 0.10 0.15 0.20 0.25 0.30<br />
Raptors<br />
Spring Summer Fall Winter<br />
Spring Summer Fall Winter<br />
Passerines<br />
Upland Gamebirds<br />
mean use<br />
0 1 2 3<br />
mean use<br />
0.0 0.1 0.2 0.3<br />
mean use<br />
0.0 0.02 0.04 0.06 0.08 0.10<br />
Spring Summer Fall Winter<br />
Doves<br />
Spring Summer Fall Winter<br />
mean use<br />
0.0 0.02 0.06 0.10 0.14<br />
Spring Summer Fall Winter<br />
Other birds<br />
Spring Summer Fall Winter<br />
Figure 18. Avian use (#/10-minute survey) by season for taxonomic groups for entire study<br />
period (July 2001 - December 2003).<br />
<strong>Stateline</strong> <strong>Monitoring</strong> <strong>Final</strong> <strong>Report</strong> 74<br />
December 2004
Grassland Species<br />
Post-Pre difference<br />
-0.5 0.0 0.5 1.0<br />
1 2 3 4 5 6<br />
Subsegment<br />
Grasshopper sparrow<br />
Post-Pre difference<br />
-0.4 -0.2 0.0 0.2 0.4<br />
1 2 3 4 5 6<br />
Subsegment<br />
Figure 19. Differences in mean use (post-construction [2002] minus pre-construction<br />
[2001]) and 90% confidence intervals for grassland birds combined and for<br />
grasshopper sparrows. Subsegment 1: 0 – 50 m from turbine string; 2: 51-100<br />
m; 3: 101-150 m; 4: 151-200 m; 5: 201-250 m; 6: 251-300 m. Confidence<br />
intervals that do not overlap the value 0 indicate statistically significant effects.<br />
<strong>Stateline</strong> <strong>Monitoring</strong> <strong>Final</strong> <strong>Report</strong> 75<br />
December 2004
Horned lark<br />
Post-Pre difference<br />
-0.4 -0.2 0.0 0.2 0.4 0.6<br />
1 2 3 4 5 6<br />
Subsegment<br />
Western meadowlark<br />
Post-Pre difference<br />
-0.3 -0.2 -0.1 0.0 0.1 0.2 0.3<br />
1 2 3 4 5 6<br />
Subsegment<br />
Figure 20. Differences in mean use (post-construction [2002] minus pre-construction<br />
[2001]) and 90% confidence intervals for horned lark and western<br />
meadowlark. Subsegment 1: 0– 50 m from turbine string; 2: 51-100 m; 3: 101-<br />
150 m; 4: 151-200 m; 5: 201-250 m; 6: 251-300 m. Confidence intervals that do<br />
not overlap the value 0 indicate statistically significant effects.<br />
<strong>Stateline</strong> <strong>Monitoring</strong> <strong>Final</strong> <strong>Report</strong> 76<br />
December 2004
Bird Fatality Estimates<br />
14<br />
# bird fatalities/MW/yr<br />
12<br />
10<br />
8<br />
6<br />
4<br />
2<br />
Columbia Basin<br />
Mean=3.1/MW/yr<br />
0<br />
SL VAN KLO NC FC1 FC2 WIS BR1 BR2 BR3 BM<br />
LEGEND<br />
SL: <strong>Stateline</strong> Oregon and Washington, 660 kW (this report)<br />
VAN: Vansycle Oregon, 660 kW (Erickson et al. 2000)<br />
KLO: Klondike Oregon, 1.5 MW (Johnson et al. 2003b)<br />
NC: Nine Canyon Washington, 1.3 MW (Erickson et al. 2003b)<br />
FC1: Phase I Foote Creek Rim Wyoming 600 kW (Young et al. 2003)<br />
FC2: Phase II Foote Creek Rim Wyoming 750 kW (Young et al. 2003)<br />
WIS: MGE and WPSC turbines, Wisconsin 660 kW (Howe et al. 2002)<br />
BR1: Phase I Buffalo Ridge Minnesota, 300 kW (Johnson et al. 2002)<br />
BR2: Phase II Buffalo Ridge Minnesota, 750 kW (Johnson et al. 2002)<br />
BR3: Phase IIII Buffalo Ridge Minnesota 750 kW (Johnson et al. 2002)<br />
BM: Buffalo Mountain, Tennessee 660 kW (Nicholson 2003)<br />
Figure 21. Standardized bird fatality estimates from new generation wind projects<br />
in the U.S. We only included studies that provided estimates adjusted for<br />
scavenging and searcher efficiency and that were conducted for a minimum<br />
of 1 year. Mean estimate weighted by MW of individual projects.<br />
<strong>Stateline</strong> <strong>Monitoring</strong> <strong>Final</strong> <strong>Report</strong> 77<br />
December 2004
Bat Fatality Estimates<br />
# bat fatalities/MW/year<br />
50<br />
45<br />
40<br />
35<br />
30<br />
25<br />
20<br />
15<br />
10<br />
5<br />
0<br />
Columbia Basin<br />
Mean=2.2/MW/yr<br />
SL VAN KLO NC FC1 FC2 WIS BR1 BR2 BR3 BM<br />
LEGEND<br />
SL: <strong>Stateline</strong> Oregon and Washington, 660 kW (this report)<br />
VAN: Vansycle Oregon, 660 kW (Erickson et al. 2000)<br />
KLO: Klondike Oregon, 1.5 MW (Johnson et al. 2003b)<br />
NC: Nine Canyon Washington, 1.3 MW (Erickson et al. 2003b)<br />
FC1: Phase I Foote Creek Rim Wyoming 600 kW (Young et al. 2003)<br />
FC2: Phase II Foote Creek Rim Wyoming 750 kW (Young et al. 2003)<br />
WIS: MGE and WPSC turbines, Wisconsin 660 kW (Howe et al. 2002)<br />
BR1: Phase I Buffalo Ridge Minnesota, 300 kW (Johnson et al. 2002)<br />
BR2: Phase II Buffalo Ridge Minnesota, 750 kW (Johnson et al. 2002)<br />
BR3: Phase IIII Buffalo Ridge Minnesota 750 kW (Johnson et al. 2002)<br />
BM: Buffalo Mountain, Tennessee 660 kW (Nicholson 2003)<br />
Figure 22. Standardized bat fatality estimates from new generation wind projects in<br />
the U.S. We only included studies that provided estimates adjusted for<br />
scavenging and searcher efficiency and that were conducted for a minimum<br />
of 1 year. Mean estimate weighted by MW of individual projects.<br />
<strong>Stateline</strong> <strong>Monitoring</strong> <strong>Final</strong> <strong>Report</strong> 78<br />
December 2004
APPENDIX A-1 - List of Washington turbines sampled during the standardized searches<br />
from July 2001 through December 2002.<br />
Turbine Dominant Turbine FAA Carcass Turbine Dominant Turbine FAA Carcass<br />
Count ID Habitat a Position b Light Plot ID Count ID Habitat a Position b Light Plot ID<br />
1 HGA7 AD M 0 HGA 7-9 31 PB15 GR D 1 PB 15-17<br />
2 HGA8 AD M 0 HGA 7-9 32 PB16 GR M 1 PB 15-17<br />
3 HGA9 AD M 0 HGA 7-9 33 PB17 GR M 0 PB 15-17<br />
4 HGB1 GR E 1 HGB 1-3 34 PB28 GR M 0 PB 28-30<br />
5 HGB2 GR M 0 HGB 1-3 35 PB29 GR M 0 PB 28-30<br />
6 HGB3 GR M 0 HGB 1-3 36 PB30 GR M 1 PB 28-30<br />
7 HGB12 GR M 0 HGB 12-14 37 PB39 GR M 0 PB 39-41<br />
8 HGB13 GR M 0 HGB 12-14 38 PB40 GR M 0 PB 39-41<br />
9 HGB14 GR E 1 HGB 12-14 39 PB41 GR M 0 PB 39-41<br />
10 HGA20 AD M 0 HGA 20-22 40 PB51 GR M 0 PB 51-53<br />
11 HGA21 AD M 0 HGA 20-22 41 PB52 GR M 0 PB 51-53<br />
12 HGA22 AD M 0 HGA 20-22 42 PB53 GR M 1 PB 51-53<br />
13 HGC11 GR M 0 HGC 11-14 43 PB74 GR M 0 PB 74-77<br />
14 HGC12 GR M 0 HGC 11-14 44 PB75 GR M 0 PB 74-77<br />
15 HGC13 GR M 0 HGC 11-14 45 PB76 GR M 0 PB 74-77<br />
16 HGC14 GR E 1 HGC 11-14 46 WSA19 GR M 0 WSA 19-21<br />
17 HGC24 GR M 0 HGC 24-26 47 WSA20 GR M 0 WSA 19-21<br />
18 HGC25 GR M 1 HGC 24-26 48 WSA21 GR M 0 WSA 19-21<br />
19 HGC26 GR M 0 HGC 24-26 49 WSA43 GR M 0 WSA 43-45<br />
20 HGD4 GR M 0 HGD 4-6 50 WSA44 GR M 0 WSA 43-45<br />
21 HGD5 GR M 0 HGD 4-6 51 WSA45 GR M 1 WSA 43-45<br />
22 HGD6 GR E 1 HGD 4-6 52 WSB4 GR E 1 WSB 4-6<br />
23 HGG1 GR E 1 HGG 1-3 53 WSB5 GR M 0 WSB 4-6<br />
24 HGG2 AD M 0 HGG 1-3 54 WSB6 GR M 0 WSB 4-6<br />
25 HGG3 AD E 1 HGG 1-3 55 WSB16 GR M 0 WSB 16-18<br />
26 HGH16 SS E 1 HGH 16-18 56 WSB17 GR M 0 WSB 16-18<br />
27 HGH17 SS M 0 HGH 16-18 57 WSB18 GR M 0 WSB 16-18<br />
28 HGH18 SS M 0 HGH 16-18 58 WSB29 GR M 1 WSB 29-31<br />
29 PB4 GR D 0 PB 4-5 59 WSB30 GR M 0 WSB 29-31<br />
30 PB5 GR M 1 PB 4-5 60 WSB31 GR M 0 WSB 29-31<br />
a<br />
AD=agriculture dry, GR=grassland (crested wheatgrass or native bunchgrass), SS=Shrub/steppe<br />
b<br />
Turbine position: E=end-row, D=discontinuous/saddle, M=mid-row<br />
<strong>Stateline</strong> <strong>Monitoring</strong> <strong>Final</strong> <strong>Report</strong> 79<br />
December 2004
APPENDIX A-2 - List of Oregon turbines sampled during the standardized searches<br />
from January through December 2002.<br />
Turbine Dominant Turbine FAA Carcass Turbine Dominant Turbine FAA Carcass<br />
Count ID Habitat a Position b Light Plot ID Count ID Habitat a Position b Light Plot ID<br />
1 BGB16 GR E 1 BGB 16-18 33 HGK10 AD D 0 HGK 7-10<br />
2 BGB17 GR M 0 BGB 16-18 34 HGL1 AD E 1 HGL 1-2<br />
3 BGB18 GR M 0 BGB 16-18 35 HGL2 GR/AD D 0 HGL 1-2<br />
4 BGB22 GR M 0 BGB 22-23 36 HGM1 SS E 1 HGM 1-4<br />
5 BGB23 GR E 1 BGB 22-23 37 HGM2 GR M 0 HGM 1-4<br />
6 BGC16 GR M 1 BGC 16-19 38 HGM3 GR M 0 HGM 1-4<br />
7 BGC17 GR M 0 BGC 16-19 39 HGM4 GR M 0 HGM 1-4<br />
8 BGC18 GR M 0 BGC 16-19 40 HGM8 GR M 0 HGM 8-9<br />
9 BGC19 GR E 1 BGC 16-19 41 HGM9 GR D 0 HGM 8-9<br />
10 HGJ6 AD M 1 HGJ 6-8 42 HGM15 GR M 0 HGM 15-18<br />
11 HGJ7 AD M 0 HGJ 6-8 43 HGM16 GR M 0 HGM 15-18<br />
12 HGJ8 AD D 0 HGJ 6-8 44 HGM17 GR M 0 HGM 15-18<br />
13 HGJ13 AD M 0 HGJ 13-15 45 HGM18 GR E 1 HGM 15-18<br />
14 HGJ14 AD M 0 HGJ 13-15 46 HGN8 GR M 0 HGN 8-9<br />
15 HGJ15 AD M 0 HGJ 13-15 47 HGN9 GR E 1 HGN 8-9<br />
16 HGJ19 AD M 0 HGJ 19-21 48 PB77 GR E 1 PB 74-77<br />
17 HGJ20 AD M 0 HGJ 19-21 49 PB81 GR M 0 PB 81-83<br />
18 HGJ21 AD M 1 HGJ 19-21 50 PB82 GR M 1 PB 81-83<br />
19 HGJ27 GR/AD D 0 HGJ 27-29 51 PB83 GR M 0 PB 81-83<br />
20 HGJ28 GR/AD M 1 HGJ 27-29 52 PB87 GR E 1 PB 87-90<br />
21 HGJ29 GR/AD M 0 HGJ 27-29 53 PB88 GR M 0 PB 87-90<br />
22 HGJ33 GR/AD M 1 HGJ 33-35 54 PB89 GR M 0 PB 87-90<br />
23 HGJ34 GR/AD M 0 HGJ 33-35 55 PB90 GR E 1 PB 87-90<br />
24 HGJ35 GR/AD M 0 HGJ 33-35 56 PB95 GR D 1 PB 95-97<br />
25 HGJ40 GR/AD M 0 HGJ 40-42 57 PB96 GR D 0 PB 95-97<br />
26 HGJ41 GR/AD M 0 HGJ 40-42 58 PB97 GR E 1 PB 95-97<br />
27 HGJ42 GR/AD D 0 HGJ 40-42 59 WSB45 GR M 0 WSB 45-47<br />
28 HGK2 AD E 1 HGK 2-3 60 WSB46 GR M 1 WSB 45-47<br />
29 HGK3 AD E 1 HGK 2-3 61 WSB47 GR M 0 WSB 45-47<br />
30 HGK7 AD M 0 HGK 7-10 62 WSB52 GR D 1 WSB 52-54<br />
31 HGK8 AD M 0 HGK 7-10 63 WSB53 GR M 0 WSB 52-54<br />
32 HGK9 AD M 1 HGK 7-10 64 WSB54 GR M 0 WSB 52-54<br />
a<br />
AD=agriculture dry, GR=grassland (crested wheatgrass or native bunchgrass), SS=Shrub/steppe<br />
b<br />
Turbine position: E=end-row, D=discontinuous/saddle, M=mid-row<br />
<strong>Stateline</strong> <strong>Monitoring</strong> <strong>Final</strong> <strong>Report</strong> 80<br />
December 2004
APPENDIX A-3 - List of Washington turbines sampled during the standardized searches<br />
from January through December 2003.<br />
Turbine Dominant Turbine FAA Carcass Turbine Dominant Turbine FAA Carcass<br />
Count ID Habitat a Position b Light Plot ID Count ID Habitat a Position b Light Plot ID<br />
1 HGA1 AD E 1 HGA 1-3 31 PB10 GR M 0 PB 9-11<br />
2 HGA2 AD M 0 HGA 1-3 32 PB11 GR M 0 PB 9-11<br />
3 HGA3 AD M 0 HGA 1-3 33 PB21 GR M 1 PB 21-24<br />
4 HGA13 AD M 0 HGA 13-15 34 PB22 GR M 0 PB 21-24<br />
5 HGA14 AD M 1 HGA 13-15 35 PB23 GR M 0 PB 21-24<br />
6 HGA15 AD M 0 HGA 13-15 36 PB24 GR D 1 PB 21-24<br />
7 HGB7 GR M 0 HGB 7-8 37 PB33 GR D 1 PB 33-35<br />
8 HGB8 GR D 0 HGB 7-8 38 PB34 GR M 0 PB 33-35<br />
9 HGC4 GR M 0 HGC 4-6 39 PB35 GR M 0 PB 33-35<br />
10 HGC5 GR M 0 HGC 4-6 40 PB45 GR M 0 PB 45-47<br />
11 HGC6 GR E 1 HGC 4-6 41 PB46 GR M 0 PB 45-47<br />
12 HGC18 GR M 0 HGC 18-20 42 PB47 GR M 0 PB 45-47<br />
13 HGC19 GR M 0 HGC 18-20 43 PB67 GR D 1 PB 67-69<br />
14 HGC20 GR M 1 HGC 18-20 44 PB68 GR M 0 PB 67-69<br />
15 HGC30 GR M 0 HGC 30-32 45 PB69 GR M 0 PB 67-69<br />
16 HGC31 GR M 0 HGC 30-32 46 WSA13 GR E 1 WSA 13-15<br />
17 HGC32 GR E 1 HGC 30-32 47 WSA14 GR M 0 WSA 13-15<br />
18 HGE1 GR E 1 HGE 1-4 48 WSA15 GR M 0 WSA 13-15<br />
19 HGE2 GR M 0 HGE 1-4 49 WSA25 GR M 0 WSA 25-27<br />
20 HGE3 GR M 0 HGE 1-4 50 WSA26 GR M 0 WSA 25-27<br />
21 HGE4 GR E 0 HGE 1-4 51 WSA27 GR M 1 WSA 25-27<br />
22 HGG10 AD M 0 HGG 10-11 52 WSA37 GR M 1 WSA 37-39<br />
23 HGG11 AD E 1 HGG 10-11 53 WSA38 GR M 0 WSA 37-39<br />
24 HGH10 SS E 1 HGH 10-12 54 WSA39 GR M 0 WSA 37-39<br />
25 HGH11 SS M 0 HGH 10-12 55 WSB10 GR M 0 WSB 10-12<br />
26 HGH12 SS M 0 HGH 10-12 56 WSB11 GR M 0 WSB 10-12<br />
27 HGJ3 AD M 0 HGJ 3-5 57 WSB12 GR M 0 WSB 10-12<br />
28 HGJ4 AD M 0 HGJ 3-5 58 WSB23 GR M 1 WSB 23-25<br />
29 HGJ5 AD M 0 HGJ 3-5 59 WSB24 GR M 0 WSB 23-25<br />
30 PB9 GR M 1 PB 9-11 60 WSB25 GR D 0 WSB 23-25<br />
a<br />
AD=agriculture dry, GR=grassland (crested wheatgrass or native bunchgrass), SS=Shrub/steppe<br />
b<br />
Turbine position: E=end-row, D=discontinuous/saddle, M=mid-row<br />
<strong>Stateline</strong> <strong>Monitoring</strong> <strong>Final</strong> <strong>Report</strong> 81<br />
December 2004
APPENDIX A-4 - List of Oregon turbines sampled during the standardized searches<br />
from January through December 2003.<br />
Turbine Dominant Turbine FAA Carcass Turbine Dominant Turbine FAA Carcass<br />
Count ID Habitat a Position b Light Plot ID Count ID Habitat a Position b Light Plot ID<br />
1 BGB19 GR M 0 BGB 19-22 47 HGS6 AD E 0 HGS 6-7<br />
2 BGB20 GR M 1 BGB 19-22 48 HGS7 AD E 1 HGS 6-7<br />
3 BGB21 GR M 0 BGB 19-22 49 HGS8 AD E 1 HGS 8-9<br />
4 BGB22 GR M 0 BGB 19-22 50 HGS9 AD D 0 HGS 8-9<br />
5 BGC13 GR E 1 BGC 13-16 51 HGS10 AD D 1 HGS 10-13<br />
6 BGC14 GR M 0 BGC 13-16 52 HGS11 AD M 0 HGS 10-13<br />
7 BGC15 GR M 0 BGC 13-16 53 HGS12 AD M 0 HGS 10-13<br />
8 BGC16 GR M 1 BGC 13-16 54 HGS13 AD E 1 HGS 10-13<br />
9 HGJ10 AD D 0 HGJ 10-12 55 HGS17 AD M 1 HGS 17-18<br />
10 HGJ11 AD M 0 HGJ 10-12 56 HGS18 AD M 0 HGS 17-18<br />
11 HGJ12 AD M 1 HGJ 10-12 57 HGS22 AD E 0 HGS 22-23<br />
12 HGJ16 AD M 1 HGJ 16-18 58 HGS23 AD D 0 HGS 22-23<br />
13 HGJ17 AD M 0 HGJ 16-18 59 HGS26 AD M 0 HGS 26-27<br />
14 HGJ18 AD M 0 HGJ 16-18 60 HGS27 AD E 0 HGS 26-27<br />
15 HGJ22 AD M 0 HGJ 22-25 61 HGS28 AD E 1 HGS 28-30<br />
16 HGJ23 AD M 0 HGJ 22-25 62 HGS29 AD M 0 HGS 28-30<br />
17 HGJ24 AD M 0 HGJ 22-25 63 HGS30 AD M 0 HGS 28-30<br />
18 HGJ25 AD D 0 HGJ 22-25 64 HGS35 AD E 1 HGS 35-37<br />
19 HGJ30 GR/AD M 0 HGJ 30-32 65 HGS36 AD M 0 HGS 35-37<br />
20 HGJ31 GR/AD M 0 HGJ 30-32 66 HGS37 AD M 0 HGS 35-37<br />
21 HGJ32 GR/AD M 0 HGJ 30-32 67 HGS45 AD E 1 HGS 45-47<br />
22 HGJ36 GR/AD M 0 HGJ 36-39 68 HGS46 AD M 0 HGS 45-47<br />
23 HGJ37 GR/AD M 0 HGJ 36-39 69 HGS47 AD M 0 HGS 45-47<br />
24 HGJ38 GR/AD M 1 HGJ 36-39 70 HGS51 AD M 0 HGS 51-53<br />
25 HGJ39 GR/AD M 0 HGJ 36-39 71 HGS52 AD M 1 HGS 51-53<br />
26 HGJ44 GR/AD E 1 HGJ 44 72 HGS53 AD M 0 HGS 51-53<br />
27 HGK4 AD E 1 HGK 4-6 73 HGS57 AD E 1 HGS 57-60<br />
28 HGK5 AD M 0 HGK 4-6 74 HGS58 AD M 0 HGS 57-60<br />
29 HGK6 AD M 0 HGK 4-6 75 HGS59 AD M 0 HGS 57-60<br />
30 HGK11 AD D 0 HGK 11-13 76 HGS60 AD E 1 HGS 57-60<br />
31 HGK12 AD M 0 HGK 11-13 77 PB78 GR E 1 PB 78-80<br />
32 HGK13 AD E 1 HGK 11-13 78 PB79 GR M 0 PB 78-80<br />
33 HGL3 GR/AD D 0 HGL 3-6 79 PB80 GR M 0 PB 78-80<br />
34 HGL4 GR/AD M 0 HGL 3-6 80 PB84 GR M 0 PB 84-86<br />
35 HGL5 GR/AD M 0 HGL 3-6 81 PB85 GR M 0 PB 84-86<br />
36 HGL6 GR/AD E 1 HGL 3-6 82 PB86 GR E 1 PB 84-86<br />
37 HGM5 GR D 0 HGM 5-7 83 PB91 GR E 1 PB 91-94<br />
38 HGM6 GR M 0 HGM 5-7 84 PB92 GR M 0 PB 91-94<br />
39 HGM7 GR M 1 HGM 5-7 85 PB93 GR M 0 PB 91-94<br />
40 HGM11 GR D 0 HGM 11-14 86 PB94 GR D 1 PB 91-94<br />
41 HGM12 GR M 0 HGM 11-14 87 WSB48 GR M 0 WSB 48-50<br />
42 HGM13 GR M 1 HGM 11-14 88 WSB49 GR M 0 WSB 48-50<br />
43 HGM14 GR M 0 HGM 11-14 89 WSB50 GR D 0 WSB 48-50<br />
44 HGN5 GR E 1 HGN 5-7 90 WSB55 GR M 0 WSB 55-58<br />
45 HGN6 GR M 0 HGN 5-7 91 WSB56 GR M 0 WSB 55-58<br />
46 HGN7 GR M 0 HGN 5-7 92 WSB57 GR M 0 WSB 55-58<br />
93 WSB58 GR E 1 WSB 55-58<br />
a<br />
AD=agriculture dry, GR=grassland (crested wheatgrass or native bunchgrass), SS=Shrub/steppe<br />
b<br />
Turbine position: E=end-row, D=discontinuous/saddle, M=mid-row<br />
<strong>Stateline</strong> <strong>Monitoring</strong> <strong>Final</strong> <strong>Report</strong> 82<br />
December 2004
APPENDIX B-1 - List of standardized search plots surveyed and effort from July through<br />
December 2001 in Washington.<br />
# Turbines Effective Effective<br />
Completely # Turbines # Plot # Turbine<br />
Plot ID Searched a Searched b Searches Searches<br />
HGA 7-9 3 4 1 4<br />
HGA 20-22 3 3.5 2 7<br />
HGB 1-3 3 3.5 2 7<br />
HGB 12-14 3 3.5 2 7<br />
HGC 11-14 4 4.5 8 36<br />
HGC 24-26 3 4 8 32<br />
HGD 4-6 3 3.5 8 28<br />
HGG 1-3 3 3 2 6<br />
HGH 16-18 3 3.5 2 7<br />
PB 4-5 2 3 2 6<br />
PB 15-17 3 3.5 5 17.5<br />
PB 51-53 3 4 7 13<br />
PB 28-30 3 4 7 28<br />
PB 39-41 3 4 7 28<br />
PB 74-77 (74-76) 3 3.5 1 3.5<br />
WSA 19-21 3 3.5 5 17.5<br />
WSA 43-45 3 3.5 5 17.5<br />
WSB 4-6 3 3.5 2 7<br />
WSB 16-18 3 4 2 8<br />
WSB 29-31 3 4 3 12<br />
Total 60 73.5 81 292<br />
a # turbines that are searched at least out to 63 m in all directions<br />
b effective # of turbines searched. Most adjacent turbines within a string are slightly over 70 m<br />
apart, and the boundary of the standardized search plot was typically extended to this adjacent<br />
turbine.<br />
<strong>Stateline</strong> <strong>Monitoring</strong> <strong>Final</strong> <strong>Report</strong> 83<br />
December 2004
APPENDIX B-2 - List of standardized search plots surveyed and effort from January<br />
through December 2002.<br />
# Turbines Effective Effective<br />
Completely # Turbines # Plot # Turbine<br />
Plot ID Searched a Searched b Searches Searches<br />
Oregon<br />
BGB 16-18 3 3.5 16 56<br />
BGB 22-23 2 2.5 16 40<br />
BGC 16-19 4 4.5 16 72<br />
HGJ 6-8 3 3.5 16 56<br />
HGJ 13-15 3 4 16 64<br />
HGJ 19-21 c 3 3 15 45<br />
HGJ 27-29 c 3 3.5 15 52.5<br />
HGJ 33-35 3 4 16 64<br />
HGJ 40-42 3 3.5 16 56<br />
HGK 2-3 2 2 16 32<br />
HGK 7-10 4 4.5 16 72<br />
HGL 1-2 2 2 16 32<br />
HGM 1-4 4 4 16 64<br />
HGM 8-9 2 2.5 16 40<br />
HGM 15-18 4 4.5 16 72<br />
HGN 8-9 2 2.5 16 40<br />
PB 74-77 (77) 1 1 16 16<br />
PB 81-83 3 4 16 64<br />
PB 87-90 4 4 16 64<br />
PB 95-97 3 3 16 48<br />
WSB 45-47 3 3.5 16 56<br />
WSB 52-54 3 3.5 16 56<br />
Oregon total 64 73 350 1161.5<br />
Washington<br />
HGA 7-9 3 4 16 64<br />
HGA 20-22 3 3.5 16 56<br />
HGB 1-3 3 3.5 16 56<br />
HGB 12-14 3 3.5 16 56<br />
HGC 11-14 4 4.5 16 72<br />
HGC 24-26 3 4 16 64<br />
HGD 4-6 3 3.5 16 56<br />
HGG 1-3 3 3 16 48<br />
HGH 16-18 3 3.5 16 56<br />
PB 4-5 2 3 16 48<br />
PB 15-17 3 3.5 16 56<br />
PB 28-30 3 4 16 64<br />
PB 39-41 3 4 16 64<br />
PB 51-53 3 4 16 64<br />
PB 74-77 (74-76) 3 3.5 16 56<br />
WSA 19-21 3 3.5 16 56<br />
WSA 43-45 3 3.5 16 56<br />
WSB 4-6 3 3.5 16 56<br />
WSB 16-18 3 4 16 64<br />
WSB 29-31 3 4 16 64<br />
Washington total 60 73.5 320 1176<br />
Total 124 146.5 670 2337.5<br />
a # turbines that are searched at least out to 63 m in all directions<br />
b effective # of turbines searched. Most adjacent turbines within a string are slightly over 70 m apart,<br />
and the boundary of the standardized search plot was typically extended to this adjacent turbine.<br />
c<br />
one survey period was missed due to construction and maintenance activities in the area<br />
<strong>Stateline</strong> <strong>Monitoring</strong> <strong>Final</strong> <strong>Report</strong> 84<br />
December 2004
APPENDIX B-3 - List of standardized search plots surveyed and effort from January<br />
through December 2003.<br />
# Turbines Effective Effective<br />
Completely # Turbines # Plot # Turbine<br />
Plot ID Searched a Searched b Searches Searches<br />
Oregon<br />
BGB 19-22 4 5 17 85<br />
BGC 13-16 4 4.5 17 76.5<br />
HGJ 10-12 3 3.5 17 59.5<br />
HGJ 16-18 3 4 17 68<br />
HGJ 22-25 4 4.5 17 76.5<br />
HGJ 30-32 3 4 17 68<br />
HGJ 36-39 4 5 17 85<br />
HGJ 44 1 1 17 17<br />
HGK 4-6 3 3.5 17 59.5<br />
HGK 11-13 3 3 17 51<br />
HGL 3-6 4 4 17 68<br />
HGM 5-7 3 4 17 68<br />
HGM 11-14 4 4.5 17 76.5<br />
HGN 5-7 3 3.5 17 59.5<br />
HGS 6-7 2 2 17 34<br />
HGS 8-9 2 2 17 34<br />
HGS 10-13 4 4 17 68<br />
HGS 17-18 2 2.25 17 38.25<br />
HGS 22-23 2 2 16 32<br />
HGS 26-27 2 2.25 17 38.25<br />
HGS 28-30 3 3.25 17 55.25<br />
HGS 35-37 3 3.25 17 55.25<br />
HGS 45-47 3 3.25 17 55.25<br />
HGS 51-53 3 3.5 17 59.5<br />
HGS 57-60 4 4 17 68<br />
PB 78-80 3 3.5 17 59.5<br />
PB 84-86 3 3.5 17 59.5<br />
PB 91-94 4 4 17 68<br />
WSB 48-50 3 3.5 17 59.5<br />
WSB 55-58 4 4.5 17 76.5<br />
Oregon total 93 104.75 509 1778.75<br />
Washington<br />
HGA 1-3 3 3.5 17 59.5<br />
HGA 13-15 3 4 17 68<br />
HGB 7-8 2 3 17 51<br />
HGC 4-6 3 3.5 17 59.5<br />
HGC 18-20 3 4 17 68<br />
HGC 30-32 3 3.5 17 59.5<br />
HGE 1-4 4 4 17 68<br />
HGG 10-11 2 2.5 17 42.5<br />
HGH 10-12 3 3.5 17 59.5<br />
HGJ 3-5 3 4 17 68<br />
PB 9-11 3 4 17 68<br />
PB 21-24 4 4.5 17 76.5<br />
PB 33-35 3 3.5 17 59.5<br />
PB 45-47 3 4 17 68<br />
PB 67-69 3 3.5 17 59.5<br />
WSA 13-15 3 3 17 51<br />
WSA 25-27 3 4 17 68<br />
WSA 37-39 3 4 17 68<br />
WSB 10-12 3 4 17 68<br />
WSB 23-25 3 3.5 17 59.5<br />
Washington total 60 73.5 340 1249.5<br />
Total 153 178.25 849 3028.25<br />
# turbines that are searched at least out to 63 m in all directions<br />
b effective # of turbines searched. Most adjacent turbines within a string are slightly over 70 m apart,<br />
and the boundary of the standardized search plot was typically extended to this adjacent turbine.<br />
<strong>Stateline</strong> <strong>Monitoring</strong> <strong>Final</strong> <strong>Report</strong> 85<br />
December 2004
APPENDIX C-1 - List of Oregon and Washington turbines sampled during the WRRS<br />
protocol searches from January through December 2002.<br />
OREGON WRRS Search Plots WASHINGTON WRRS Search Plots<br />
Turbine Dominant Turbine Turbine Dominant Turbine<br />
Count ID Habitat a Position b Count ID Habitat Position<br />
1 BGB20 GR M 1 HGB5 GR M<br />
2 HGJ11 AD M 2 HGB10 GR M<br />
3 HGJ24 GR/AD M 3 HGC4 GR M<br />
4 HGJ37 GR/AD M 4 HGC9 GR M<br />
5 HGK5 AD M 5 HGC18 GR M<br />
6 HGK12 AD M 6 HGD1 GR E<br />
7 HGL4 GR M 7 HGE3 GR M<br />
8 HGM6 GR M 8 HGE8 GR E<br />
9 HGM12 GR M 9 HGG10 AD M<br />
10 HGN6 GR M 10 HGH8 SS M<br />
11 PB79 GR M 11 HGH13 AD M<br />
12 PB92 GR M 12 HGH21 GR E<br />
13 WSB49 GR M 13 PB7 GR M<br />
14 PB12 GR M<br />
15 PB20 GR M<br />
16 PB25 GR D<br />
17 PB33 GR D<br />
18 PB37 GR M<br />
19 PB55 GR M<br />
20 PB60 GR D<br />
21 PB67 GR D<br />
22 PB72 GR M<br />
23 WSA13 GR E<br />
24 WSA17 GR M<br />
25 WSA25 GR M<br />
26 WSA35 GR M<br />
27 WSA40 GR M<br />
28 WSB9 GR M<br />
29 WSB14 GR M<br />
30 WSB22 GR M<br />
31 WSB27 GR M<br />
32 WSB35 GR M<br />
33 HGA1 AD E<br />
34 HGA14 AD M<br />
a<br />
AD=agriculture dry, GR=grassland, SS=Shrub/steppe (draft, and will be updated)<br />
b<br />
Turbine position: E=end-row, D=discontinuous/saddle, M=mid-row<br />
<strong>Stateline</strong> <strong>Monitoring</strong> <strong>Final</strong> <strong>Report</strong> 86<br />
December 2004
APPENDIX C-2 - List of Oregon and Washington turbines sampled during the WRRS<br />
protocol searches from January through December 2003.<br />
OREGON WRRS Search Plots WASHINGTON WRRS Search Plots<br />
Turbine Dominant Turbine Turbine Dominant Turbine<br />
Count ID Habitat a Position b Count ID Habitat Position<br />
1 BGB16 GR E 1 HGA5 AD M<br />
2 BGC17 GR M 2 HGA11 AD M<br />
3 HGJ7 AD M 3 HGA20 AD M<br />
4 HGJ14 AD M 4 HGB5 GR M<br />
5 HGJ28 GR/AD M 5 HGB13 GR M<br />
6 HGJ42 GR/AD D 6 HGC8 GR M<br />
7 HGK8 AD M 7 HGC15 GR E<br />
8 HGL1 GR/AD E 8 HGC23 GR M<br />
9 HGM3 GR M 9 HGD2 GR M<br />
10 HGM16 GR M 10 HGD5 GR M<br />
11 HGN9 GR E 11 HGE7 GR M<br />
12 PB82 GR M 12 HGF1 GR E<br />
13 PB96 GR M 13 HGG4 AD E<br />
14 HGS14 AD E 14 HGH2 SS M<br />
15 HGS19 AD M 15 HGH8 SS M<br />
16 HGS21 AD E 16 HGH15 SS E<br />
17 HGS25 AD M 17 HGJ1 AD E<br />
18 HGS40 AD E 18 PB4 GR D<br />
19 HGS48 AD M 19 PB13 GR M<br />
20 HGS56 AD E 20 PB19 GR M<br />
21 PB26 GR M<br />
22 PB37 GR M<br />
23 PB43 GR M<br />
24 PB52 GR M<br />
25 PB73 GR M<br />
26 WSA18 GR M<br />
27 WSA30 GR M<br />
28 WSA43 GR M<br />
29 WSB7 GR M<br />
30 WSB15 GR M<br />
31 WSB21 GR M<br />
32 WSB28 GR M<br />
33 WSB33 GR M<br />
34 WSB40 GR M<br />
a<br />
AD=agriculture dry, GR=grassland, SS=Shrub/steppe (draft, and will be updated)<br />
b<br />
Turbine position: E=end-row, D=discontinuous/saddle, M=mid-row<br />
<strong>Stateline</strong> <strong>Monitoring</strong> <strong>Final</strong> <strong>Report</strong> 87<br />
December 2004
APPENDIX D-1 - List of avian fatalities observed on standardized search plots in<br />
Oregon from January 2002 through December 2003.<br />
Date Species<br />
Nearest<br />
Turbine<br />
Distance to Nearest<br />
Turbine(m)<br />
FAA<br />
Lit<br />
01/22/2002 western meadowlark HGM2 58 N<br />
02/18/2002 horned lark PB87 51 Y<br />
02/21/2002 ring-necked pheasant HGJ35 68 N<br />
03/19/2002 horned lark HGN8 14 N<br />
04/07/2002 black-billed magpie BGC19 42 Y<br />
04/16/2002 horned lark PB81 29 N<br />
04/17/2002 horned lark WSB52 42 Y<br />
04/18/2002 horned lark BGB17 69 N<br />
04/19/2002 horned lark a HGN9 24 Y<br />
04/27/2002 horned lark HGN8 40 N<br />
05/03/2002 golden-crowned kinglet PB97 55 Y<br />
05/13/2002 horned lark HGL1 20 Y<br />
05/13/2002 horned lark HGM18 20 Y<br />
05/13/2002 horned lark HGM18 45 Y<br />
05/18/2002 yellow-rumped warbler WSB45 46 N<br />
05/19/2002 unidentified bird HGJ40 46 N<br />
05/21/2002 horned lark HGM2 26 N<br />
06/17/2002 ring-necked pheasant HGJ18 18 N<br />
06/17/2002 horned lark HGJ8 11 N<br />
06/19/2002 ring-necked pheasant HGM9 45 N<br />
07/21/2002 horned lark HGM17 17 N<br />
08/16/2002 ring-necked pheasant HGL2 50 N<br />
08/19/2002 grasshopper sparrow BGC18 25 N<br />
08/19/2002 house wren HGM8 20 N<br />
08/19/2002 chukar HGM9 43 N<br />
08/20/2002 horned lark WSB45 44 N<br />
09/01/2002 horned lark HGJ21 35 Y<br />
09/03/2002 horned lark BGB16 88 Y<br />
09/04/2002 mallard HGN9 27 Y<br />
09/15/2002 golden-crowned sparrow WSB47 42 N<br />
09/18/2002 white-crowned sparrow HGJ12 60 Y<br />
09/19/2002 unidentified sparrow BGB16 39 Y<br />
09/19/2002 white-crowned sparrow HGK9 39 Y<br />
10/02/2002 horned lark WSB46 53 Y<br />
10/02/2002 horned lark WSB48 25 N<br />
10/03/2002 golden-crowned kinglet BGB19 66 N<br />
10/03/2002 horned lark BGC17 22 N<br />
10/05/2002 ruby-crowned kinglet HGJ21 34 Y<br />
10/16/2002 horned lark HGJ7 40 N<br />
10/18/2002 gray partridge HGL2 48 N<br />
10/19/2002 MacGillivray's warbler WSB53 59 N<br />
10/21/2002 winter wren BGB23 51 Y<br />
10/21/2002 chukar HGM14 6 N<br />
11/04/2002 horned lark PB95 10 Y<br />
11/06/2002 European starling BGB23 18 Y<br />
01/03/2003 European starling a HGL3 8 N<br />
02/04/2003 ring-necked pheasant HGK5 43 N<br />
<strong>Stateline</strong> <strong>Monitoring</strong> <strong>Final</strong> <strong>Report</strong> 88<br />
December 2004
APPENDIX D-1 (continued).<br />
Date Species<br />
Nearest<br />
Turbine<br />
Distance to Nearest<br />
Turbine(m)<br />
FAA<br />
Lit<br />
02/05/2003 rock dove HGN5 61 Y<br />
02/07/2003 horned lark BGB19 62 N<br />
03/05/2003 horned lark BGC16 42 Y<br />
04/17/2003 horned lark WSB55 51 N<br />
04/20/2003 horned lark HGN5 12 Y<br />
04/20/2003 horned lark HGN7 17 N<br />
04/30/2003 unidentified passerine HGK4 64 Y<br />
05/05/2003 horned lark HGS37 33 N<br />
05/16/2003 American kestrel BGB19 34 N<br />
05/17/2003 red-breasted nuthatch HGS47 34 N<br />
05/18/2003 horned lark a HGS31 9 Y<br />
06/17/2003 horned lark PB78 10 Y<br />
06/17/2003 horned lark PB78 25 Y<br />
06/17/2003 ring-necked pheasant HGJ40 15 N<br />
06/17/2003 western meadowlark HGJ25 72 N<br />
06/18/2003 horned lark HGL6 25.5 Y<br />
06/18/2003 horned lark HGM8 61 N<br />
06/18/2003 horned lark WSB57 31 N<br />
06/20/2003 American kestrel BGB19 43 N<br />
06/20/2003 horned lark BGC16 31 Y<br />
06/23/2003 horned lark HGS27 28 N<br />
06/23/2003 horned lark HGS27 37 N<br />
06/23/2003 horned lark HGS35 12 Y<br />
07/16/2003 horned lark HGJ12 28 Y<br />
07/17/2003 American kestrel BGB19 63 N<br />
07/17/2003 American kestrel HGS59 21 N<br />
07/18/2003 ferruginous hawk HGM13 35 Y<br />
07/18/2003 horned lark HGS48 67 N<br />
07/18/2003 ring-necked pheasant HGM11 3 N<br />
08/13/2003 ring-necked pheasant HGJ10 6 N<br />
08/14/2003 horned lark HGK13 48 Y<br />
08/14/2003 ring-necked pheasant HGJ24 32 N<br />
08/14/2003 ring-necked pheasant HGJ37 53 N<br />
09/05/2003 unidentified bird HGJ18 17 N<br />
09/06/2003 horned lark HGK11 54 N<br />
09/07/2003 ring-necked pheasant HGM11 4 N<br />
09/09/2003 horned lark BGC16 27 Y<br />
09/09/2003 yellow-rumped warbler BGC16 54 Y<br />
09/17/2003 horned lark HGJ10 14 N<br />
09/18/2003 ring-necked pheasant HGJ23 1 N<br />
09/21/2003 yellow-rumped warbler HGS51 27 N<br />
09/24/2003 horned lark HGS29 51 N<br />
10/02/2003 golden-crowned kinglet HGS51 23 N<br />
10/02/2003 horned lark HGJ25 21 N<br />
10/02/2003 ring-necked pheasant HGJ23 7 N<br />
10/03/2003 golden-crowned kinglet BGC15 19 N<br />
10/03/2003 northern flicker BGB18 38.5 N<br />
<strong>Stateline</strong> <strong>Monitoring</strong> <strong>Final</strong> <strong>Report</strong> 89<br />
December 2004
APPENDIX D-1 (continued).<br />
Date Species<br />
Nearest<br />
Turbine<br />
Distance to Nearest<br />
Turbine(m)<br />
FAA<br />
Lit<br />
10/03/2003 savannah sparrow BGB22 64 N<br />
10/07/2003 golden-crowned kinglet HGS18 46 N<br />
10/07/2003 golden-crowned kinglet HGS27 36 N<br />
10/15/2003 golden-crowned kinglet HGJ11 38 N<br />
10/15/2003 golden-crowned kinglet HGJ10 36 N<br />
10/17/2003 horned lark PB91 54 Y<br />
10/20/2003 western meadowlark HGJ23 59 N<br />
10/21/2003 horned lark HGK12 30 N<br />
10/21/2003 red-tailed hawk HGL5 9 N<br />
10/23/2003 golden-crowned kinglet HGS18 51 N<br />
10/23/2003 winter wren HGS35 25 Y<br />
10/28/2003 gray partridge PB80 21 N<br />
10/30/2003 red-tailed hawk a HGJ13 35 N<br />
11/03/2003 golden-crowned kinglet BGC14 64 N<br />
11/03/2003 gray partridge HGK6 30 N<br />
11/03/2003 dark-eyed junco BGC17 66 N<br />
11/17/2003 western meadowlark HGJ25 45 N<br />
11/17/2003 gray partridge HGJ36 55 N<br />
11/19/2003 western meadowlark HGK13 26 Y<br />
11/19/2003 ring-necked pheasant HGK7 32 N<br />
11/23/2003 European starling HGN7 32 N<br />
11/25/2003 horned lark HGS12 22 N<br />
12/14/2003 chukar PB79 2 N<br />
12/17/2003 European starling HGS35 44 Y<br />
a found on a standardized search plot but not during scheduled search<br />
<strong>Stateline</strong> <strong>Monitoring</strong> <strong>Final</strong> <strong>Report</strong> 90<br />
December 2004
APPENDIX D-2 - List of avian fatalities observed standardized search plots in<br />
Washington from July 2001 through December 2003.<br />
Nearest Turbine Distance to Nearest FAA<br />
Date Species<br />
Turbine(m) LIT<br />
08/21/2001 horned lark PB30 39 Y<br />
10/01/2001 golden-crowned sparrow HGC24 56 N<br />
10/03/2001 horned lark PB50 25 N<br />
10/14/2001 golden-crowned kinglet HGC23 37 N<br />
10/15/2001 dark-eyed junco PB39 43 N<br />
11/14/2001 unidentified passerine HGB13 29 N<br />
11/14/2001 western meadowlark PB39 66 N<br />
11/14/2001 horned lark WSA22 17 Y<br />
12/11/2001 unidentified passerine PB16 53 Y<br />
12/12/2001 golden-crowned kinglet WSA44 30 N<br />
01/14/2002 gray partridge PB15 69 Y<br />
02/18/2002 western meadowlark HGD6 62 Y<br />
02/18/2002 horned lark a PB39 33 N<br />
02/21/2002 horned lark HGB13 23 N<br />
02/21/2002 horned lark HGB4 25 N<br />
03/13/2002 unidentified passerine HGG3 20 Y<br />
03/22/2002 horned lark HGB11 26 N<br />
04/01/2002 European starling HGA7 66 N<br />
04/01/2002 horned lark HGC14 32 Y<br />
04/01/2002 western meadowlark HGC14 66 Y<br />
04/01/2002 horned lark HGD4 38 N<br />
04/02/2002 horned lark PB29 15 N<br />
04/17/2002 gray partridge WSA43 39 N<br />
04/20/2002 winter wren HGD5 28 N<br />
05/01/2002 white-crowned sparrow PB17 64 N<br />
05/01/2002 horned lark PB28 32 N<br />
05/01/2002 house wren PB29 41 N<br />
05/01/2002 horned lark PB30 18 Y<br />
05/02/2002 horned lark HGC24 59 N<br />
05/02/2002 horned lark PB41 47 N<br />
05/03/2002 horned lark HGH16 17 Y<br />
05/05/2002 horned lark WSA19 35 N<br />
05/07/2002 horned lark WSB31 32 N<br />
06/06/2002 red-tailed hawk a HGH17 10 N<br />
06/15/2002 horned lark HGA22 6 N<br />
06/17/2002 yellow-rumped warbler HGH16 67 Y<br />
06/17/2002 horned lark HGH18 38 N<br />
06/20/2002 horned lark WSA21 24 N<br />
07/16/2002 horned lark PB76 58 N<br />
07/18/2002 horned lark WSB16 18 N<br />
08/12/2002 Swainson's hawk HGA9 27 N<br />
08/13/2002 great blue heron HGC25 57 Y<br />
08/13/2002 horned lark a WSA21 10 N<br />
08/19/2002 gray partridge HGB12 33 N<br />
08/31/2002 red-tailed hawk HGA20 70 N<br />
09/04/2002 American kestrel WSB16 24 N<br />
09/16/2002 red-tailed hawk HGA6 33 N<br />
<strong>Stateline</strong> <strong>Monitoring</strong> <strong>Final</strong> <strong>Report</strong> 91<br />
December 2004
APPENDIX D-2 (continued).<br />
Nearest Turbine Distance to Nearest FAA<br />
Date Species<br />
Turbine(m) LIT<br />
09/16/2002 Swainson's thrush HGA7 53 N<br />
10/01/2002 vesper sparrow PB30 51 Y<br />
10/01/2002 house finch WSA44 14 N<br />
10/02/2002 golden-crowned kinglet WSB29 29 Y<br />
10/03/2002 savannah sparrow PB41 31 N<br />
10/03/2002 vesper sparrow PB53 26 Y<br />
10/04/2002 red-tailed hawk HGA22 45 N<br />
10/04/2002 white-crowned sparrow HGA7 40 N<br />
10/04/2002 western meadowlark HGC14 50 Y<br />
10/07/2002 red-winged blackbird HGH16 25 Y<br />
10/16/2002 golden-crowned kinglet PB40 32 N<br />
10/16/2002 western meadowlark PB50 3 N<br />
10/20/2002 horned lark WSA19 17 N<br />
11/01/2002 horned lark HGC24 23 N<br />
02/02/2003 ring-necked pheasant HGG11 61 Y<br />
02/20/2003 ring-necked pheasant a HGJ3 2 N<br />
03/01/2003 horned lark PB35 55 N<br />
03/01/2003 ring-necked pheasant PB67 70 Y<br />
03/31/2003 golden-crowned kinglet HGE2 58 N<br />
03/31/2003 winter wren HGC21 53 N<br />
04/15/2003 horned lark WSA38 52 N<br />
04/15/2003 horned lark WSA39 18 N<br />
05/12/2003 horned lark WSA38 27 N<br />
06/16/2003 horned lark HGC32 54 Y<br />
07/15/2003 western meadowlark HGE2 1 N<br />
07/16/2003 horned lark WSA37 10 Y<br />
08/11/2003 chukar HGB7 3 N<br />
08/11/2003 western meadowlark HGA1 2 Y<br />
08/12/2003 horned lark HGC20 5 Y<br />
08/12/2003 unidentified bird PB67 73 Y<br />
08/13/2003 ring-necked pheasant b HGE4 67 N<br />
09/02/2003 chukar PB47 2 N<br />
09/03/2003 chukar HGC19 42 N<br />
09/04/2003 horned lark WSA16 63 N<br />
09/09/2003 house wren WSB10 58 N<br />
09/30/2003 chukar HGC17 0 N<br />
10/02/2003 golden-crowned kinglet WSB24 19 N<br />
10/13/2003 white-crowned sparrow PB11 55 N<br />
10/14/2003 dark-eyed junco HGC20 48 Y<br />
10/14/2003 golden-crowned kinglet HGJ4 53 N<br />
10/15/2003 golden-crowned kinglet HGH11 33 N<br />
10/27/2003 golden-crowned kinglet HGA1 31 Y<br />
10/28/2003 golden-crowned kinglet WSA40 21 N<br />
10/29/2003 American pipit HGC19 52 N<br />
11/17/2003 golden-crowned sparrow PB12 59 N<br />
a found on a standardized search plot but not during scheduled search<br />
b<br />
averaged coordinates for body parts used to determine closest turbine and distance<br />
<strong>Stateline</strong> <strong>Monitoring</strong> <strong>Final</strong> <strong>Report</strong> 92<br />
December 2004
APPENDIX D-3 - WRRS protocol and incidental avian fatality discoveries from July<br />
2001 through December 2003 that were not observed on standardized search<br />
plots.<br />
Date a<br />
Species<br />
Nearest<br />
Turbine<br />
Distance to<br />
Nearest<br />
Turbine(m)<br />
09/20/2001 white-throated swift WSB25 9<br />
12/09/2001 short-eared owl HGC20 103<br />
01/25/2002 Canada goose HGB6 51<br />
03/27/2002 horned lark PB44 2<br />
03/27/2002 horned lark PB44 4<br />
04/04/2002 gray partridge WSB38 22<br />
04/25/2002 white-crowned sparrow WSB34 65<br />
04/25/2002 white-crowned sparrow WSB26 44<br />
05/02/2002 red-tailed hawk b HGC9 30<br />
05/07/2002 horned lark WSA26 55<br />
07/11/2002 horned lark HGJ32 30<br />
10/04/2002 ring-necked pheasant HGE1 3<br />
10/06/2002 chukar HGC15 2<br />
10/20/2002 gray partridge WSB42 26<br />
10/22/2002 red-tailed hawk HGG11 18<br />
11/01/2002 European starling b PB37 0<br />
03/13/2003 horned lark HGM9 43<br />
04/01/2003 horned lark HGH8 26<br />
07/16/2003 horned lark WSB42 18<br />
07/16/2003 horned lark WSB17 25<br />
08/05/2003 red-tailed hawk PB89 19<br />
09/29/2003 golden-crowned kinglet PB29 19<br />
INJURED BIRDS<br />
04/26/2002 Swainson’s hawk (injured, HGK9 base of turbine<br />
fully recovered and released)<br />
a<br />
date that project biologist identified and collected the bird. Date discovered by FPL Energy<br />
personnel or contractor was sometimes earlier.<br />
b<br />
found on a WRRS protocol search plot during a protocol search<br />
<strong>Stateline</strong> <strong>Monitoring</strong> <strong>Final</strong> <strong>Report</strong> 93<br />
December 2004
APPENDIX E-1 - List of bat fatalities found on standardized search plots in Oregon from<br />
January 2002 through December 2003.<br />
Nearest Distance to FAA<br />
Date Species Turbine Nearest Turbine(m) LIT<br />
07/22/2002 silver-haired bat WSB52 19 Y<br />
08/19/2002 silver-haired bat BGC16 25 Y<br />
08/19/2002 silver-haired bat BGC18 28 N<br />
08/19/2002 hoary bat HGM4 27 N<br />
08/20/2002 silver-haired bat WSB46 27 Y<br />
09/04/2002 big brown bat HGM16 15 N<br />
09/06/2002 unidentified bat a HGK2 0, on blade Y<br />
09/20/2002 hoary bat WSB54 18 N<br />
09/24/2002 hoary bat PB88 10 N<br />
09/26/2002 silver-haired bat PB84 35 N<br />
09/26/2002 silver-haired bat PB97 10 Y<br />
10/02/2002 silver-haired bat BGB21 25 N<br />
10/03/2002 hoary bat BGB17 26 N<br />
10/03/2002 hoary bat BGC17 52 N<br />
10/03/2002 hoary bat BGC18 22 N<br />
10/05/2002 hoary bat HGJ14 16 N<br />
10/19/2002 silver-haired bat WSB53 7 N<br />
10/21/2002 silver-haired bat HGM9 28 N<br />
05/15/2003 silver-haired bat PB86 63 Y<br />
08/18/2003 hoary bat HGS37 29 N<br />
09/03/2003 hoary bat PB84 21 N<br />
09/03/2003 silver-haired bat PB86 17 Y<br />
09/04/2003 hoary bat HGJ12 20 Y<br />
09/04/2003 silver-haired bat PB93 23 N<br />
09/04/2003 silver-haired bat PB94 14 Y<br />
09/04/2003 silver-haired bat PB94 15 Y<br />
09/06/2003 silver-haired bat HGJ38 22 Y<br />
09/06/2003 silver-haired bat HGK5 38 N<br />
09/06/2003 unidentified bat HGK5 18 N<br />
09/07/2003 silver-haired bat HGL4 12 N<br />
09/07/2003 silver-haired bat HGL5 9 N<br />
09/07/2003 silver-haired bat HGM14 11 N<br />
09/07/2003 silver-haired bat HGM5 3 N<br />
09/09/2003 hoary bat BGC16 3 Y<br />
09/09/2003 hoary bat BGC17 23 N<br />
09/09/2003 silver-haired bat BGC13 9 Y<br />
09/10/2003 silver-haired bat HGS36 10 N<br />
09/17/2003 hoary bat PB85 32 N<br />
09/20/2003 hoary bat BGB19 19 N<br />
09/20/2003 hoary bat WSB50 3 N<br />
09/20/2003 silver-haired bat b BGB18 10 N<br />
09/23/2003 hoary bat HGS13 33 Y<br />
09/30/2003 silver-haired bat HGJ44 16 Y<br />
10/01/2003 hoary bat PB94 35 Y<br />
10/01/2003 silver-haired bat WSB55 23 N<br />
<strong>Stateline</strong> <strong>Monitoring</strong> <strong>Final</strong> <strong>Report</strong> 94<br />
December 2004
APPENDIX E-1 (continued).<br />
Nearest Distance to FAA<br />
Date Species Turbine Nearest Turbine(m) LIT<br />
10/03/2003 hoary bat HGJ32 12 N<br />
10/03/2003 hoary bat HGJ40 27 N<br />
10/03/2003 hoary bat HGK5 12 N<br />
10/03/2003 silver-haired bat BGB23 23 Y<br />
10/15/2003 silver-haired bat HGJ18 25 N<br />
10/16/2003 hoary bat WSB55 16 N<br />
10/16/2003 hoary bat WSB56 13 N<br />
10/16/2003 hoary bat WSB56 17 N<br />
11/19/2003 silver-haired bat WSB48 13 N<br />
a found on a standardized search plot but not during scheduled search<br />
b found alive but died later the same day, most likely from internal injuries<br />
<strong>Stateline</strong> <strong>Monitoring</strong> <strong>Final</strong> <strong>Report</strong> 95<br />
December 2004
APPENDIX E-2 - List of bat fatalities found on standardized search plots in Washington<br />
from July 2001 through December 2003.<br />
Nearest Distance to FAA<br />
Date Species Turbine Nearest Turbine(m) LIT<br />
08/18/2001 hoary bat HGC25 31 Y<br />
08/20/2001 hoary bat HGC11 9 N<br />
08/29/2001 hoary bat HGD4 15 N<br />
08/30/2001 hoary bat HGC14 19 Y<br />
08/30/2001 hoary bat HGC14 20 Y<br />
08/31/2001 hoary bat PB29 33 N<br />
08/31/2001 hoary bat PB30 32 Y<br />
08/31/2001 silver-haired bat PB30 29 Y<br />
08/31/2001 hoary bat PB41 12 N<br />
09/17/2001 little brown bat HGC10 11 Y<br />
09/18/2001 silver-haired bat PB15 32 Y<br />
09/18/2001 hoary bat PB18 6 N<br />
09/18/2001 hoary bat PB27 31 N<br />
09/18/2001 silver-haired bat PB30 20 Y<br />
09/20/2001 hoary bat PB42 33 N<br />
09/20/2001 silver-haired bat PB50 15 N<br />
09/20/2001 silver-haired bat WSA44 14 N<br />
09/27/2001 silver-haired bat a PB16 3 Y<br />
10/01/2001 silver-haired bat HGC14 12 Y<br />
10/01/2001 hoary bat HGC23 31 N<br />
10/02/2001 silver-haired bat PB28 26 N<br />
10/02/2001 silver-haired bat PB40 15 N<br />
10/03/2001 silver-haired bat WSA45 27 Y<br />
10/15/2001 silver-haired bat PB31 21 N<br />
11/15/2001 silver-haired bat WSB19 13 Y<br />
08/13/2002 big brown bat a,c WSA19 10 N<br />
08/30/2002 hoary bat HGD6 16 Y<br />
08/31/2002 hoary bat PB6 25 N<br />
09/01/2002 hoary bat PB53 16 Y<br />
09/04/2002 hoary bat WSB4 16 Y<br />
09/14/2002 silver-haired bat PB30 30 Y<br />
09/14/2002 silver-haired bat a PB53 4 Y<br />
09/15/2002 hoary bat b WSB16 20 N<br />
09/20/2002 silver-haired bat WSB7 5 N<br />
09/24/2002 silver-haired bat PB76 8 N<br />
10/22/2002 hoary bat HGB1 23 Y<br />
07/15/2003 hoary bat HGH12 9 N<br />
08/11/2003 hoary bat HGA14 17 Y<br />
08/11/2003 hoary bat HGC4 23 N<br />
09/02/2003 silver-haired bat HGA1 5 Y<br />
09/02/2003 silver-haired bat HGA2 3 N<br />
09/02/2003 hoary bat HGA1 3 Y<br />
09/02/2003 hoary bat HGA14 26 Y<br />
09/02/2003 hoary bat HGA15 10 N<br />
09/02/2003 hoary bat HGA16 46 N<br />
09/02/2003 hoary bat HGB8 3 N<br />
09/02/2003 hoary bat PB22 15 N<br />
<strong>Stateline</strong> <strong>Monitoring</strong> <strong>Final</strong> <strong>Report</strong> 96<br />
December 2004
APPENDIX E-2 (continued).<br />
Nearest Distance to FAA<br />
Date Species Turbine Nearest Turbine(m) LIT<br />
09/02/2003 silver-haired bat b HGA14 6 Y<br />
09/02/2003 silver-haired bat HGA15 1 N<br />
09/02/2003 silver-haired bat HGA15 23 N<br />
09/02/2003 silver-haired bat PB11 28 N<br />
09/02/2003 silver-haired bat PB23 16 N<br />
09/02/2003 silver-haired bat PB23 23 N<br />
09/02/2003 silver-haired bat PB45 3 N<br />
09/03/2003 silver-haired bat PB68 17 N<br />
09/04/2003 hoary bat HGH10 4 Y<br />
09/04/2003 silver-haired bat WSA14 31 N<br />
09/09/2003 silver-haired bat WSB25 21 N<br />
09/15/2003 hoary bat HGA16 27 N<br />
09/15/2003 hoary bat a HGC5 65 N<br />
09/16/2003 silver-haired bat HGC20 27 Y<br />
09/16/2003 silver-haired bat HGJ3 10 N<br />
09/19/2003 hoary bat WSB22 10 N<br />
09/19/2003 silver-haired bat WSB10 29 N<br />
09/29/2003 hoary bat HGA1 17 Y<br />
09/29/2003 silver-haired bat PB10 28 N<br />
09/29/2003 silver-haired bat PB24 11 Y<br />
09/29/2003 silver-haired bat PB68 2 N<br />
09/30/2003 hoary bat HGC30 30 N<br />
10/01/2003 hoary bat WSA15 20 N<br />
10/01/2003 silver-haired bat HGJ5 8 N<br />
10/13/2003 hoary bat PB11 16 N<br />
10/13/2003 silver-haired bat PB23 13 N<br />
10/14/2003 hoary bat PB46 32 N<br />
a<br />
found on a standardized search plot but not during scheduled search<br />
b<br />
found alive but euthanized due to extensive injuries<br />
c averaged coordinates for body parts used to determine closest turbine and distance<br />
<strong>Stateline</strong> <strong>Monitoring</strong> <strong>Final</strong> <strong>Report</strong> 97<br />
December 2004
APPENDIX E-3 - WRRS protocol and incidental bat fatality discoveries that were not<br />
observed on standardized search plots from July 2001 through December 2003.<br />
Date a<br />
Species<br />
Nearest<br />
Turbine<br />
Distance to<br />
Nearest<br />
Turbine(m)<br />
08/30/2001 unidentified bat HGC8 22<br />
08/30/2001 hoary bat HGC28 8<br />
09/25/2001 silver-haired bat PB47 29<br />
10/10/2001 silver-haired bat b HGC18 3<br />
10/10/2001 hoary bat HGC20 6<br />
05/26/2002 silver-haired bat WSB41 2<br />
07/11/2002 silver-haired bat HGC7 25<br />
08/06/2002 hoary bat WSB49 24<br />
08/30/2002 silver-haired bat WSA38 22<br />
09/11/2002 hoary bat BGC13 25<br />
09/14/2002 hoary bat WSB50 5<br />
09/14/2002 silver-haired bat WSB20 15<br />
09/14/2002 silver-haired bat PB59 10<br />
09/14/2002 silver-haired bat PB68 1<br />
09/14/2002 hoary bat PB6 5<br />
09/22/2002 hoary bat HGJ10 10<br />
10/2/2002 hoary bat b WSA40 4<br />
10/18/2002 hoary bat b PB33 26<br />
08/07/2003 hoary bat PB72 18<br />
08/14/2003 hoary bat BGB17 30<br />
09/30/2003 hoary bat WSB36 17<br />
10/01/2003 silver-haired bat WSB42 19<br />
a<br />
date that project biologist identified and collected the bird. Date discovered by FPL<br />
Energy personnel or contractor was sometimes earlier.<br />
b<br />
found on a WRRS protocol search plot during a protocol search<br />
<strong>Stateline</strong> <strong>Monitoring</strong> <strong>Final</strong> <strong>Report</strong> 98<br />
December 2004