Target Detection and Verification via Airborne ... - IEEE Xplore
Target Detection and Verification via Airborne ... - IEEE Xplore
Target Detection and Verification via Airborne ... - IEEE Xplore

Create successful ePaper yourself
Turn your PDF publications into a flip-book with our unique Google optimized e-Paper software.
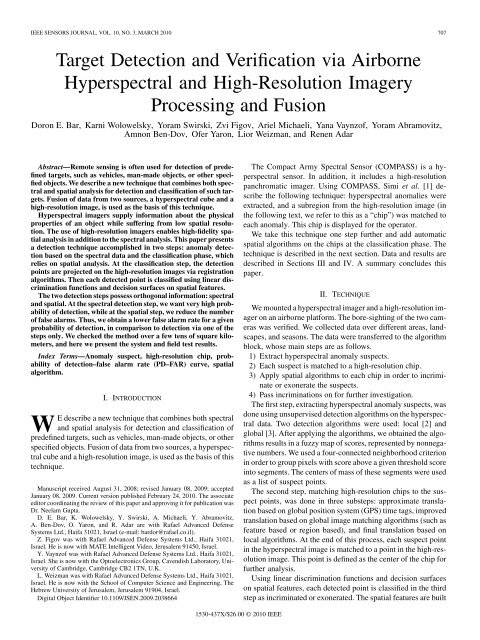
<strong>IEEE</strong> SENSORS JOURNAL, VOL. 10, NO. 3, MARCH 2010 707<br />
<strong>Target</strong> <strong>Detection</strong> <strong>and</strong> <strong>Verification</strong> <strong>via</strong> <strong>Airborne</strong><br />
Hyperspectral <strong>and</strong> High-Resolution Imagery<br />
Processing <strong>and</strong> Fusion<br />
Doron E. Bar, Karni Wolowelsky, Yoram Swirski, Zvi Figov, Ariel Michaeli, Yana Vaynzof, Yoram Abramovitz,<br />
Amnon Ben-Dov, Ofer Yaron, Lior Weizman, <strong>and</strong> Renen Adar<br />
Abstract—Remote sensing is often used for detection of predefined<br />
targets, such as vehicles, man-made objects, or other specified<br />
objects. We describe a new technique that combines both spectral<br />
<strong>and</strong> spatial analysis for detection <strong>and</strong> classification of such targets.<br />
Fusion of data from two sources, a hyperspectral cube <strong>and</strong> a<br />
high-resolution image, is used as the basis of this technique.<br />
Hyperspectral imagers supply information about the physical<br />
properties of an object while suffering from low spatial resolution.<br />
The use of high-resolution imagers enables high-fidelity spatial<br />
analysis in addition to the spectral analysis. This paper presents<br />
a detection technique accomplished in two steps: anomaly detection<br />
based on the spectral data <strong>and</strong> the classification phase, which<br />
relies on spatial analysis. At the classification step, the detection<br />
points are projected on the high-resolution images <strong>via</strong> registration<br />
algorithms. Then each detected point is classified using linear discrimination<br />
functions <strong>and</strong> decision surfaces on spatial features.<br />
The two detection steps possess orthogonal information: spectral<br />
<strong>and</strong> spatial. At the spectral detection step, we want very high probability<br />
of detection, while at the spatial step, we reduce the number<br />
of false alarms. Thus, we obtain a lower false alarm rate for a given<br />
probability of detection, in comparison to detection <strong>via</strong> one of the<br />
steps only. We checked the method over a few tens of square kilometers,<br />
<strong>and</strong> here we present the system <strong>and</strong> field test results.<br />
Index Terms—Anomaly suspect, high-resolution chip, probability<br />
of detection–false alarm rate (PD–FAR) curve, spatial<br />
algorithm.<br />
I. INTRODUCTION<br />
WE describe a new technique that combines both spectral<br />
<strong>and</strong> spatial analysis for detection <strong>and</strong> classification of<br />
predefined targets, such as vehicles, man-made objects, or other<br />
specified objects. Fusion of data from two sources, a hyperspectral<br />
cube <strong>and</strong> a high-resolution image, is used as the basis of this<br />
technique.<br />
Manuscript received August 31, 2008; revised January 08, 2009; accepted<br />
January 08, 2009. Current version published February 24, 2010. The associate<br />
editor coordinating the review of this paper <strong>and</strong> approving it for publication was<br />
Dr. Neelam Gupta.<br />
D. E. Bar, K. Wolowelsky, Y. Swirski, A. Michaeli, Y. Abramovitz,<br />
A. Ben-Dov, O. Yaron, <strong>and</strong> R. Adar are with Rafael Advanced Defense<br />
Systems Ltd., Haifa 31021, Israel (e-mail: bardor@rafael.co.il).<br />
Z. Figov was with Rafael Advanced Defense Systems Ltd., Haifa 31021,<br />
Israel. He is now with MATE Intelligent Video, Jerusalem 91450, Israel.<br />
Y. Vaynzof was with Rafael Advanced Defense Systems Ltd., Haifa 31021,<br />
Israel. She is now with the Optoelectronics Group, Cavendish Laboratory, University<br />
of Cambridge, Cambridge CB2 1TN, U.K.<br />
L. Weizman was with Rafael Advanced Defense Systems Ltd., Haifa 31021,<br />
Israel. He is now with the School of Computer Science <strong>and</strong> Engineering, The<br />
Hebrew University of Jerusalem, Jerusalem 91904, Israel.<br />
Digital Object Identifier 10.1109/JSEN.2009.2038664<br />
The Compact Army Spectral Sensor (COMPASS) is a hyperspectral<br />
sensor. In addition, it includes a high-resolution<br />
panchromatic imager. Using COMPASS, Simi et al. [1] describe<br />
the following technique: hyperspectral anomalies were<br />
extracted, <strong>and</strong> a subregion from the high-resolution image (in<br />
the following text, we refer to this as a “chip”) was matched to<br />
each anomaly. This chip is displayed for the operator.<br />
We take this technique one step further <strong>and</strong> add automatic<br />
spatial algorithms on the chips at the classification phase. The<br />
technique is described in the next section. Data <strong>and</strong> results are<br />
described in Sections III <strong>and</strong> IV. A summary concludes this<br />
paper.<br />
II. TECHNIQUE<br />
We mounted a hyperspectral imager <strong>and</strong> a high-resolution imager<br />
on an airborne platform. The bore-sighting of the two cameras<br />
was verified. We collected data over different areas, l<strong>and</strong>scapes,<br />
<strong>and</strong> seasons. The data were transferred to the algorithm<br />
block, whose main steps are as follows.<br />
1) Extract hyperspectral anomaly suspects.<br />
2) Each suspect is matched to a high-resolution chip.<br />
3) Apply spatial algorithms to each chip in order to incriminate<br />
or exonerate the suspects.<br />
4) Pass incriminations on for further investigation.<br />
The first step, extracting hyperspectral anomaly suspects, was<br />
done using unsupervised detection algorithms on the hyperspectral<br />
data. Two detection algorithms were used: local [2] <strong>and</strong><br />
global [3]. After applying the algorithms, we obtained the algorithms<br />
results in a fuzzy map of scores, represented by nonnegative<br />
numbers. We used a four-connected neighborhood criterion<br />
in order to group pixels with score above a given threshold score<br />
into segments. The centers of mass of these segments were used<br />
as a list of suspect points.<br />
The second step, matching high-resolution chips to the suspect<br />
points, was done in three substeps: approximate translation<br />
based on global position system (GPS) time tags, improved<br />
translation based on global image matching algorithms (such as<br />
feature based or region based), <strong>and</strong> final translation based on<br />
local algorithms. At the end of this process, each suspect point<br />
in the hyperspectral image is matched to a point in the high-resolution<br />
image. This point is defined as the center of the chip for<br />
further analysis.<br />
Using linear discrimination functions <strong>and</strong> decision surfaces<br />
on spatial features, each detected point is classified in the third<br />
step as incriminated or exonerated. The spatial features are built<br />
1530-437X/$26.00 © 2010 <strong>IEEE</strong>
708 <strong>IEEE</strong> SENSORS JOURNAL, VOL. 10, NO. 3, MARCH 2010<br />
Fig. 1. Hyperspectral image with anomaly suspects <strong>and</strong> the matched chips.<br />
Fig. 2. High-resolution image with chips that were incriminated (bold square)<br />
<strong>and</strong> were exonerated (square) are plotted. For chips A–D, see detailed explanation<br />
in the text.<br />
in three substeps: extract line segments <strong>and</strong> shadow segments,<br />
build vehicle hypotheses from lines, then to each hypothesis<br />
match a shadow segment [4]. Each hypothesis is assigned a nonnegative<br />
score. The shadow segments are used as support for the<br />
vehicle hypotheses. Thus, when partial shadow is presented the<br />
third substep is omitted.<br />
We used MATLAB <strong>and</strong> ENVI/IDL software to implement the<br />
algorithms.<br />
To demonstrate the technique, we plot an example in Figs. 1<br />
<strong>and</strong> 2. At the center of Fig. 1, the b<strong>and</strong> with 700-nm wavelength<br />
from the hyperspectral cube is plotted. White patches represent<br />
pixels that got a score higher than a given threshold. To each<br />
segment of such pixels, a high-resolution chip is matched. Those<br />
chips are seen around the spectral image.<br />
In Fig. 2, a high-resolution image with chips that were incriminated<br />
by the spatial analysis (bold square) <strong>and</strong> were exonerated<br />
(thin square) are plotted. For three chips, vehicle hypotheses<br />
<strong>and</strong> shadow segments are plotted. Since no shadow segment was<br />
matched to the vehicle hypothesis in chip A, this chip was exonerated.<br />
In chip D, no vehicle was found, though there was a<br />
car in the hyperspectral image. This is due to the fact that the<br />
car was on the move <strong>and</strong> there is slight time difference between<br />
capturing a scene by the two imagers.<br />
III. DATA<br />
Two cameras were used to demonstrate this technique.<br />
• A hyperspectral ASIA camera of SPECIM company. The<br />
camera operates at the visual near-IR range with dispersive<br />
system based on a prism-grating-prism component.<br />
The data are collected <strong>via</strong> the pushbroom technique. Instantaneous<br />
field of view (IFOV) 1 mrad.<br />
• A high-resolution camera with 11 mega pixels, red-greenblue<br />
(RGB) Redlake camera. IFOV 0.1 mrad.<br />
The optics were chosen so that the RGB resolution would be<br />
ten times higher than the resolution of the hyperspectral image.<br />
The image capture rate was chosen, depending on flight speed,<br />
to ensure a slight overlap between images.<br />
We mounted the imagers on a light aircraft. Inertial navigation<br />
system <strong>and</strong> GPS systems were mounted on the platform <strong>and</strong><br />
recorded for the duration of the flight.<br />
Preprocessing of the data was performed for each algorithm<br />
block.<br />
• For the hyperspectral stage: calibration of hyperspectral<br />
raw data, <strong>and</strong> coregistration of hyperspectral b<strong>and</strong>s [5].<br />
• For the matching stage: Georectification of the hyperspectral<br />
data <strong>and</strong> RGB image enhancement <strong>and</strong> cropping.<br />
• For the spatial stage: conversion of RGB chips to gray-level<br />
chips.<br />
We collected data at three different times of year: summer,<br />
spring, <strong>and</strong> winter. The cloud cover was 0/8, 4/8, <strong>and</strong> 7/8, respectively,<br />
with some rain during the winter data collection.<br />
The l<strong>and</strong>scape included open fields, forests, <strong>and</strong> various types<br />
of roads <strong>and</strong> buildings.<br />
IV. RESULTS<br />
A. Comparing the Parts to the Whole<br />
Operations research was done at each algorithm step by<br />
marking the targets on the images—hyperspectral <strong>and</strong> high<br />
resolution—<strong>and</strong> calculating the probability of detection (PD)<br />
<strong>and</strong> false alarm rate (FAR).<br />
Calculations of PD–FAR graphs are different for each algorithm<br />
block.<br />
At the hyperspectral algorithm step, one obtains a score map.<br />
This map is cut at a threshold to give a list of pixels above the<br />
threshold. We used a connection criterion in order to generate<br />
segments for those pixels. For each segment, its center of mass<br />
is considered as the location of the suspect. Thus, we count suspects<br />
that fall inside a marked target as hits <strong>and</strong> the others<br />
as false . We repeat the process for different thresholds<br />
to obtain a PD–FAR graph for this algorithm step. A PD–FAR<br />
curve, is calculated from these data based on the total number<br />
of targets in the area considered <strong>and</strong> its area<br />
At the spatial algorithm step, we looked at the hypotheses’<br />
scores. Thus, each chip gets the highest score of the hypotheses<br />
that appear inside it, or zero score if there is no hypothesis. A<br />
chip is considered as a hit if its score is above the threshold <strong>and</strong><br />
there are marked targets inside it.<br />
To check a spatial-only algorithm, we divided the high-resolution<br />
images to chips <strong>and</strong> performed the aforementioned check<br />
(1)
BAR et al.: TARGET DETECTION AND VERIFICATION VIA AIRBORNE HYPERSPECTRAL AND HIGH-RESOLUTION IMAGERY PROCESSING AND FUSION 709<br />
Fig. 3. Results—comparing the parts to the whole. PD–FAR curves are plotted<br />
for the hyperspectral-only algorithm step (line-dot), for the spatial-only algorithm<br />
step (lined) <strong>and</strong> for the combined step system (bold line). This analysis<br />
was preformed over 2.94 km with 11 marked targets.<br />
Fig. 4. Comparison of two flight altitudes.<br />
for all chips. For the combined algorithm, we checked the chips<br />
that had been extracted by the matching step.<br />
Each target, in the area checked, is assigned the score of the<br />
chip, which it is in, or zero if it is not included in any chip. If a<br />
target is inside multiple chips, it is assigned the highest score of<br />
those chips. All chips with no targets in them are considered as<br />
false alarms. Thus, for a given score , we count the number of<br />
targets detected <strong>and</strong> the number of false alarms .<br />
Define <strong>and</strong> as the number of targets hit <strong>and</strong> the<br />
number of false alarms, respectively, with a score higher than<br />
the given score<br />
(2)<br />
A PD–FAR curve is calculated, see (1).<br />
We present a comparison between the algorithms on an area<br />
of 2.94 km with 11 marked targets. In Fig. 3, the results for<br />
the hyperspectral-only algorithm step, for the spatial-only algorithm<br />
step, <strong>and</strong> for the combined steps are presented. Inspection<br />
of the results shows that the number of false alarms is reduced<br />
by an order of magnitude as a result of combining the two algorithms.<br />
At 80% PD, the false alarm incidences are 14, 13, <strong>and</strong><br />
1.1 for the three algorithms, respectively. At 90% PD, the false<br />
alarm incidences are 28, 24, <strong>and</strong> 2.5, respectively.<br />
B. Resolution Compression<br />
To check the dependency of the algorithms on ground resolution,<br />
we compare two flight lines at two different altitudes:<br />
4000 <strong>and</strong> 6000 ft above ground level. These altitudes produce<br />
ground resolutions of the hyperspectral image of 1.0 1.0 <strong>and</strong><br />
1.5 1.5 m to pixel, respectively. A comparison of the results<br />
at these two altitudes is seen in Fig. 4.<br />
There is a reduction in the PD for a given FAR at the higher<br />
altitude flight line. This is due to the loss of spatial information<br />
in the high-resolution images.<br />
(3)<br />
Fig. 5. Combined results over several databases.<br />
C. Combined Results Over Several Databases<br />
We checked the whole algorithm on the combination of three<br />
databases totaling 55 km , 270 targets, different cloud conditions/weather<br />
<strong>and</strong> different l<strong>and</strong>scapes. The results overall are<br />
shown in Fig. 5. The ground resolutions were in the range of<br />
1.0 1.0 to 1.5 1.5 m /pixel. A global threshold was chosen<br />
for the hyperspectral algorithm step.<br />
Both winter <strong>and</strong> summer experiments showed similar results<br />
of 3 false alarms per square kilometer with 80% detection. In<br />
the spring experiment, we saw a reduction in the detection, 62%<br />
detection for 3 false alarms per square kilometer. This may be<br />
due to the scattered cloud cover during this experiment.<br />
Although that the three databases are very different from each<br />
other. The individual PD–FAR curves,<br />
(where<br />
is the set of databases), are similar for the different databases.<br />
Therefore, it was justified to combine those curves, to get a<br />
global PD–FAR curve<br />
(4)
710 <strong>IEEE</strong> SENSORS JOURNAL, VOL. 10, NO. 3, MARCH 2010<br />
For the databases we checked, one may expect 2.5 false<br />
alarms per square kilometer with 70% detection or 4 false<br />
alarms per square kilometer with 80% detection.<br />
V. SUMMARY<br />
A system—composed of airborne sensors <strong>and</strong> various automatic<br />
algorithms—was presented. We present results that compared<br />
the system to its parts. The results show a reduction by<br />
an order of magnitude of the number of false alarms for a given<br />
PD. Thus, the fusion of spectral <strong>and</strong> spatial algorithms is better<br />
than the sum of the parts.<br />
A reduction in the PD was observed at higher altitude. This<br />
is due to the loss of spatial information in the high-resolution<br />
images.<br />
The results of the combined algorithms are similar when the<br />
cloud cover is 0/8 or 8/8. However, when one has scattered cloud<br />
cover—such as 4/8—a reduction in the PD is observed <strong>and</strong> further<br />
investigations should be made.<br />
Reduction of false alarm rate needs further investigation. Due<br />
to the algorithmic process, the false alarms detected were rectangular.<br />
Thus, improving spatial algorithms might not improve<br />
results significantly. However, improving unsupervised algorithms<br />
on the hyperspectral data might reduce false alarms due<br />
to better underst<strong>and</strong>ing of the background model [6].<br />
We checked the system over different l<strong>and</strong>scapes—open<br />
fields, forests, roads, buildings—<strong>and</strong> in different illumination<br />
<strong>and</strong> weather conditions—seasons, sun angles, <strong>and</strong> cloud coverage.<br />
The results showed that the algorithms are robust.<br />
ACKNOWLEDGMENT<br />
The authors would like to thank the members of the Image<br />
Processing Group at Rafael Advanced Defense Systems, Ltd.,<br />
for various algorithms used in this research, <strong>and</strong> all the people<br />
who helped in preparing <strong>and</strong> carrying out the experiments <strong>and</strong><br />
data collection. They would also like to thank A. Kershenbaum<br />
for his helpful comments.<br />
REFERENCES<br />
[1] C. G. Simi, E. M. Winter, M. J. Schlangen, <strong>and</strong> A. B. Hill, S. S. Shen<br />
<strong>and</strong> M. R. Descour, Eds., “On-board processing for the COMPASS,<br />
algorithms for multispectral, hyperspectral, <strong>and</strong> ultraspectral imagery<br />
VII,” Proc. SPIE, vol. 4381, pp. 137–142, 2001.<br />
[2] I. R. Reed <strong>and</strong> X. Yu, “Adaptive multiple-b<strong>and</strong> CFAR detection of<br />
an optical pattern with unknown spectral distribution,” <strong>IEEE</strong> Trans.<br />
Acoust., Speech Signal Process., vol. 38, no. 10, pp. 1760–1770, Oct.<br />
1990.<br />
[3] O. Kuybeda, D. Malah, <strong>and</strong> M. Barzohar, “Rank estimation <strong>and</strong> redundancy<br />
reduction of high-dimensional noisy signals with preservation<br />
of rate vectors,” <strong>IEEE</strong> Trans. Signal Process., vol. 55, no. 12, pp.<br />
5579–5592, Dec. 2007.<br />
[4] Z. W. Kim <strong>and</strong> R. Nevatia, “Uncertain reasoning <strong>and</strong> learning for<br />
feature grouping,” Comput. Vis. Image Underst<strong>and</strong>ing, vol. 76, pp.<br />
278–288, 1999.<br />
[5] Z. Figov, K. Wolowelsky, <strong>and</strong> N. Goldberg, L. Bruzzone, Ed., “Co-registration<br />
of hyperspectral b<strong>and</strong>s,” Image Signal Process. Remote Sens.<br />
XIII. Proc. SPIE, vol. 6748, pp. 67480s-1–67480s-12, 2007.<br />
[6] L. Boker, S. R. Rotman, <strong>and</strong> D. G. Blumberg, “Coping with mixtures<br />
of backgrounds in a sliding window anomaly detection algorithm,” in<br />
Proc. SPIE, Electro-Opt. Infrared Syst.: Technol. Appl. V, 2008, vol.<br />
7113, pp. 711315-1–711315-12.<br />
Doron E. Bar was born in 1962. He received the<br />
Ph.D. degree in applied mathematics from the Technion,<br />
Haifa, Israel, in 1996.<br />
Since 1999, he has been with Rafael Advanced<br />
Defense Systems Ltd., Haifa, Israel, as an Image<br />
Processing Engineer. His current research interests<br />
include computer visions, image processing, <strong>and</strong><br />
remote sensing tasks.<br />
Karni Wolowelsky, photograph <strong>and</strong> biography not available at the time of<br />
publication.<br />
Yoram Swirski was born in Jerusalem, Israel,<br />
in 1955. He received the B.Sc. degree in physics<br />
from Tel-Aviv University, Tel-Aviv, Israel, in 1976,<br />
the M.Sc. degree (cum laude) in applied physics<br />
<strong>and</strong> electrooptics from The Hebrew University of<br />
Jerusalem, Israel, in 1978, <strong>and</strong> the Ph.D. degree in<br />
physics from the Technion, Haifa, Israel, 1992.<br />
Since 1979, he has been with Rafael Advanced Defense<br />
Systems Ltd., Haifa, where he is currently engaged<br />
in research on IR radiometry, image generation<br />
<strong>and</strong> simulation, <strong>and</strong> computer vision.<br />
Zvi Figov studied computer science <strong>and</strong> mathematics<br />
at Bar-Ilan University, Ramat-Gan, Israel. He<br />
received the B.Sc. degree, in 1999, <strong>and</strong> the M.Sc.<br />
degree with specialization in neuroscience, in 2002,<br />
from Bar-Ilan University.<br />
From 2001 to 2008, he was with Rafael Advanced<br />
Defense Systems Ltd. (formerly Rafael Armament<br />
Development Authority), Israel, where he was<br />
engaged in research on image processing <strong>and</strong> remote<br />
sensing. He is currently with the MATE Intelligent<br />
Video, Jerusalem, Israel, where he is engaged in<br />
research on developing video analytics, computer vision, real-time analytics,<br />
<strong>and</strong> remote sensing.<br />
Ariel Michaeli, photograph <strong>and</strong> biography not available at the time of<br />
publication.<br />
Yana Vaynzof was born in Tashkent, Uzbekistan, on<br />
December 2 1981 <strong>and</strong> immigrated to Israel in 1991.<br />
She received the B.Sc degree (summa cum laude) in<br />
electrical engineering from the Technion-Israel Institute<br />
of Technology, Haifa, Israel, in 2006, <strong>and</strong> the<br />
M.Sc. degree in electrical engineering from Princeton<br />
University, Princeton, NJ, in 2008. She is currently<br />
working towards the Ph.D. degree in physics at the<br />
Optoelectronics Group, Cavendish Laboratory, University<br />
of Cambridge, Cambridge, U.K.<br />
During her undergraduate studies, she worked<br />
part-time as a Student Engineer in Rafael Advanced Defense Systems Ltd.,<br />
Haifa, in the Image-Processing Group of the Missile Division. During<br />
2000–2002, she was with the Israeli Defense Forces as an Instructor in the<br />
Flight Academy. Her current research interests include development of hybrid<br />
polymer solar cells <strong>and</strong> the improvement of their efficiency <strong>and</strong> stability.<br />
Miss Vaynzof was the recipient of a number of fellowships <strong>and</strong> awards, including<br />
the Pinzi Award for Academic Excellence (2004), Knesset (Israeli Parliament)<br />
Award for contribution to the Israeli Society (2005), Gordon Y. Wu<br />
Fellowship (2006–2008), <strong>and</strong> the Cavendish Laboratories Award (2008).
BAR et al.: TARGET DETECTION AND VERIFICATION VIA AIRBORNE HYPERSPECTRAL AND HIGH-RESOLUTION IMAGERY PROCESSING AND FUSION 711<br />
Yoram Abramovitz was born in Affula, Israel, in<br />
1962. He received the B.Sc. <strong>and</strong> M.Sc. degrees in<br />
physics from the Technion, Haifa, Israel, in 1994.<br />
Since 2000, he has been with Rafael Advanced Defense<br />
systems Ltd., Haifa, where he is currently engaged<br />
in research on remote sensing R&D of electrooptical<br />
systems <strong>and</strong> radiometric measurements.<br />
Lior Weizman received the B.Sc. (with distinction)<br />
<strong>and</strong> M.Sc. degrees in electrical engineering from<br />
Ben-Gurion University of the Negev, Beer-Sheva,<br />
Israel, in 2002 <strong>and</strong> 2004, respectively. He is currently<br />
working towards the Ph.D. degree at the School of<br />
Computer Science <strong>and</strong> Engineering, The Hebrew<br />
University of Jerusalem, Israel.<br />
From 2005 to 2008, he was with Rafael Advanced<br />
Defense Systems Ltd., Haifa. His current research interests<br />
include image processing, pattern recognition,<br />
<strong>and</strong> statistical signal processing.<br />
Amnon Ben-Dov was born in 1955. Since 1981, he has been an Electronics<br />
Practical Engineer at the Physics Development Laboratories, Rafael Advanced<br />
Defense Systems Ltd., Haifa, Israel.<br />
Ofer Yaron was born in 1965. He received the B.Sc. degree in physics from the<br />
Technion, Haifa, Israel, in 1992, <strong>and</strong> the M.Sc. degree in physics from Tel-Aviv<br />
University, Tel-Aviv, Israel, in 1998.<br />
Since 1992, he has been with Rafael Advanced Defense Systems Ltd., Haifa,<br />
where he is currently engaged in research on remote sensing, image generation,<br />
<strong>and</strong> simulation.<br />
Renen Adar was born in Afula, Israel, in 1955. He<br />
received the B.Sc. <strong>and</strong> M.Sc. (cum laude) degrees<br />
in physics <strong>and</strong> mathematics from The Hebrew<br />
University of Jerusalem, Israel, <strong>and</strong> the D.Sc. degree<br />
in microelectronics from the Department of<br />
Electrical Engineering, Technion-Israel Institute of<br />
Technology, Haifa, Israel.<br />
From 1989 to 1993, he was a Member of Technical<br />
Staff with the Passive Optical Component Research,<br />
AT&T Bell Laboratories, Murray Hill, NJ. Since<br />
1994, he has been with Rafael Advanced Defense<br />
Systems Ltd., Haifa, where he is currently engaged in research on algorithm<br />
development activities related to machine vision <strong>and</strong> image recognition tasks.