"Monte Carlo Estimates of the Log Determinant of ... - Spatial Statistics
"Monte Carlo Estimates of the Log Determinant of ... - Spatial Statistics
"Monte Carlo Estimates of the Log Determinant of ... - Spatial Statistics

You also want an ePaper? Increase the reach of your titles
YUMPU automatically turns print PDFs into web optimized ePapers that Google loves.
48 R.P. Barry, R.K. Pace / Linear Algebra and its Applications 289 (1999) 41±54<br />
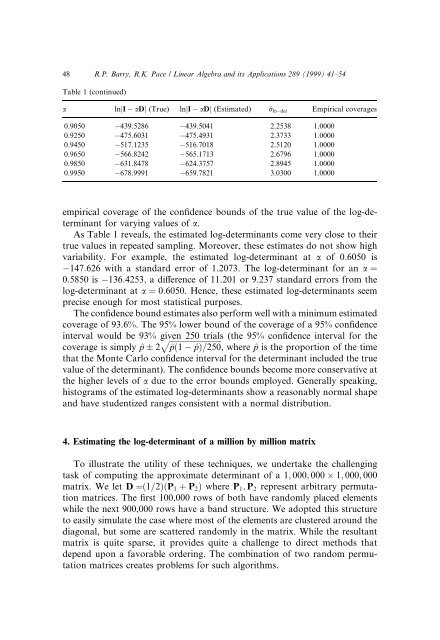
Table 1 (continued)<br />
a lnjI aDj (True) lnjI aDj (Estimated) ^r lndet Empirical coverages<br />
0.9050 439.5286 439.5041 2.2538 1.0000<br />
0.9250 475.6031 475.4931 2.3733 1.0000<br />
0.9450 517.1235 516.7018 2.5120 1.0000<br />
0.9650 566.8242 565.1713 2.6796 1.0000<br />
0.9850 631.8478 624.3757 2.8945 1.0000<br />
0.9950 678.9991 659.7821 3.0300 1.0000<br />
empirical coverage <strong>of</strong> <strong>the</strong> con®dence bounds <strong>of</strong> <strong>the</strong> true value <strong>of</strong> <strong>the</strong> log-determinant<br />
for varying values <strong>of</strong> a.<br />
As Table 1 reveals, <strong>the</strong> estimated log-determinants come very close to <strong>the</strong>ir<br />
true values in repeated sampling. Moreover, <strong>the</strong>se estimates do not show high<br />
variability. For example, <strong>the</strong> estimated log-determinant at a <strong>of</strong> 0.6050 is<br />
147:626 with a standard error <strong>of</strong> 1.2073. The log-determinant for an a ˆ<br />
0:5850 is 136:4253; a di€erence <strong>of</strong> 11.201 or 9.237 standard errors from <strong>the</strong><br />
log-determinant at a ˆ 0:6050. Hence, <strong>the</strong>se estimated log-determinants seem<br />
precise enough for most statistical purposes.<br />
The con®dence bound estimates also perform well with a minimum estimated<br />
coverage <strong>of</strong> 93.6%. The 95% lower bound <strong>of</strong> <strong>the</strong> coverage <strong>of</strong> a 95% con®dence<br />
interval would be 93% pgiven 250 trials (<strong>the</strong> 95% con®dence interval for <strong>the</strong><br />
coverage is simply ^p 2 ^p…1 ^p†=250, where ^p is <strong>the</strong> proportion <strong>of</strong> <strong>the</strong> time<br />
that <strong>the</strong> <strong>Monte</strong> <strong>Carlo</strong> con®dence interval for <strong>the</strong> determinant included <strong>the</strong> true<br />
value <strong>of</strong> <strong>the</strong> determinant). The con®dence bounds become more conservative at<br />
<strong>the</strong> higher levels <strong>of</strong> a due to <strong>the</strong> error bounds employed. Generally speaking,<br />
histograms <strong>of</strong> <strong>the</strong> estimated log-determinants show a reasonably normal shape<br />
and have studentized ranges consistent with a normal distribution.<br />
4. Estimating <strong>the</strong> log-determinant <strong>of</strong> a million by million matrix<br />
To illustrate <strong>the</strong> utility <strong>of</strong> <strong>the</strong>se techniques, we undertake <strong>the</strong> challenging<br />
task <strong>of</strong> computing <strong>the</strong> approximate determinant <strong>of</strong> a 1; 000; 000 1; 000; 000<br />
matrix. We let D ˆ…1=2†…P 1 ‡ P 2 † where P 1 ; P 2 represent arbitrary permutation<br />
matrices. The ®rst 100,000 rows <strong>of</strong> both have randomly placed elements<br />
while <strong>the</strong> next 900,000 rows have a band structure. We adopted this structure<br />
to easily simulate <strong>the</strong> case where most <strong>of</strong> <strong>the</strong> elements are clustered around <strong>the</strong><br />
diagonal, but some are scattered randomly in <strong>the</strong> matrix. While <strong>the</strong> resultant<br />
matrix is quite sparse, it provides quite a challenge to direct methods that<br />
depend upon a favorable ordering. The combination <strong>of</strong> two random permutation<br />
matrices creates problems for such algorithms.