Improved Real-Time Quality Control of NDBC Measurements.
Improved Real-Time Quality Control of NDBC Measurements.
Improved Real-Time Quality Control of NDBC Measurements.

You also want an ePaper? Increase the reach of your titles
YUMPU automatically turns print PDFs into web optimized ePapers that Google loves.
7.12 IMPROVED REAL-TIME QUALITY CONTROL OF <strong>NDBC</strong> MEASUREMENTS<br />
David B. Gihousen*<br />
National Data Buoy Center, Stennis Space Center, MS 39529-6000<br />
1. INTRODUCTION Although these checks have done a poorer job <strong>of</strong><br />
detecting errors due to sensor degradation, the modified<br />
Data quality control is not the most interesting or algorithms are expected to perform much better.<br />
popular topic at an American Meteorological Society Furthermore, <strong>NDBC</strong> supplements the real-time checks<br />
conference. That is probably why the session is always with an extensive, after-the-fact validation effort at <strong>NDBC</strong>.<br />
relegated to a Friday morning! Nevertheless, most This effort at <strong>NDBC</strong> is a “manual-machine” mix that<br />
operational meteorologists can recall times when an involves a different set <strong>of</strong> algorithms and a review <strong>of</strong><br />
embarrassingly bad observation was transmitted from an computer graphics. It is typically accomplished within 24<br />
automatic weather station to the public. More serious are hours <strong>of</strong> observation time. When degraded data are<br />
erroneous, but apparently reasonable observations that detected, the analysts update a control file that instructs<br />
might lead to an incorrect operational decision. So, in that the real-time processing not to encode measurements<br />
context, preventing these “mishaps” becomes very from the <strong>of</strong>fending sensor. <strong>NDBC</strong> is introducing many<br />
important.<br />
improvements to the process, which will be documented in<br />
The National Data Buoy Center (<strong>NDBC</strong>) has an a future paper.<br />
extensive program to reduce greatly the chances<br />
<strong>of</strong> transmitting degraded measurements. These 3. EXISTING DATA VALIDATION TECHNIQUES<br />
measurements are taken from its network <strong>of</strong> buoys and<br />
Coastal-Marine Automated Network (C-MAN) stations The validation methods used in 1996 will be<br />
(Meindl and Hamilton, 1992). This paper discusses presented before the modifications are described. The<br />
improvements to the real-time s<strong>of</strong>tware that automatically validation occurs via s<strong>of</strong>tware running at the National<br />
validates the observations. In effect, these improvements Weather Service (NWS) Telecommunication Gateway<br />
codify rules data analysts—who have years <strong>of</strong> experience (NWSTG) that encodes the observations into World<br />
with our system—use to detect degraded data.<br />
Meteorological Organization (WMO) or NWS-approved<br />
codes. <strong>Measurements</strong> <strong>of</strong> sea level pressure, air<br />
2. CONTEXT OF REAL-TIME QUALITY CONTROL temperature, sea surface temperature, dew point<br />
Before delving into the details, the proper place <strong>of</strong> temperature, wind speed, wind direction, wind gust, wave<br />
these algorithms in the data quality control process needs height, average wave period, and dominant wave period<br />
to be understood. They form the last line <strong>of</strong> defense in are validated, if measured. If any measurement fails these<br />
preventing degraded data from reaching the public. Many checks, it will not be released, and measurements from a<br />
other important measures precede them. New sensors are backup sensor, if it exists, will be examined. All <strong>NDBC</strong><br />
tested in environmental chambers before field evaluations. stations have two anemometers; all buoys have two<br />
When the onboard s<strong>of</strong>tware is modified, it is regression barometers; and a few buoys have two air temperature<br />
tested to make sure the output agrees with previously sensors.<br />
accepted values. <strong>Measurements</strong> from new sensors, buoy Several transmission checks are accomplished before<br />
hulls, or onboard systems, called payloads, are compared the data are validated. Any message with a single parity<br />
with measurements from standard configurations error is not transmitted. The wave portion <strong>of</strong> the message<br />
(Giohousen, 1987). All sensors are calibrated before every is transmitted in binary at the end <strong>of</strong> the transmission. If<br />
deployment, and site surveys are conducted to ensure this message is shorter than expected, contains checksum<br />
proper exposure <strong>of</strong> the anemometers at new C-MAN errors, or has an improper synch character, no waves are<br />
stations. Servicing technicians remain at the station until encoded.<br />
several hours <strong>of</strong> acceptable transmissions make it through The simplest <strong>of</strong> the data checks, the range check,<br />
the satellite.<br />
ensures all measurements fall within established upper<br />
The historical role <strong>of</strong> the real-time data validation and lower limits. A different set <strong>of</strong> limits is used in each <strong>of</strong><br />
algorithms was in removing the large, “gross” errors 29 climatologically similar areas.<br />
(Gilhousen, 1988). These errors are typically caused by The second check is the time-continuity check. The<br />
such things as satellite transmission problems, power formula for performing the time-continuity check is:<br />
system degradation, and broken cable connections. What<br />
these algorithms detect is virtually certain to be wrong.<br />
M 0.58<br />
, (1)<br />
* Corresponding Author Address: David B. Gilhousen,<br />
Data Systems Division, Building 1100, SSC, MS<br />
39520-6000; e-mail: dgilhousen@ndbc.noaa.gov.<br />
where M is the maximum allowable difference, F is the<br />
standard deviation <strong>of</strong> each measurement, and J is the time<br />
difference in hours since the last acceptable observation.<br />
J is never greater than 3 hours despite the actual time<br />
difference. For information on how this formula was<br />
derived, see National Data Buoy Center (1996).<br />
In practice, using station-specific values <strong>of</strong> the<br />
standard deviation <strong>of</strong> measured variables is not<br />
necessary. The general values in use are listed in Table 1.<br />
As with the general range limits, departing from the<br />
general values <strong>of</strong> F is necessary for some stations. For
example, since water temperatures near stations close to<br />
the Gulf Stream can change abruptly, F WTMP for several<br />
east coast stations was increased to 12.1 °C.<br />
Four exemptions to the time-continuity test exist.<br />
These exemptions are based on the very rapid changes<br />
TABLE 1.<br />
Measurement<br />
Standard deviations used for the<br />
time-continuity check<br />
Sea Level Pressure<br />
21.0 hPa<br />
Air Temperature 11.0 °C<br />
Water Temperature 8.6 °C<br />
Wind Speed<br />
25.0 m/s<br />
Wave Height 6.0 m<br />
Dominant Wave Period<br />
31.0 s<br />
Average Wave Period<br />
31.0 s<br />
Relative Humidity 20.0%<br />
that occur in wind, pressure, temperature, and wave height<br />
during the passage <strong>of</strong> tropical cyclones and severe<br />
extratropical cyclones. First, air pressure measurements<br />
that fail the time-continuity check are released if both the<br />
previous and current pressures are less than 1000 hPa.<br />
Second, wind speed measurements are released if both<br />
the previous and current pressures are less than 995 hPa.<br />
Third, air temperature measurements are released if either<br />
the wind speed exceeds 7 m/s or the wind direction<br />
change is greater than 40°. Finally, wave height<br />
measurements are released if the current wind speed is<br />
equal to or greater than 15 m/s. Even with these<br />
contingencies in place, analysts can elect to disable the<br />
range- and time-continuity checks for limited periods<br />
during hurricanes.<br />
Finally, internal-consistency checks are:<br />
• If the battery voltage is less than 10.5 volts, pressure<br />
is not released. This precludes the chance <strong>of</strong><br />
transmitting bad pressures from a failing station<br />
operating on minimum power.<br />
• The significant wave height, average, and dominant<br />
wave periods are set to zero if the significant wave<br />
height is less than 0.15 m. Without this,<br />
unrepresentatively large wave periods could be<br />
transmitted from an essentially flat, “signal-less”<br />
spectrum.<br />
• If the dew point exceeds the air temperature by less<br />
than 1.1 °C, the dew point is set equal to the air<br />
temperature. If the dew point exceeds the air<br />
temperature by more than 1.1 °C, the dew point is not<br />
encoded. This approach is taken because a reading<br />
slightly more than 100 percent (Breaker et. al, 1997)<br />
is normal for the hygrometers used by <strong>NDBC</strong>.<br />
• If the ratio <strong>of</strong> gust-to-mean wind speed is greater than<br />
4 or less than 1, neither the wind speed nor gust is<br />
transmitted.<br />
4. VALIDATION CHANGES FOR BETTER QUALITY<br />
CONTROL<br />
Several changes will be made in early 1998 that will<br />
help further reduce the chance <strong>of</strong> degraded data being<br />
transmitted:<br />
F<br />
• If a measurement fails either the range or<br />
time-continuity check for two consecutive<br />
observations, the measurement is not transmitted<br />
until it is manually reviewed at <strong>NDBC</strong>.<br />
• A check was installed to ensure that consecutive 10<br />
minute wind direction averages, on stations equipped<br />
with “continuous winds,” agree with the standard 8<br />
minute average wind direction. More specifically, the<br />
10-minute average wind direction that overlaps the<br />
standard one must agree within 25° <strong>of</strong> the standard if<br />
the wind speeds exceed 2.5 m/s.<br />
• A procedure was installed to determine if<br />
measurements from duplicate sensors in reasonable<br />
agreement. If the measurements fail this<br />
determination, the s<strong>of</strong>tware transmits the<br />
measurement from the sensor that exhibits better<br />
time continuity. This sensor is then chosen for all<br />
subsequent reports until it is manually reviewed. If the<br />
measurements from duplicate sensors are within the<br />
tolerances listed in Table 2, they are judged to be in<br />
reasonable agreement. This procedure is designed to<br />
detect significant sensor failures automatically and<br />
switch to a backup sensor, if one exists and is<br />
transmitting reasonable values.<br />
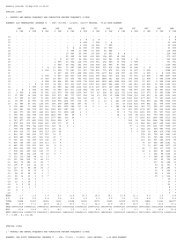
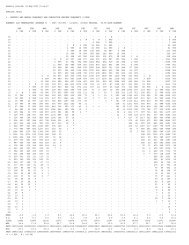
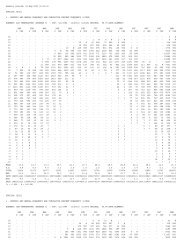
Figure 1 is a time-series plot <strong>of</strong> a wind speed failure.<br />
Under the older procedure, almost 24 hours <strong>of</strong> degraded<br />
data were transmitted before data analysts at <strong>NDBC</strong><br />
detected a wind speed failure and manually switched to<br />
the other sensor. With this new procedure, the s<strong>of</strong>tware<br />
TABLE 2. Tolerances used to validate duplicate<br />
measurements<br />
Measurement<br />
Wind Speed<br />
Wind Direction<br />
Sea Level<br />
Pressure<br />
Tolerance<br />
1.5 m/s<br />
25° provided speed > 2.5 m/s<br />
1.0 hPa<br />
would automatically transmit speeds from the second<br />
sensor beginning at 1500 UTC, on March 1, 1996.<br />
The number <strong>of</strong> degraded measurements transmitted<br />
are estimated to fall from approximately 40 to 15 each<br />
month. Excluding spectral wave measurements, about<br />
800,000 measurements are transmitted each month.<br />
5. VALIDATION CHANGES TO INCREASE DATA<br />
Several aspects <strong>of</strong> the real-time quality control system<br />
were judged overly restrictive. The following improvements<br />
will be made resulting in additional data being transmitted:<br />
• The consequences <strong>of</strong> a parity error will be made less<br />
inhibiting. Under the new system, only the<br />
measurement where the error is located is not<br />
transmitted. Previously, the entire message was not<br />
transmitted. One famous observation that never got<br />
transmitted because <strong>of</strong> this problem was from station<br />
42020 during the formative stages <strong>of</strong> the March 1993<br />
Superstorm (Gilhousen, 1994).<br />
• The ability to transmit wind speeds from one<br />
anemometer and the wind directions from another<br />
was enabled. This circumstance can result from a<br />
cracked propeller or worn bearings on one<br />
anemometer and a faulty compass associated with
the other. At any given time in <strong>NDBC</strong>’s network <strong>of</strong> 120<br />
stations, this situation happens at one or two stations.<br />
• The range check will be made less powerful because<br />
on a few, rare instances, it caused valid, but extreme,<br />
data to be withheld from transmission. More<br />
specifically, a measurement has to fail a timecontinuity<br />
check for the previous observation before<br />
it can be deleted because <strong>of</strong> a range check.<br />
• The real-time processing was installed on two UNIX<br />
workstations running simultaneously. This provides<br />
automatic backup capability without the need for<br />
manual intervention if a workstation fails or the<br />
processing on it crashes.<br />
One other improvement concerns the timeliness <strong>of</strong> the<br />
validation. The validation is now done every 5 minutes<br />
instead <strong>of</strong> every 15 minutes. This means that NWS field<br />
<strong>of</strong>fices are more likely to receive the observations before<br />
National Oceanic and Atmospheric Administration (NOAA)<br />
Weather Radio cut-<strong>of</strong>f times.<br />
6. CONCLUSION<br />
Many changes were made recently to the real-time<br />
processing and quality control s<strong>of</strong>tware for <strong>NDBC</strong> stations.<br />
These changes increase the overall amount <strong>of</strong> data while<br />
decreasing the chance <strong>of</strong> degraded measurements being<br />
transmitted. In recent years, the public began directly<br />
accessing <strong>NDBC</strong> observations from several home pages<br />
to verify marine forecasts and make their own marine<br />
safety decisions. One <strong>of</strong> these home pages receives more<br />
than three million “hits” a month! These Internet home<br />
pages obtain the reports from our encoded messages that<br />
undergo the quality control described. Therefore,<br />
automated validation techniques have become very<br />
important.<br />
7. REFERENCES<br />
Breaker, L.C., Gilhousen, D.B., and Burroughs, L.D.,<br />
1997: Preliminary results from long-term measurements <strong>of</strong><br />
atmospheric moisture in the marine boundary layer,<br />
accepted by J. Atmos. Oceanic Technol.<br />
Gilhousen, D.B., 1994: The value <strong>of</strong> <strong>NDBC</strong> observations<br />
during March 1993’s “Storm <strong>of</strong> the Century”, Weather and<br />
Forecasting, 9, 255-264.<br />
Gilhousen, D.B., 1988: <strong>Quality</strong> control <strong>of</strong> meteorological<br />
data from automated marine stations, Preprints, Fourth Int.<br />
Conf. on Interactive Information and Processing Systems<br />
for Meteorology, Oceanography, and Hydrology, Anaheim,<br />
CA, Amer. Meteor. Soc., 248-253.<br />
Gilhousen, D.B., 1987: A field evaluation <strong>of</strong> <strong>NDBC</strong> moored<br />
buoy winds, J. Atmos. Oceanic Technol., 4, 94-104.<br />
Meindl, E.A., and Hamilton, G.D., 1992: Programs <strong>of</strong> the<br />
National Data Buoy Center, Bull. Amer. Meteor. Soc., 4,<br />
984-993.<br />
National Data Buoy Center, 1996: Handbook <strong>of</strong> automated<br />
data quality control checks and procedures <strong>of</strong> the National<br />
Data Buoy Center.<br />
Figure 1. <strong>Time</strong>-series plot <strong>of</strong> wind speed measurements from two anemometers<br />
at buoy station 51003 located west <strong>of</strong> Hawaii