Fundamentals Training - S. Newell and J. Weiss Presentation - WSPP
Fundamentals Training - S. Newell and J. Weiss Presentation - WSPP
Fundamentals Training - S. Newell and J. Weiss Presentation - WSPP

Create successful ePaper yourself
Turn your PDF publications into a flip-book with our unique Google optimized e-Paper software.
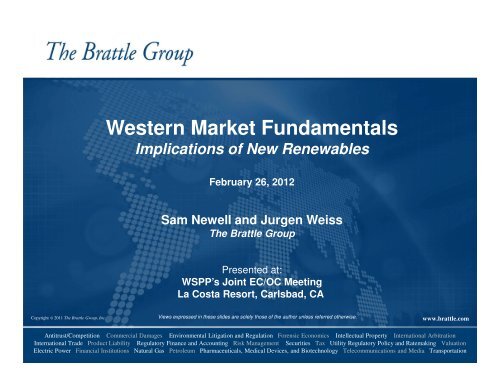
Western Market <strong>Fundamentals</strong><br />
Implications of New Renewables<br />
February 26, 2012<br />
Sam <strong>Newell</strong> <strong>and</strong> Jurgen <strong>Weiss</strong><br />
The Brattle Group<br />
Presented at:<br />
<strong>WSPP</strong>’s Joint EC/OC Meeting<br />
La Costa Resort, Carlsbad, CA<br />
Copyright © 2011 The Brattle Group, Inc.<br />
Views expressed in these slides are solely those of the author unless referred otherwise.<br />
www.brattle.com<br />
Antitrust/Competition Commercial Damages Environmental Litigation <strong>and</strong> Regulation Forensic Economics Intellectual Property International Arbitration<br />
International Trade Product Liability Regulatory Finance <strong>and</strong> Accounting Risk Management Securities Tax Utility Regulatory Policy <strong>and</strong> Ratemaking Valuation<br />
Electric Power Financial Institutions Natural Gas Petroleum Pharmaceuticals, Medical Devices, <strong>and</strong> Biotechnology Telecommunications <strong>and</strong> Media Transportation
Agenda<br />
♦ Recent Prices <strong>and</strong> Market Heat Rates<br />
♦ Key <strong>Fundamentals</strong> Looking Forward<br />
♦ Major Driver: New Renewables<br />
♦ Impacts of Renewables on Markets<br />
♦ Takeaways for Traders<br />
2
Electricity Prices at Major WECC Hubs (2007-2012)<br />
$/MWh<br />
$/MWh<br />
Daily On-Peak<br />
$160<br />
$140<br />
$120<br />
$100<br />
$80<br />
$60<br />
$40<br />
$20<br />
$0<br />
Jun-07 Jun-08 Jun-09 Jun-10 Jun-11<br />
Daily Off-Peak<br />
$160<br />
$140<br />
$120<br />
$100<br />
$80<br />
$60<br />
$40<br />
$20<br />
$0<br />
Jun-07 Jun-08 Jun-09 Jun-10 Jun-11<br />
3<br />
Mid C<br />
NP-15<br />
SP-15<br />
Palo Verde<br />
Mid C<br />
NP-15<br />
SP-15<br />
Palo Verde
Market Heat Rates at Major WECC Hubs (2007-2012)<br />
Btu/kWh<br />
Btu/kWh<br />
20,000<br />
Daily On-Peak<br />
18,000<br />
16,000<br />
14,000<br />
12,000<br />
10,000<br />
8,000<br />
6,000<br />
4,000<br />
2,000<br />
0<br />
Jun-07 Jun-08 Jun-09 Jun-10 Jun-11<br />
20,000<br />
Daily Off-Peak<br />
18,000<br />
16,000<br />
14,000<br />
12,000<br />
10,000<br />
8,000<br />
6,000<br />
4,000<br />
2,000<br />
0<br />
Jun-07 Jun-08 Jun-09 Jun-10 Jun-11<br />
Mid C<br />
NP-15<br />
SP-15<br />
Palo Verde<br />
Mid C<br />
NP-15<br />
SP-15<br />
Palo Verde<br />
4
Key Fundamental Factors Looking Forward<br />
DEMAND<br />
SUPPLY<br />
• Load growth<br />
tempered by energy<br />
efficiency<br />
• Resource adequacy<br />
requirements <strong>and</strong><br />
procurement<br />
• RPS targets <strong>and</strong><br />
procurement<br />
• Low gas prices<br />
• Renewables for RPS<br />
• Environmental<br />
retirements<br />
• Hydro variability<br />
• Cap <strong>and</strong> trade<br />
The biggest changes will come from planned <strong>and</strong> future renewables<br />
5
Dem<strong>and</strong> Projections for Renewable Energy<br />
Annual Renewable Dem<strong>and</strong> (GWh)<br />
State RPS Requirements in WECC (% of Retail Load)<br />
State 2011 2012 2013 2014 2015 2016 2017 2018 2019 2020<br />
Arizona 3.0% 3.5% 4.0% 4.5% 5.0% 6.0% 7.0% 8.0% 9.0% 10.0%<br />
California 18.0% 19.0% 20.0% 21.7% 23.3% 25.0% 27.0% 29.0% 31.0% 33.0%<br />
Colorado 12.0% 12.0% 12.0% 12.0% 20.0% 20.0% 20.0% 20.0% 20.0% 30.0%<br />
Idaho 0.0% 0.0% 0.0% 0.0% 0.0% 0.0% 0.0% 0.0% 0.0% 0.0%<br />
Montana 10.0% 10.0% 10.0% 10.0% 15.0% 15.0% 15.0% 15.0% 15.0% 15.0%<br />
New Mexico 10.0% 11.7% 13.3% 15.0% 15.0% 16.0% 17.0% 18.0% 19.0% 20.0%<br />
Nevada 15.0% 15.0% 18.0% 18.0% 20.0% 20.0% 20.0% 20.0% 20.0% 22.0%<br />
Oregon 5.0% 7.5% 10.0% 12.5% 15.0% 16.0% 17.0% 18.0% 19.0% 20.0%<br />
Utah 0.0% 0.0% 0.0% 0.0% 0.0% 0.0% 0.0% 0.0% 0.0% 0.0%<br />
Washington 1.5% 3.0% 4.5% 6.0% 7.5% 9.0% 10.5% 12.0% 13.5% 15.0%<br />
Wyoming 0.0% 0.0% 0.0% 0.0% 0.0% 0.0% 0.0% 0.0% 0.0% 0.0%<br />
TOTAL 10.2% 11.1% 12.2% 13.3% 15.2% 16.3% 17.5% 18.7% 19.9% 22.1%<br />
200,000<br />
180,000<br />
160,000<br />
140,000<br />
120,000<br />
100,000<br />
80,000<br />
60,000<br />
40,000<br />
20,000<br />
0<br />
Annual Dem<strong>and</strong> for Renewable Energy<br />
2011<br />
2012<br />
2013<br />
2014<br />
2015<br />
2016<br />
2017<br />
2018<br />
2019<br />
2020<br />
Washington<br />
Oregon<br />
Nevada<br />
New Mexico<br />
Montana<br />
Colorado<br />
California<br />
Arizona<br />
♦ Dem<strong>and</strong> driven by state RPS<br />
♦ Existing dem<strong>and</strong> is about 80,000<br />
GWh (~11% of system load)<br />
♦ Requirements increase over time<br />
• 115,000 GWh by 2015 (~15% of load)<br />
• 177,000 GWh in 2020 (~22% of load)<br />
♦ CA dem<strong>and</strong> > 60% of total<br />
Sources <strong>and</strong> Notes:<br />
[1] RPS requirements based on most recent state rules <strong>and</strong> regulations; Voluntary goals in UT are not included;<br />
RPS requirements are interpolated based on interim targets for CA, OR, NM, <strong>and</strong> WA.<br />
[2] Dem<strong>and</strong> calculations based on EIA electricity sales for 2010 <strong>and</strong> 1.2%/yr growth rate; Grossed up by 8% for T&D losses<br />
6
Supply Projections for Renewable Energy in WECC<br />
MW<br />
18,000<br />
16,000<br />
14,000<br />
12,000<br />
10,000<br />
8,000<br />
6,000<br />
4,000<br />
2,000<br />
0<br />
Existing & Planned Renewable Supply<br />
Arizona<br />
California<br />
Colorado<br />
Idaho<br />
Partially Permitted<br />
Testing, Under Constr. & Site Prep<br />
Existing<br />
Montana<br />
Nevada<br />
New Mexico<br />
Oregon<br />
Utah<br />
Washington<br />
Wyoming<br />
Planned Renewable Capacity Additions<br />
by Technology<br />
♦ ~22 GW of existing RPS-qualified capacity<br />
• 1/2 in CA<br />
• 2/3 wind<br />
♦ ~14 GW more planned by 2015<br />
• Mostly solar <strong>and</strong> wind<br />
• Suffices to meet 2015 RPS dem<strong>and</strong><br />
♦ Much more needed in 2015-20 for RPS<br />
• 25-35 GW, depending on types<br />
• Depends on costs <strong>and</strong> state/federal policies<br />
Source: Calculated based on unit data compiled by Ventyx, the Velocity Suite<br />
(as of February, 2012).<br />
7
Renewables Likely to Maintain Low Energy Prices<br />
100,000<br />
80,000<br />
Changes in Key Factors Relative to 2007<br />
WECC Renewable<br />
Generation<br />
60,000<br />
40,000<br />
WECC Load<br />
GWh<br />
20,000<br />
0<br />
BPA Hydro<br />
-20,000<br />
-40,000<br />
Load Net of<br />
BPA Hydro <strong>and</strong><br />
Renewable Gen<br />
-60,000<br />
2007 2008 2009 2010 2011 2012 2013 2014 2015 2016 2017 2018<br />
Sources: Estimated based on data from EIA, Ventyx, BPA, TEPPC.<br />
8
Substantial Amounts of PV Can Have Dramatic<br />
Impacts on Peak Prices – Germany Example<br />
German Power Market July 16, 2011<br />
♦ Germany installing a lot of solar<br />
♦ Price impacts illustrated on 7/16/2011<br />
• Solar generation (yellow) removed the<br />
“peakiness” of residual load<br />
• Resulting hourly prices (red on middle<br />
graph) were almost completely flat<br />
• Compared to a “typical” summer day<br />
(7/16/2009 – red line in lower graph)<br />
German Power Market July 16, 2009<br />
♦ This is being lauded as the “price<br />
suppression benefit of solar” <strong>and</strong> as<br />
destroying the energy margins of<br />
fossil generation<br />
Sources: Solarserver.de; EEX<br />
9
Implications for System Operations<br />
Western Wind <strong>and</strong> Solar Integration Study<br />
(WWSIS) for WestConnect, Phase 1 (2010)<br />
Like other renewable integration studies,<br />
found challenges w/high penetration<br />
Found WestConnect can accommodate<br />
30% wind <strong>and</strong> 5% solar with:<br />
♦ Coordinating commitment <strong>and</strong> dispatch<br />
regionally, across balancing areas<br />
♦ Sub-hourly scheduling <strong>and</strong> transmission<br />
♦ Integrating forecasts into dispatch <strong>and</strong><br />
operations<br />
♦ Committing additional operating reserves<br />
♦ Exploiting flexibility from conventional<br />
generation (cycling/ramping) <strong>and</strong> renewable<br />
generation (ramping down)<br />
Sources: NREL, Stakeholder Webinar May 19, 2011 WWSIS Phase 2<br />
10
Implications for Market Ops & Structures – Next Steps<br />
WWSIS Phase 2 is underway:<br />
♦ Analyze wear & tear impacts on<br />
thermal units; mitigation options<br />
♦ Emission impacts <strong>and</strong> optimal unit<br />
commitment <strong>and</strong> economic dispatch<br />
The PUC Energy Imbalance Market (EIM)<br />
Group is working on formalizing Western<br />
balancing area cooperation:<br />
♦ Commissioners from AZ, CA, CO, ID,<br />
MT, NV, NM, OR, TX, UT, WA, WY<br />
♦ Actively investigating the costs <strong>and</strong><br />
benefits of a regional sub-hourly EIM<br />
CAISO proposing “resource adequacy”<br />
requirements for flexible capacity<br />
Such efforts may provide opportunities<br />
for flexible generation to earn additional<br />
revenues (but wear & tear on units)<br />
Sources: NREL, Stakeholder Webinar May 19, 2011 WWSIS Phase 2<br />
11
Takeaways for Traders<br />
♦ Renewable development is one of the biggest<br />
fundamental drivers in the West<br />
♦ New renewables are likely to more than offset the energy<br />
price impact of load growth (<strong>and</strong> of an expected return to<br />
normal hydro conditions)<br />
• Solar can depress prices especially on-peak<br />
• Wind can depress prices especially off-peak<br />
♦ Wind <strong>and</strong> solar variability <strong>and</strong> unpredictability will require<br />
a more flexible system<br />
• Opportunities for flexible fossil generation<br />
12
About The Brattle Group<br />
The Brattle Group provides consulting <strong>and</strong> expert testimony in economics, finance, <strong>and</strong><br />
regulation to corporations, law firms, <strong>and</strong> governmental agencies around the world.<br />
We combine in-depth industry experience, rigorous analyses, <strong>and</strong> principled techniques<br />
to help clients answer complex economic <strong>and</strong> financial questions in litigation <strong>and</strong><br />
regulation, develop strategies for changing markets, <strong>and</strong> make critical business decisions.<br />
Climate Change Policy <strong>and</strong> Planning<br />
Cost of Capital<br />
Dem<strong>and</strong> Forecasting<br />
Dem<strong>and</strong> Response <strong>and</strong> Energy Efficiency<br />
Electricity Market Modeling<br />
Energy Asset Valuation<br />
Energy Contract Litigation<br />
Environmental Compliance<br />
Fuel <strong>and</strong> Power Procurement<br />
Incentive Regulation<br />
Rate Design, Cost Allocation, <strong>and</strong> Rate Structure<br />
Regulatory Strategy <strong>and</strong> Litigation Support<br />
Renewables<br />
Resource Planning<br />
Retail Access <strong>and</strong> Restructuring<br />
Risk Management<br />
Market-Based Rates<br />
Market Design <strong>and</strong> Competitive Analysis<br />
Mergers <strong>and</strong> Acquisitions<br />
Transmission<br />
Sam <strong>Newell</strong> (sam.newell@brattle.com), Jurgen <strong>Weiss</strong> (jurgen.weiss@brattle.com)<br />
44 Brattle Street, Cambridge, MA 02138<br />
617-864-7900 (www.brattle.com)<br />
13