A Proposal for Integration of In-process Project Visualization and ...
A Proposal for Integration of In-process Project Visualization and ...
A Proposal for Integration of In-process Project Visualization and ...
You also want an ePaper? Increase the reach of your titles
YUMPU automatically turns print PDFs into web optimized ePapers that Google loves.
project benchmark data collection to project prediction<br />
<strong>and</strong> estimation is also recommended.<br />
2.3 <strong>In</strong>tegrated Approach<br />
Some excellent link tables that connect related check<br />
sheet items, problem project summary data <strong>and</strong><br />
measurement items are provided. For example, from<br />
unusual check results <strong>of</strong> the check sheet, related past<br />
problem project summary <strong>and</strong> related measurement<br />
items are easy to retrieve. Related check items <strong>and</strong> past<br />
problem project summary are also easy to retrieve from<br />
unusual measurement results.<br />
3. <strong>In</strong>-<strong>process</strong> <strong>Visualization</strong> <strong>and</strong> Traceability<br />
3.1 Key Factor <strong>of</strong> Two Targets<br />
The main purpose <strong>of</strong> project visualization through in<strong>process</strong><br />
project measurement is smooth project<br />
management. The key factors are measurement,<br />
analysis <strong>and</strong> feedback. Collecting <strong>process</strong> <strong>and</strong> product<br />
data <strong>for</strong> efficient project management with minimum<br />
measurement overhead work is necessary. How to<br />
analyze <strong>and</strong> visualize collected data is also important.<br />
How to feed the visualized data back is an essential<br />
issue.<br />
While the purpose <strong>of</strong> keeping traceability is recording<br />
an invisible s<strong>of</strong>tware project, the use is analysis <strong>of</strong><br />
serious s<strong>of</strong>tware accidents, incidents, conflicts <strong>and</strong><br />
long-term s<strong>of</strong>tware maintenance. For all purposes,<br />
recorded data is used in the post-<strong>process</strong>. The key<br />
factors are also measurement, analysis <strong>and</strong> feedback<br />
(in<strong>for</strong>mation provision), but the contents are quite<br />
different from project management. Measurement<br />
items must be useful <strong>for</strong> investigating serious accident<br />
or resolving incidents <strong>and</strong> conflicts. Target persons <strong>for</strong><br />
in<strong>for</strong>mation provision are not project managers.<br />
3.2 <strong>Proposal</strong> <strong>of</strong> Measurement Environment<br />
<strong><strong>In</strong>tegration</strong><br />
<strong>In</strong>-<strong>process</strong> project measurement <strong>for</strong> two different<br />
purposes needs individually different functions <strong>and</strong><br />
structures, but there are similarities in measurement,<br />
analysis <strong>and</strong> feedback. Both measurement targets are<br />
the same s<strong>of</strong>tware project, so the project operation<br />
perspective requires an integrated method to keep<br />
differences in measurement purposes from creating<br />
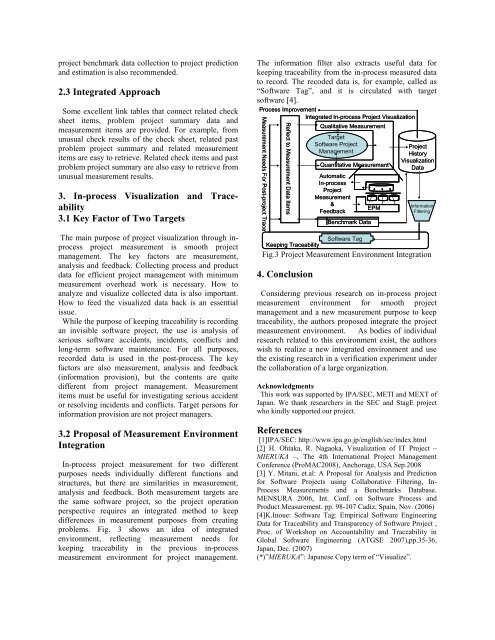
problems. Fig. 3 shows an idea <strong>of</strong> integrated<br />
environment, reflecting measurement needs <strong>for</strong><br />
keeping traceability in the previous in-<strong>process</strong><br />
measurement environment <strong>for</strong> project management.<br />
The in<strong>for</strong>mation filter also extracts useful data <strong>for</strong><br />
keeping traceability from the in-<strong>process</strong> measured data<br />
to record. The recoded data is, <strong>for</strong> example, called as<br />
“S<strong>of</strong>tware Tag”, <strong>and</strong> it is circulated with target<br />
s<strong>of</strong>tware [4].<br />
Process Improvement<br />
<strong>In</strong>tegrated <strong>In</strong>-<strong>process</strong> <strong>Project</strong> <strong>Visualization</strong><br />
Measurement Needs For Post-project Trace<br />
Reflect to Measurement Data Items<br />
Keeping Traceability<br />
Qualitative Measurement<br />
Target<br />
S<strong>of</strong>tware <strong>Project</strong><br />
Management<br />
Quantitative Measurement<br />
Automatic<br />
<strong>In</strong>-<strong>process</strong><br />
<strong>Project</strong><br />
Measurement<br />
&<br />
Feedback<br />
Benchmark Data<br />
S<strong>of</strong>tware Tag<br />
EPM<br />
<strong>Project</strong><br />
History<br />
<strong>Visualization</strong><br />
Data<br />
<strong>In</strong><strong>for</strong>mation<br />
Filtering<br />
Fig.3 <strong>Project</strong> Measurement Environment <strong><strong>In</strong>tegration</strong><br />
4. Conclusion<br />
Considering previous research on in-<strong>process</strong> project<br />
measurement environment <strong>for</strong> smooth project<br />
management <strong>and</strong> a new measurement purpose to keep<br />
traceability, the authors proposed integrate the project<br />
measurement environment. As bodies <strong>of</strong> individual<br />
research related to this environment exist, the authors<br />
wish to realize a new integrated environment <strong>and</strong> use<br />
the existing research in a verification experiment under<br />
the collaboration <strong>of</strong> a large organization.<br />
Acknowledgments<br />
This work was supported by IPA/SEC, METI <strong>and</strong> MEXT <strong>of</strong><br />
Japan. We thank researchers in the SEC <strong>and</strong> StagE project<br />
who kindly supported our project.<br />
References<br />
[1]IPA/SEC: http://www.ipa.go.jp/english/sec/index.html<br />
[2] H. Ohtaka, R. Nagaoka, <strong>Visualization</strong> <strong>of</strong> IT <strong>Project</strong> –<br />
MIERUKA –, The 4th <strong>In</strong>ternational <strong>Project</strong> Management<br />
Conference (ProMAC2008), Anchorage, USA Sep.2008<br />
[3] Y. Mitani, et.al: A <strong>Proposal</strong> <strong>for</strong> Analysis <strong>and</strong> Prediction<br />
<strong>for</strong> S<strong>of</strong>tware <strong>Project</strong>s using Collaborative Filtering, <strong>In</strong>-<br />
Process Measurements <strong>and</strong> a Benchmarks Database.<br />
MENSURA 2006, <strong>In</strong>t. Conf. on S<strong>of</strong>tware Process <strong>and</strong><br />
Product Measurement. pp. 98-107 Cadiz, Spain, Nov. (2006)<br />
[4]K.<strong>In</strong>oue: S<strong>of</strong>tware Tag: Empirical S<strong>of</strong>tware Engineering<br />
Data <strong>for</strong> Traceability <strong>and</strong> Transparency <strong>of</strong> S<strong>of</strong>tware <strong>Project</strong> ,<br />
Proc. <strong>of</strong> Workshop on Accountability <strong>and</strong> Traceability in<br />
Global S<strong>of</strong>tware Engineering (ATGSE 2007),pp.35-36,<br />
Japan, Dec. (2007)<br />
(*)”MIERUKA”: Japanese Copy term <strong>of</strong> “Visualize”.


