A Proposal for Integration of In-process Project Visualization and ...
A Proposal for Integration of In-process Project Visualization and ...
A Proposal for Integration of In-process Project Visualization and ...

Create successful ePaper yourself
Turn your PDF publications into a flip-book with our unique Google optimized e-Paper software.
A <strong>Proposal</strong> <strong>for</strong> <strong><strong>In</strong>tegration</strong> <strong>of</strong> <strong>In</strong>-<strong>process</strong> <strong>Project</strong> <strong>Visualization</strong> <strong>and</strong><br />
Keeping Post-<strong>process</strong> Traceability:<br />
“MIERUKA” Method <strong>and</strong> “S<strong>of</strong>tware Tag” Framework<br />
Yoshiki Mitani 1,2 , Hiroshi Ohtaka 1,3 , Ryozo Nagaoka 1 ,<br />
Hiroyuki Yoshikawa 1 , Noboru Higuchi 1 , Seishiro Tsuruho 1,4<br />
1 <strong>In</strong><strong>for</strong>mation Technology Promotion Agency, Japan / S<strong>of</strong>tware Engineering Center (IPA/SEC)<br />
2 .Nara <strong>In</strong>stitute <strong>of</strong> Science & Technology(NAIST), 3 Waseda University, 4 Kochi University <strong>of</strong> Technology<br />
{y-mitani | r-nagao | h-yoshi |n-higu |tsuruho}@ipa.go.jp, otaka@fuji.waseda.jp<br />
Abstract<br />
The authors, as part <strong>of</strong> a s<strong>of</strong>tware engineering<br />
research <strong>and</strong> investigation organization collaborating<br />
with industry, academia <strong>and</strong> government, had<br />
developed an integrated method <strong>and</strong> tools <strong>for</strong> s<strong>of</strong>tware<br />
project visualization <strong>and</strong> popularized them[1][2].<br />
“Keeping Traceability” had added a new object to this<br />
activity. <strong>In</strong> this paper, the authors present an overview<br />
<strong>of</strong> the previous activity, consider the comparison <strong>of</strong><br />
two objects, <strong>and</strong> then propose an integrated<br />
environment <strong>of</strong> project measurement.<br />
1. <strong>In</strong>troduction<br />
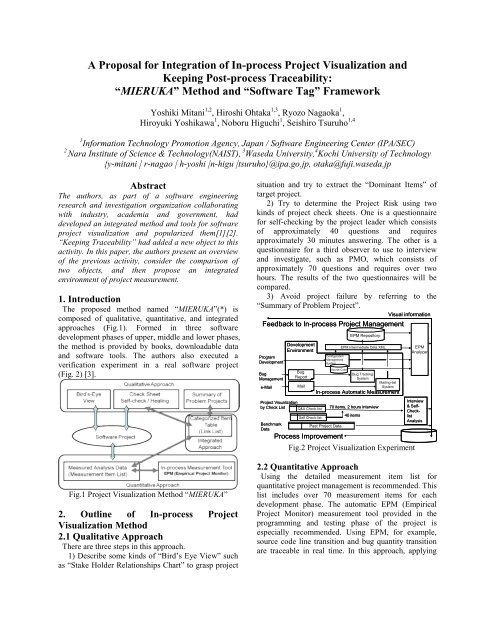
The proposed method named “MIERUKA”(*) is<br />
composed <strong>of</strong> qualitative, quantitative, <strong>and</strong> integrated<br />
approaches (Fig.1). Formed in three s<strong>of</strong>tware<br />
development phases <strong>of</strong> upper, middle <strong>and</strong> lower phases,<br />
the method is provided by books, downloadable data<br />
<strong>and</strong> s<strong>of</strong>tware tools. The authors also executed a<br />
verification experiment in a real s<strong>of</strong>tware project<br />
(Fig. 2) [3].<br />
Fig.1 <strong>Project</strong> <strong>Visualization</strong> Method “MIERUKA”<br />
2. Outline <strong>of</strong> <strong>In</strong>-<strong>process</strong> <strong>Project</strong><br />
<strong>Visualization</strong> Method<br />
2.1 Qualitative Approach<br />
There are three steps in this approach.<br />
1) Describe some kinds <strong>of</strong> “Bird’s Eye View” such<br />
as “Stake Holder Relationships Chart” to grasp project<br />
situation <strong>and</strong> try to extract the “Dominant Items” <strong>of</strong><br />
target project.<br />
2) Try to determine the <strong>Project</strong> Risk using two<br />
kinds <strong>of</strong> project check sheets. One is a questionnaire<br />
<strong>for</strong> self-checking by the project leader which consists<br />
<strong>of</strong> approximately 40 questions <strong>and</strong> requires<br />
approximately 30 minutes answering. The other is a<br />
questionnaire <strong>for</strong> a third observer to use to interview<br />
<strong>and</strong> investigate, such as PMO, which consists <strong>of</strong><br />
approximately 70 questions <strong>and</strong> requires over two<br />
hours. The results <strong>of</strong> the two questionnaires will be<br />
compared.<br />
3) Avoid project failure by referring to the<br />
“Summary <strong>of</strong> Problem <strong>Project</strong>”.<br />
Feedback to <strong>In</strong>-<strong>process</strong> <strong>Project</strong> Management<br />
Program<br />
Development<br />
Bug<br />
Management<br />
e-Mail<br />
Development<br />
Environment<br />
Bug<br />
Report<br />
Mail<br />
<strong>Project</strong> <strong>Visualization</strong><br />
by Check List<br />
Q&A Check-list<br />
Benchmark<br />
Data<br />
Self Check-list<br />
Configuration<br />
Management<br />
System<br />
Source Code<br />
EPM Repository:<br />
EPM <strong>In</strong>termediate Data XML<br />
Bug Tracking<br />
System<br />
70 items, 2 hours interview<br />
40 items<br />
Visual in<strong>for</strong>mation<br />
Mailing-list<br />
System<br />
<strong>In</strong>-<strong>process</strong> Automatic Measurement<br />
Past <strong>Project</strong> Data<br />
Process Improvement<br />
Fig.2 <strong>Project</strong> <strong>Visualization</strong> Experiment<br />
EPM<br />
Analyzer<br />
<strong>In</strong>terview<br />
& Self-<br />
Checklist<br />
Analysis<br />
2.2 Quantitative Approach<br />
Using the detailed measurement item list <strong>for</strong><br />
quantitative project management is recommended. This<br />
list includes over 70 measurement items <strong>for</strong> each<br />
development phase. The automatic EPM (Empirical<br />
<strong>Project</strong> Monitor) measurement tool provided in the<br />
programming <strong>and</strong> testing phase <strong>of</strong> the project is<br />
especially recommended. Using EPM, <strong>for</strong> example,<br />
source code line transition <strong>and</strong> bug quantity transition<br />
are traceable in real time. <strong>In</strong> this approach, applying
project benchmark data collection to project prediction<br />
<strong>and</strong> estimation is also recommended.<br />
2.3 <strong>In</strong>tegrated Approach<br />
Some excellent link tables that connect related check<br />
sheet items, problem project summary data <strong>and</strong><br />
measurement items are provided. For example, from<br />
unusual check results <strong>of</strong> the check sheet, related past<br />
problem project summary <strong>and</strong> related measurement<br />
items are easy to retrieve. Related check items <strong>and</strong> past<br />
problem project summary are also easy to retrieve from<br />
unusual measurement results.<br />
3. <strong>In</strong>-<strong>process</strong> <strong>Visualization</strong> <strong>and</strong> Traceability<br />
3.1 Key Factor <strong>of</strong> Two Targets<br />
The main purpose <strong>of</strong> project visualization through in<strong>process</strong><br />
project measurement is smooth project<br />
management. The key factors are measurement,<br />
analysis <strong>and</strong> feedback. Collecting <strong>process</strong> <strong>and</strong> product<br />
data <strong>for</strong> efficient project management with minimum<br />
measurement overhead work is necessary. How to<br />
analyze <strong>and</strong> visualize collected data is also important.<br />
How to feed the visualized data back is an essential<br />
issue.<br />
While the purpose <strong>of</strong> keeping traceability is recording<br />
an invisible s<strong>of</strong>tware project, the use is analysis <strong>of</strong><br />
serious s<strong>of</strong>tware accidents, incidents, conflicts <strong>and</strong><br />
long-term s<strong>of</strong>tware maintenance. For all purposes,<br />
recorded data is used in the post-<strong>process</strong>. The key<br />
factors are also measurement, analysis <strong>and</strong> feedback<br />
(in<strong>for</strong>mation provision), but the contents are quite<br />
different from project management. Measurement<br />
items must be useful <strong>for</strong> investigating serious accident<br />
or resolving incidents <strong>and</strong> conflicts. Target persons <strong>for</strong><br />
in<strong>for</strong>mation provision are not project managers.<br />
3.2 <strong>Proposal</strong> <strong>of</strong> Measurement Environment<br />
<strong><strong>In</strong>tegration</strong><br />
<strong>In</strong>-<strong>process</strong> project measurement <strong>for</strong> two different<br />
purposes needs individually different functions <strong>and</strong><br />
structures, but there are similarities in measurement,<br />
analysis <strong>and</strong> feedback. Both measurement targets are<br />
the same s<strong>of</strong>tware project, so the project operation<br />
perspective requires an integrated method to keep<br />
differences in measurement purposes from creating<br />
problems. Fig. 3 shows an idea <strong>of</strong> integrated<br />
environment, reflecting measurement needs <strong>for</strong><br />
keeping traceability in the previous in-<strong>process</strong><br />
measurement environment <strong>for</strong> project management.<br />
The in<strong>for</strong>mation filter also extracts useful data <strong>for</strong><br />
keeping traceability from the in-<strong>process</strong> measured data<br />
to record. The recoded data is, <strong>for</strong> example, called as<br />
“S<strong>of</strong>tware Tag”, <strong>and</strong> it is circulated with target<br />
s<strong>of</strong>tware [4].<br />
Process Improvement<br />
<strong>In</strong>tegrated <strong>In</strong>-<strong>process</strong> <strong>Project</strong> <strong>Visualization</strong><br />
Measurement Needs For Post-project Trace<br />
Reflect to Measurement Data Items<br />
Keeping Traceability<br />
Qualitative Measurement<br />
Target<br />
S<strong>of</strong>tware <strong>Project</strong><br />
Management<br />
Quantitative Measurement<br />
Automatic<br />
<strong>In</strong>-<strong>process</strong><br />
<strong>Project</strong><br />
Measurement<br />
&<br />
Feedback<br />
Benchmark Data<br />
S<strong>of</strong>tware Tag<br />
EPM<br />
<strong>Project</strong><br />
History<br />
<strong>Visualization</strong><br />
Data<br />
<strong>In</strong><strong>for</strong>mation<br />
Filtering<br />
Fig.3 <strong>Project</strong> Measurement Environment <strong><strong>In</strong>tegration</strong><br />
4. Conclusion<br />
Considering previous research on in-<strong>process</strong> project<br />
measurement environment <strong>for</strong> smooth project<br />
management <strong>and</strong> a new measurement purpose to keep<br />
traceability, the authors proposed integrate the project<br />
measurement environment. As bodies <strong>of</strong> individual<br />
research related to this environment exist, the authors<br />
wish to realize a new integrated environment <strong>and</strong> use<br />
the existing research in a verification experiment under<br />
the collaboration <strong>of</strong> a large organization.<br />
Acknowledgments<br />
This work was supported by IPA/SEC, METI <strong>and</strong> MEXT <strong>of</strong><br />
Japan. We thank researchers in the SEC <strong>and</strong> StagE project<br />
who kindly supported our project.<br />
References<br />
[1]IPA/SEC: http://www.ipa.go.jp/english/sec/index.html<br />
[2] H. Ohtaka, R. Nagaoka, <strong>Visualization</strong> <strong>of</strong> IT <strong>Project</strong> –<br />
MIERUKA –, The 4th <strong>In</strong>ternational <strong>Project</strong> Management<br />
Conference (ProMAC2008), Anchorage, USA Sep.2008<br />
[3] Y. Mitani, et.al: A <strong>Proposal</strong> <strong>for</strong> Analysis <strong>and</strong> Prediction<br />
<strong>for</strong> S<strong>of</strong>tware <strong>Project</strong>s using Collaborative Filtering, <strong>In</strong>-<br />
Process Measurements <strong>and</strong> a Benchmarks Database.<br />
MENSURA 2006, <strong>In</strong>t. Conf. on S<strong>of</strong>tware Process <strong>and</strong><br />
Product Measurement. pp. 98-107 Cadiz, Spain, Nov. (2006)<br />
[4]K.<strong>In</strong>oue: S<strong>of</strong>tware Tag: Empirical S<strong>of</strong>tware Engineering<br />
Data <strong>for</strong> Traceability <strong>and</strong> Transparency <strong>of</strong> S<strong>of</strong>tware <strong>Project</strong> ,<br />
Proc. <strong>of</strong> Workshop on Accountability <strong>and</strong> Traceability in<br />
Global S<strong>of</strong>tware Engineering (ATGSE 2007),pp.35-36,<br />
Japan, Dec. (2007)<br />
(*)”MIERUKA”: Japanese Copy term <strong>of</strong> “Visualize”.