Annual Report 2011
Annual Report 2011
Annual Report 2011

You also want an ePaper? Increase the reach of your titles
YUMPU automatically turns print PDFs into web optimized ePapers that Google loves.
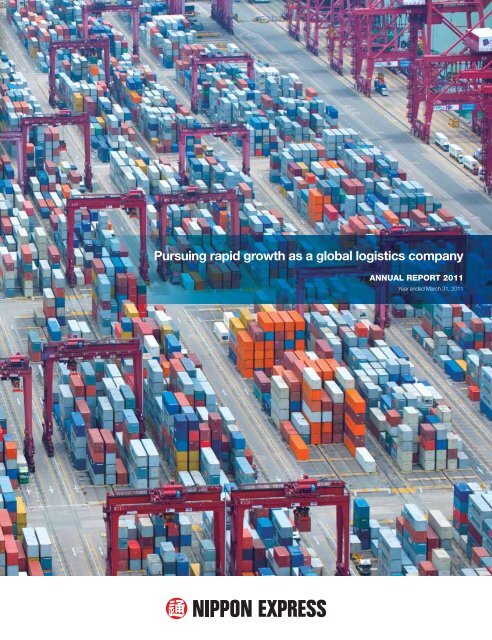
Pursuing rapid growth as a global logistics company<br />
ANNUAL REPORT <strong>2011</strong><br />
Year ended March 31, <strong>2011</strong>
A global growth strategy with<br />
Contents<br />
2 The Nippon Express Group—<br />
At a Glance<br />
4 An Interview with the President<br />
10 Corporate Governance<br />
12 Directors, Officers &<br />
Corporate Auditors<br />
13 Corporate Social Responsibility<br />
14 Special Feature<br />
18 Financial Section<br />
65 Global Network<br />
68 Company Information<br />
69 Share Information<br />
In this fi scal report, fi scal years are indicated according to the date of their commencement.<br />
Thus, fi scal 2010 is the year ended March 31, <strong>2011</strong>.<br />
Caution Regarding Forward-Looking Statements<br />
This annual report contains information about forward-looking<br />
statements related to such matters as the Company’s plans, strategies,<br />
and business results. These forward-looking statements represent<br />
judgements made by the Company based on information available at<br />
present and are inherently subject to a variety of risks and uncertainties.<br />
The Company’s actual activities and business results could differ<br />
signifi cantly due to changes, including changes in the economic<br />
environment, business environment, demand, and exchange rates.
The Nippon Express Group will continue to fully utilize its global<br />
network reach and optimal transportation modes to develop systems<br />
as a general logistics corporation that tailors its services to meet<br />
customer needs. The Group commenced its three-year mediumterm<br />
management plan, “Nippon Express Group Corporate Strategy<br />
2012 – Towards New Growth,” on April 1, 2010. This plan focuses<br />
on four basic strategies, comprising two foundations for growth—<br />
“Growth as a Global Logistics Company” and “Promotion of Strategic<br />
Environmental Management”—and measures to achieve these<br />
foundations—“Enhancement of Management Infrastructure” and<br />
“Promotion of Corporate Social Responsibility (CSR) Management.”<br />
Aiming for new growth, we are striving to speed up management<br />
and steadily achieve the goals of this plan through the<br />
implementation of a revamped management structure in June <strong>2011</strong>.<br />
1
The Nippon Express Group—At a Glance<br />
Business Overview<br />
Revenues by industry segment up to the end of fiscal 2009<br />
(Millions of yen)<br />
2,000,000 1,866,267<br />
1,500,000<br />
1,000,000<br />
500,000<br />
1,901,433<br />
1,828,946<br />
1,569,633<br />
0 07/3 08/3 09/3 10/3<br />
Other<br />
Goods Sales<br />
Distribution &<br />
Transportation<br />
Revenues by reportable segment from fiscal 2010 onward<br />
(Millions of yen)<br />
1,800,000<br />
1,600,000<br />
1,400,000<br />
1,200,000<br />
1,000,000<br />
800,000<br />
600,000<br />
400,000<br />
200,000<br />
0<br />
1,569,633 1,617,185<br />
10/3 11/3<br />
Distribution & Transportation<br />
Domestic Companies<br />
Combined Business<br />
Security Transportation<br />
Heavy Haulage & Construction<br />
Air Freight Forwarding & Travel<br />
Marine & Harbor Transportation<br />
Overseas Companies<br />
The Americas<br />
Europe<br />
Asia & Oceania*<br />
East Asia<br />
South Asia & Oceania<br />
Goods Sales<br />
Other<br />
Fiscal 2010 overview by segment<br />
Distribution and<br />
Transportation<br />
Domestic companies<br />
Revenues<br />
(Millions of yen)<br />
Combined Business 717,439<br />
Main products and services<br />
Railway utilization transportation, chartered truck services, combined delivery<br />
services, moving & relocation, warehousing & distribution processing,<br />
in-factory work, real estate rental, marine & harbor transportation, fi ne arts<br />
transportation, security transportation and heavy haulage & construction<br />
Main line of business<br />
Railway forwarding, motor cargo transportation, warehousing<br />
and in-factory work<br />
Security Transportation 59,542 Security transportation Security guard business, motor cargo transportation<br />
Heavy Haulage & Construction 34,356 Heavy haulage & construction Heavy haulage and construction<br />
Air Freight Forwarding & Travel 203,408 Air freight forwarding and travel Air freight forwarding and travel<br />
Marine & Harbor Transportation 124,216<br />
Overseas companies<br />
The Americas 42,806<br />
Europe 45,069<br />
East Asia 76,955<br />
South Asia & Oceania 45,564<br />
Goods Sales 352,507 Lease, sale of petroleum and others<br />
Other 35,980 Other<br />
Adjustment (120,662)<br />
Total 1,617,185<br />
Marine & harbor transportation, warehousing & distribution processing and<br />
moving & relocation<br />
Air freight forwarding, marine & harbor transportation, warehousing &<br />
distribution processing, moving & relocation, motor transportation and travel<br />
Air freight forwarding, marine & harbor transportation, warehousing &<br />
distribution processing, moving & relocation, motor transportation and travel<br />
Air freight forwarding, marine & harbor transportation, warehousing &<br />
distribution processing, moving & relocation, motor transportation and travel<br />
Air freight forwarding, marine & harbor transportation, warehousing & distribution<br />
processing, moving & relocation, heavy haulage & construction and travel<br />
Marine transportation, harbor transportation and warehousing<br />
Air freight forwarding, harbor transportation, warehousing,<br />
motor cargo transportation and travel<br />
Sales and leasing of distribution equipment, wrapping and<br />
packing materials, vehicles, petroleum and LP gas, etc., vehicle<br />
maintenance services and insurance sales<br />
Mediation, planning and designing and management of real<br />
estate, investigation and research, money lending, automobile<br />
operation instruction and employee dispatching<br />
* Nippon Express underwent an organizational change in fi scal 2010. Consequently, for overseas companies, Asia & Oceania has been divided into East Asia and South Asia & Oceania. As it is<br />
not possible to restate the fi scal 2009 results under the new reportable segments, such results are presented here in accordance with the previous segment designations.<br />
Strengths and Characteristics<br />
• One-stop comprehensive logistics company<br />
• International network<br />
• Leader in the Japanese logistics industry<br />
• Expansion of value-added businesses<br />
2
Overview by Region<br />
Composition ratio by region comprising Distribution &<br />
Transportation, overseas companies<br />
South Asia &<br />
Oceania<br />
22%<br />
The Americas<br />
20%<br />
Fiscal 2010<br />
East Asia<br />
37%<br />
Europe<br />
21%<br />
Business Bases<br />
(as of June 30, <strong>2011</strong>)<br />
Excluding Japan<br />
Europe<br />
15 companies, 2 representative offices,<br />
65 business bases and<br />
East Asia<br />
21 companies, 3 representative offices,<br />
126 business bases and 5,745 employees<br />
China<br />
The Americas<br />
2,226 employees 18 companies, 1 representative offices,<br />
101 business bases and<br />
5,375 employees<br />
12 companies,<br />
91 business bases and<br />
1,942 employees<br />
South Asia & Oceania<br />
20 companies, 2 representative offices,<br />
106 business bases and<br />
6,021 employees<br />
Worldwide total<br />
68 companies, 7 representative<br />
offices, 388 business bases and<br />
15,934 employees<br />
Warehousing Scale<br />
East Asia<br />
Europe<br />
The Americas<br />
358,190m 2 452,931m 2 401,391m 2<br />
South Asia &<br />
Oceania<br />
391,461m 2<br />
Worldwide total<br />
1,603,973m 2<br />
3
4<br />
An Interview with the President
Increasing our presence as a global<br />
logistics company<br />
I assumed the role of president of Nippon Express Co., Ltd. in June <strong>2011</strong>. Since then, I have focused my<br />
energy on business activities that will achieve Nippon Express’s growth as a global logistics company<br />
and, in turn, bring the Nippon Express Corporate Strategy 2012 to a successful conclusion. At the same<br />
time, I have a renewed sense of the importance of the social mission Nippon Express undertakes<br />
through logistics activities that support the lifestyles of people everywhere.<br />
July <strong>2011</strong><br />
Kenji Watanabe<br />
President, Chief Executive Offi cer<br />
Q1<br />
Please tell us your intentions upon becoming president.<br />
To begin, I would like to take this opportunity to extend our deepest sympathies for all those affected by the Great<br />
East Japan Earthquake. Although many of our facilities sustained heavy damage, we were able to meet customer<br />
needs and resume full operations thanks to the concerted efforts made by all the members of the Nippon Express<br />
Group. At the same time, the Group provided emergency deliveries of relief supplies immediately following the<br />
disaster in accordance with its designation by the Japanese government as a public institution in times of<br />
emergency. It is our sincerest wish for the earliest possible recovery of all stricken areas. Accordingly, the entire<br />
Nippon Express Group will do its utmost to further this end.<br />
The indispensable role that logistics play in people’s lives was reaffi rmed by Nippon Express’s delivery of<br />
emergency supplies in accordance with its designation as a public institution under the Disaster Measures Basic<br />
Law. In this way, I believe that Nippon Express is meeting its social responsibilities as a logistics company.<br />
Although there have been calls for a concrete evaluation of logistics activities within the logistics industry, I believe<br />
that social recognition of the role that logistics plays as a lifeline should be increased. For this reason, I am<br />
committed to doing my utmost to ensure that Nippon Express serves as a driving force for social development<br />
through its business activities.<br />
Over its long history, the Group has received the unwavering support of its numerous stakeholders, including<br />
shareholders, customers, partners and employees. Accordingly, I am fully aware of the heavy responsibility I bear<br />
with regard to the direction in which I will take the Company in order to achieve sustainable growth.<br />
5
Q2<br />
What is your impression of current market conditions?<br />
We estimate that the domestic logistics volume will decrease 4% in fi scal <strong>2011</strong>, making it the 12th consecutive<br />
year of decline. In Japan, we are facing a gradual decrease in logistics volume and continued fi erce competition.<br />
This situation is largely being caused by a shrinking population coupled with the relocation of manufacturing<br />
facilities overseas amid severe competition spurred on by structural changes taking place throughout the logistics<br />
industry.<br />
Turning to the global economy, we are seeing a slight rebound from the overall stagnation that began<br />
following the Lehman Shock. With harsh economic conditions persisting in North America and Europe,<br />
I believe that it is necessary to make a more comprehensive assessment of logistics-related business<br />
opportunities in Asia, South America and other rapidly growing emerging economies.<br />
Q3<br />
What is your assessment of Nippon Express’s performance in fiscal 2010 and what impact did<br />
the Great East Japan Earthquake have on results?<br />
Consolidated revenues in fi scal 2010 rose to ¥1,617.1 billion, up 3.0% compared with the previous fi scal year.<br />
This was due to an improvement in overseas revenues on the back of an overall recovery in overseas economies<br />
and growth taking place in emerging markets. These factors offset decreased revenues in Japan caused by a<br />
decline in domestic transport-related demand and the impact of the disaster between late March and April, a very<br />
competitive time of year for the moving and relocation business. However, operating income fell 15.7% year on<br />
year to ¥31.6 billion, a very unfortunate result indeed. This was mainly attributable to cost reductions being<br />
outstripped by decreasing revenues in Combined Business as well as revisions in freight-out lagging behind rises<br />
in air freight forwarding-related costs. Net income in fi scal 2010 declined 32.0% year on year to ¥8.5 billion<br />
following the adoption of the accounting standard for asset retirement obligations and the recording of a loss on<br />
disaster. The direct impact of the earthquake on results was a ¥4.8 billion consolidated extraordinary loss mainly<br />
due to damage to facilities and vehicles.<br />
In addition, Nippon Express changed its reportable segments in fi scal 2010.<br />
Q4<br />
What impact do you think the Great East Japan Earthquake is having and will have on future<br />
operations?<br />
In light of delayed recovery efforts, the nuclear accident and subsequent energy supply problems, the impact of<br />
the disaster on the Nippon Express Group and the logistics industry as a whole remains unclear. Against this<br />
6
ackdrop, many companies are rebuilding<br />
their supply chains by, for example, revamping<br />
their production and logistics bases to<br />
compensate for disruptions in this area.<br />
Consequently, the future holds the possibility<br />
of major reforms in the structure of the<br />
Japanese industrial sector. The scenario most<br />
often envisioned is that companies will<br />
accelerate efforts to relocate production and<br />
other facilities overseas.<br />
Starting with its entry into the U.S. market<br />
in 1962, the Nippon Express Group has<br />
developed a global network that is fully capable<br />
of responding to the necessity of shifting logistics operations overseas. We must also convert market changes into<br />
opportunities while keeping a close eye on government policy in Japan and shifts in industry sectors.<br />
Q5<br />
What are the management issues the Nippon Express Group is now facing?<br />
First, we are working to increase the profi tability of our core domestic businesses. In particular, I believe that it<br />
is necessary to reassess the location of our facilities, which are spread throughout Japan, in order to improve<br />
earnings in Combined Business. We will step up efforts to eliminate and consolidate business locations that<br />
have become extraneous since the merger of our small-parcel delivery business with Japan Post Service Co.,<br />
Ltd. in July 2010; promote operational effi ciency; and focus on shrinking costs related mainly to vehicle<br />
chartering and subcontracting.<br />
At the same time, we will concentrate on developing global services and products that transcend barriers<br />
between domestic and overseas markets. In light of the increasing use of logistics outsourcing, we will<br />
establish a one-stop sales structure that addresses the urgent tasks of strengthening logistics-related<br />
marketing and rapidly improving profi tability. Consequently, Nippon Express will bolster marketing centered on<br />
its third-party logistics (3PL) business.<br />
Regarding overseas businesses, we will further promote networks that focus on emerging markets. The<br />
Group has been expanding its operations alongside Japanese companies since their entry into overseas<br />
markets nearly 50 years ago. Owing to the effective use of a comprehensive global system that ensures<br />
consistent departures and arrivals, no competitor can come close to matching Nippon Express’s success.<br />
Looking ahead, we will utilize our platforms and related expertise to facilitate the horizontal development of<br />
logistics in third countries, targeting global businesses in Europe and North America as well as local<br />
companies. We will also move ahead with new business development based on a sales system that augments<br />
our ability to make proposals and fi nd new solutions.<br />
7
Q6<br />
What are your performance forecasts for fiscal <strong>2011</strong>?<br />
Nippon Express is undertaking business<br />
activities on the premise that the operating<br />
environment will remain severe because of<br />
persistent uncertainty surrounding customer<br />
companies’ efforts to repair disaster-related<br />
damage, the progress of restoration initiatives,<br />
and the impact of energy supply problems on<br />
the Japanese economy.<br />
In the fi rst half of fi scal <strong>2011</strong>, the<br />
environment in which the domestic transport<br />
industry operates is expected to remain harsh<br />
given the large shadow that the disaster has<br />
cast over the Japanese economy. However, it<br />
is widely expected that restoration-related demand will lead to a rebound in domestic logistics volume in the<br />
second half. Despite this forecasted upswing, such factors have not been incorporated into our performance<br />
forecasts since it is unclear when restoration-related demand will pick up.<br />
Major forecasts for fi scal <strong>2011</strong> regarding domestic companies include a decrease in revenues and a rise in<br />
earnings in the Combined Business segment as well as higher sales and income in the Air Freight Forwarding & Travel<br />
segment thanks to a revision in freight forwarding rates. Turning to overseas companies, increases in revenues and<br />
income are anticipated to be driven by continual economic growth in the East Asia and South Asia & Oceania<br />
segments. Profi t ratios for the East Asia and South Asia & Oceania segments are expected to remain somewhat low<br />
compared with those for the Americas and Europe segments. This is attributable to high air freight forwarding costs<br />
and forward-looking investments (including capital spending and personnel placement) being undertaken in the East<br />
Asia and South Asia & Oceania segments in order to establish a foundation for the future.<br />
Based on the aforementioned factors, on May 20, <strong>2011</strong>, Nippon Express announced the following forecasts<br />
for fi scal <strong>2011</strong>: consolidated revenues of ¥1,620.0 billion, up 0.2% year on year; operating income of ¥35.0<br />
billion, up 10.7%; and net income of ¥21.0 billion, up 145.9%.<br />
Q7<br />
Please provide a status report concerning Nippon Express Group Corporate Strategy 2012, which<br />
began in April 2010, as well as any changes being made in light of the Company’s new leadership.<br />
We will continue to do our utmost to achieve the targets set out in the Nippon Express Group Corporate Strategy<br />
2012. Whether or not new measures or partial revisions to existing items are required due to the Great East Japan<br />
Earthquake will take a little more time to determine. Any decisions in this area will be made based on an<br />
assessment of changes in market conditions.<br />
Regarding “growth as a global logistics company”—the management plan’s fi rst key strategy, which has<br />
8
established the long-term goal of increasing the proportion of sales from overseas-related businesses to 50%—<br />
we are working to reach 33% in fi scal 2012. Given that the proportion of such sales grew from 27.0% in fi scal<br />
2009 to 30.9% in fi scal 2010, I believe that we will make steady progress toward this goal.<br />
As the proportion of sales from overseas-related businesses increases, it will become essential for Nippon<br />
Express to augment its bases and business foundations in key regions and provide services that accurately meet<br />
the needs of customers related to procurement, production and sales. Furthermore, due to the pressing need to<br />
expand our business domains overseas, we will aggressively undertake M&A with companies expected to<br />
complement our business operations.<br />
Q8<br />
What are the major issues regarding the key Asian region and what are your thoughts about<br />
other regions?<br />
An issue we face in Asia involves how to establish logistical operations in the interior of China. It is necessary to<br />
further augment networks connecting Japan and inland China in order to serve the numerous locations throughout<br />
Asia where Japanese companies operate.<br />
In addition, Nippon Express is planning to expand its operations into Africa, a region that shows future promise.<br />
Q9<br />
Another key strategy of Nippon Express Group Corporate Strategy 2012 is the “Promotion of<br />
Strategic Environmental Management.” Please tell us more about this initiative.<br />
As a logistics company that consumes a signifi cant amount of fossil fuels, activities that encourage the<br />
development of a recycling-based society have been an important issue for some time. Having established a very<br />
good reputation as the fi rst logistics company to provide environmentally friendly services, Nippon Express is<br />
actively developing Asian and other overseas markets in this area. Moreover, interest in environmental problems in<br />
Japan is on the rise and expected to gain momentum in the coming years. Specifi cally, I believe that such interest<br />
will translate into signifi cant business opportunities in the Heavy Haulage & Construction segment in connection<br />
with the transport and installation of wind power generators.<br />
Q10<br />
In closing, do you have any messages you would like to convey to shareholders and investors?<br />
Despite becoming president under such severe operating conditions, I will do my utmost to meet the<br />
expectations of all stakeholders by accurately seizing growth opportunities based on our management plan while<br />
striving to improve corporate value. Positioning it as one of our most important management priorities, we will<br />
focus on ensuring stable dividends while enhancing shareholder returns.<br />
We gratefully look forward to the continuing support of our shareholders and investors.<br />
Interview July <strong>2011</strong><br />
9
Corporate Governance<br />
Our Thinking on Corporate Governance<br />
Nippon Express’ fundamental thinking related with corporate<br />
governance is “the realization of speedy management through<br />
quick decision making” and “the establishment of a clear<br />
division of responsibility.” Specifi cally, since June 2001 the<br />
number of the board members was reduced from 25<br />
members or less to 15 members or less. Furthermore, the<br />
term was shortened from two years to one year. All this<br />
resulted in revitalizing the board and speeded up decision<br />
making. Attempts were made to clarify each directors’<br />
management responsibilities for each business year.<br />
At the same time, the Company has introduced a board<br />
of executive offi cers with the goal of ensuring rapid execution<br />
of operations. As of March 31, <strong>2011</strong>, we had 14 directors<br />
and 29 executive offi cers (13 of who also acted as directors).<br />
In addition, our auditors attend board meetings and other<br />
important conferences, review key documents, visit our main<br />
facilities for audits, perform reviews at subsidiaries, and report<br />
all results at meetings of the board of auditors and the board<br />
of directors. The board of auditors functions as a supervisory<br />
institution that operates from an objective point of view. As of<br />
March 31, <strong>2011</strong>, we had four auditors (three of who were<br />
outside auditors).<br />
Creating a Internal Control System<br />
In order to conduct business fairly and effi ciently, it is<br />
important to implement fi rm internal control systems. Nippon<br />
Express has created effective control system, including a<br />
compliance system, a risk management system, an internal<br />
audit system and a system to assure fair business operations<br />
in all Group companies. In addition, with the enactment of the<br />
Corporate Law in May 2006, Nippon Express adopted and<br />
instituted the Basic Policy Relating to the Establishment of an<br />
Internal Control System at a board of directors meeting.<br />
In accordance with a partial revision of the Securities<br />
Listing Regulations at the Tokyo Stock Exchange, the Basic<br />
Policy for the Exclusion of Antisocial Forces was adopted and<br />
instituted at the Board of Directors meeting in April 2008,<br />
providing a response to the need for a regulation to prevent<br />
the intervention of antisocial forces in our corporate activities.<br />
Creating a Crisis Management System<br />
Nippon Express has created a crisis management system<br />
based on the Crisis Management Code, the Natural Disaster<br />
Management Code and the Management Code for New<br />
Strains of Infl uenza. Steps are also being taken against<br />
widespread disaster and new strains of infl uenza, risks to<br />
information systems and terror-related risks.<br />
As a designated public agency under the Basic Act on<br />
Disaster Control Measures, Nippon Express provides<br />
emergency transportation in accordance with requests from<br />
the national and prefectural governments for large-scale<br />
earthquake disasters such as the Hanshin-Awaji (Kobe)<br />
Corporate Governance Organization Chart<br />
General Shareholders’ Meeting<br />
Appointment and Removal<br />
Appointment and Removal<br />
Appointment and Removal<br />
Accounting Auditor<br />
Findings<br />
<strong>Report</strong><br />
Board of Auditors<br />
Audit<br />
Board of Directors<br />
Audit of Accounts<br />
<strong>Report</strong><br />
President<br />
Appointment<br />
Supervision<br />
<strong>Report</strong><br />
Corporate Attorney<br />
Compliance Committee<br />
Board of Executive Officers<br />
Crisis Management Committee<br />
Audit Division<br />
Audit<br />
Perform Operations<br />
Audit<br />
Enforcement Division<br />
(Headquarters divisions, Headquarters departments,<br />
regional administration (domestic/overseas),<br />
each business division, each branch office, each group company)<br />
10
Earthquake and the Niigata Prefecture Chuetsu-oki<br />
Earthquake (For more details regarding the Great East Japan<br />
Earthquake, please refer to Responding to the Great East<br />
Japan Earthquake below).<br />
Concerning natural disasters, the Nippon Express Group<br />
Disaster Measures Regulations were adopted in October<br />
2001, through which we are strengthening our cooperative<br />
effort within the Group. Our <strong>Report</strong>ing Procedures for<br />
Disasters establishes criteria for determining whether a report<br />
is required when a disaster occurs (for example, in the case<br />
of an earthquake registering four or above on the Japanese<br />
seismic scale). Utilizing the Disaster Management System<br />
established on our intranet, these reporting procedures<br />
provide an early-warning reporting system between all<br />
branches and headquarters regarding the state of disasters,<br />
as well as a system for sharing information between<br />
branches.<br />
Moreover, to enable us to respond to power failures or<br />
disruptions in mobile phone or other telephone networks, we<br />
have introduced satellite phones and installed them in related<br />
divisions at headquarters and major branches.<br />
Finally, as a counter-measure against infl uenza, we have<br />
made progress in increasing our stock of emergency hygienic<br />
items, such as masks, gloves and goggles. In response to the<br />
new strain of infl uenza that emerged in April 2009, we<br />
provided staff with masks and took measures to force<br />
infected staff or staff whose family had been infected to stay<br />
home from work.<br />
About Business Continuity (BCP)<br />
Continuity Management) as well as a BCP (Business<br />
Continuity Plan) specifi cally for Nippon Express in 2009.<br />
Compliance Management Promotion System<br />
Stressing the importance of compliance management,<br />
Nippon Express established the Compliance Division in June<br />
2003. Also, in October of the same year, Compliance<br />
Regulations were created, and, along with the establishment<br />
of a Compliance Committee chaired by the company<br />
president and an internal whistle-blower system (Nittsu<br />
Speak-up), several measures were undertaken to encourage<br />
honest and fair company activities.<br />
Personal Data Protection and Management System<br />
Along with the establishment of the Personal Data Protection<br />
Division in February 2005, Nippon Express also established<br />
the Personal Data Protection Policy and Personal Data<br />
Protection Code – exemplifying Nippon Express’s<br />
commitment to personal data protection management.<br />
Ongoing education utilizing DVDs and e-learning is offered to<br />
all employees in an attempt to make information about<br />
personal data protection better known within the company.<br />
The Nippon Express Group has also received various<br />
certifi cations related to the protection of personal data.<br />
Responding to the Great East Japan Earthquake<br />
—Shipping Emergency Relief Supplies and Other<br />
Provisions (As of March 31, <strong>2011</strong>)<br />
In addition to the risk posed by the occurrence of natural<br />
disasters such as large earthquakes and typhoons, we are<br />
also now facing a reemerging threat from the spread of new<br />
strains of infl uenza.<br />
Even if some of these risks are only temporary, society<br />
demands that we take necessary measures and make plans<br />
for both preparation and action so that we are able to recover<br />
quickly and fulfi ll our primary obligations as a transportation<br />
company.<br />
As a designated public agency under the Disaster<br />
Measures Basic Law, Nippon Express has been providing<br />
support when natural disasters occur.<br />
In recent years, we have received a large number of<br />
requests asking us to develop comprehensive and systematic<br />
initiatives as a company capable of continuing its business in<br />
not only times of emergency, but in other challenging<br />
situations as well. In response, we developed BCM (Business<br />
On March 11, <strong>2011</strong>, at 2:46 pm JST, a magnitude 9.0<br />
earthquake struck the Sanriku coastline in Japan’s Tohoku<br />
region. The earthquake shook an expansive area, extending<br />
south from Tohoku to the entire Tokyo/Kanto region, while<br />
unleashing a destructive tsunami which hit Japan’s northeast<br />
Pacifi c coastline minutes after the earthquake.<br />
Although Nippon Express Group centers located along<br />
the coast suffered extensive earthquake and tsunami<br />
damage, Nippon Express quickly established a Disaster<br />
Response Headquarters at its corporate base in Tokyo for<br />
immediate response to the unprecedented Great East Japan<br />
Earthquake, with emergency transport of relief goods.<br />
11
Directors, Officers & Corporate Auditors<br />
(As of June 29, <strong>2011</strong>)<br />
Chairman<br />
President,<br />
Chief Executive Officer<br />
Executive Vice Presidents,<br />
Executive Officers<br />
Jiro Nakamura<br />
Keiji Hagio<br />
Masanori Kawai<br />
Kenji Watanabe<br />
Directors, Managing Officers<br />
Masao Hosokoshi Youichirou Tsuri Minoru Miida Sakae Uematsu Masatoshi Nakano<br />
Directors, Managing Officers<br />
Directors, Officers<br />
Akira Ohinata Noboru Shibusawa Kiyofumi Miyachika Takahiro Ideno Yasuaki Nii<br />
Managing Officers<br />
Officers<br />
Corporate Auditors (Full-Time)<br />
Corporate Auditor<br />
Kenryo Senda<br />
Mitsuru Saito<br />
Takaaki Ishii<br />
Shinichi Miyazaki<br />
Yuzuru Fujita*<br />
Yoshiaki Ishii<br />
Takumi Shimauchi<br />
Hideaki Tabuchi<br />
Zenjiro Watanabe*<br />
Kenichiro Nanri<br />
Takashi Wada<br />
Yukinori Tsuji<br />
Masami Yamashita*<br />
Shuji Kojima<br />
Hideo Hanaoka<br />
Hisao Taketsu<br />
*Outside auditor<br />
Kagehiro Kajihara<br />
Nobuki Ando<br />
Shigeru Uchida<br />
Masahito Watanabe<br />
12
Corporate Social Responsibility<br />
Fundamental CSR Philosophy<br />
Since the establishment of the Nippon Express Group, we<br />
have expanded our business both in Japan and overseas,<br />
contributing to the development of industries and improvement<br />
in quality of life by delivering goods all over the world.<br />
As a company that uses public infrastructure such as<br />
roads, rails, and seaports for its business, we are aware of<br />
our responsibility towards society at both the local and global<br />
levels. It is very important for us to have high ethical<br />
standards beyond compliance with the law, and to act in a<br />
socially responsible way.<br />
Thus, recognizing our social responsibility, we have set<br />
the key strategies in the Nippon Express Group Corporate<br />
Strategy 2012 as “Growth as a Global Logistics Company,”<br />
“Promotion of Strategic Environmental Management,”<br />
“Enhancement of Management Infrastructure,” and<br />
“Promotion of Corporate Social Responsibility (CSR)<br />
Management,” and we will strive to implement them. The<br />
Nippon Express Group will continuously contribute to society<br />
through logistics and do our utmost to live up to its trust.<br />
Revisions to the Nippon Express Group Charter of Conduct<br />
Following the publication of ISO26000 (international<br />
standards regarding social responsibility) in November 2010,<br />
the Nippon Express Group took similar action, based on<br />
recent changes related to corporate social responsibility<br />
(CSR), and revised the Nippon Express Charter of Conduct<br />
(April <strong>2011</strong>). The original Nippon Express Charter of Conduct,<br />
applicable only to Nippon Express Co., was revised as the<br />
Nippon Express Group Charter of Conduct, and now<br />
embraces all Group affi liates in Japan and overseas.<br />
While clearly stipulating respect for human rights,<br />
interactive communication with myriad stakeholders, the<br />
respect for employee diversity essential to business<br />
globalisation and other initiatives, the Nippon Express Group<br />
Charter of Conduct also promotes conduct exceeding CSR<br />
requirements throughout the supply chain in a manner the<br />
Group is well positioned to implement.<br />
In 2009, Nippon Express was handed down a cease<br />
and desist order and a surcharge payment order from the Fair<br />
Trade Commission regarding violation of the unfair restraint of<br />
trade regulations. Since then, we have sequentially<br />
implemented various preventative measures, such as creating<br />
and distributing a manual on compliance with the<br />
Antimonopoly Act, The Antimonopoly Act Handbook, and<br />
educating employees via e-learning to ensure their<br />
understanding of the laws concerning business activities.<br />
The Nippon Express Group has further strengthened its<br />
compliance management to abide by the competition laws of<br />
foreign countries as well as the Antimonopoly ACT, “carrying<br />
out appropriate business transactions within competition that<br />
is fair, transparent and open,” as clearly stated in the revised<br />
Nippon Express Group Charter of Conduct.<br />
* Refer to the Nippon Express Homepage to view the Nippon Express<br />
Group Charter of Conduct.<br />
http://www.nipponexpress.com/hq/corporate/charter/<br />
index.html<br />
Environmental Initiatives<br />
Environmental Charter<br />
In April 2010, Nippon Express revised the Environmental<br />
Charter, which it fi rst established in May 2001. The new<br />
revisions signal a step up from preservation-focused<br />
environmental management to strategic environmental<br />
management and set goals in correspondence to changes to<br />
the contents of environmental initiatives demanded of<br />
companies.<br />
Modal Shift<br />
Modal shift in freight transport means switching from transport<br />
mostly by trucks to transport utilizing railways and ships. In<br />
keeping with the objective of the Green Logistics Partnership<br />
Conference, the Nippon Express Group promotes collaboration<br />
and cooperation between sender companies and freight<br />
companies, and in FY2010 successfully implemented<br />
numerous modal shift initiatives, switching from a truck-centred<br />
from of transport to one that makes much use of railways and<br />
ships. The Nippon Express Group is also expanding modal<br />
shift activities overseas as well as within Japan.<br />
Rail transport represents the most environment-friendly and<br />
energy-efficient transportation mode.<br />
13
Special Feature: Domestic Topics<br />
Below is a report of some of the Nippon Express Group’s activities in Japan.<br />
The Group’s main domestic business operations are railway forwarding, motor<br />
cargo transportation, marine & harbor transportation, air freight forwarding,<br />
warehousing, security transportation and heavy haulage & construction. The<br />
Group also engages in sales operations related to logistics equipment and<br />
packaging materials mainly through Nittsu Shoji Co., Ltd.<br />
Sapporo<br />
Domestic Network<br />
(As of March 31, <strong>2011</strong>)<br />
Nippon Express has locations<br />
nationwide, including 64<br />
management branches, 175<br />
branches, 147 sales branches,<br />
sub-branches and other offices.<br />
Hiroshima<br />
Osaka<br />
Nagoya<br />
Gunma<br />
Yokohama<br />
Sendai<br />
Tokyo (Chuo-ku, Tokyo)<br />
Tokyo Air Service (Minato-ku, Tokyo)<br />
Tokyo Travel (Minato-ku, Tokyo)<br />
Tokyo International Transport<br />
(Shinagawa-ku, Tokyo)<br />
Kanto Security Transport<br />
(Koto-ku, Tokyo)<br />
Fukuoka<br />
Shikoku<br />
(Takamatsu-shi)<br />
Major Management Branches<br />
May 2010<br />
June<br />
Construction Completed of the Human<br />
Resource Development Facility, Nippon<br />
Express Training & Education Center<br />
(NEX-TEC) Shibaura<br />
NEX-TEC Shibaura was completed as one of<br />
the campuses of Nittsu Group University,<br />
which was launched in April 2010 with the<br />
aim of developing logistics professionals with<br />
specialized knowledge, personnel able to<br />
work on the global stage and the next<br />
generation of leaders. Boasting full-fl edged<br />
training facilities complete with<br />
accommodations, the aim of NEX-TEC is to<br />
enhance the value of the entire Group by<br />
encouraging exchanges that go beyond<br />
divisions and Group companies.<br />
Establishment of the Joint Venture,<br />
NEXDG Co., Ltd.<br />
Nippon Express has established NEXDG in a<br />
joint venture with Digital Garage, Inc. to<br />
provide fulfi llment support to mail order<br />
business operators who use e-commerce.<br />
Through its ASP services,* NEXDG offers a<br />
system that enables the centralized<br />
management of a series of fulfi llment<br />
services, from setting up an e-commerce<br />
web shop to providing support in attracting<br />
customers, settlement, inventory<br />
management and delivery arrangements.<br />
*ASP (Application Service Provider) Service:<br />
services that furnish customers with business-use<br />
applications via the Internet.<br />
Commencement of Single-person<br />
Pack X Services, a New Type of<br />
Moving Package<br />
Nippon Express has commenced sales of<br />
Single-person Pack X, a new movingpackage<br />
product using two-ton railway<br />
containers. Unlike previous small movingpackage<br />
products, large household items<br />
can be loaded on this product. Single-person<br />
Pack X is an inexpensive and environmentally<br />
friendly moving service that utilizes rail<br />
transport.<br />
14
September<br />
Establishment of Naoetsu CFS in Joetsu,<br />
Niigata Prefecture<br />
Nippon Express established Naoetsu CFS<br />
(container freight station) at Niigata<br />
Prefecture’s Naoetsu Port, which functions<br />
as an international port on the Sea of Japan.<br />
Naoetsu CFS serves as a domestic freight<br />
reception site for Nippon Express’s regular<br />
consolidated marine transport services on<br />
Tokyo Bay and Yokohama Bay. Accumulated<br />
freight is forwarded to Tokyo Bay or<br />
Yokohama Bay via our domestic network.<br />
From there, accumulated freight is<br />
transported to various regions worldwide by<br />
Arrow International, which offers international<br />
multi modal transportation services. Looking<br />
ahead, we will expand consolidated marine<br />
transport services worldwide and improve<br />
customer convenience by promoting the<br />
upgrading of regional CFSs.<br />
October<br />
Launch of Carbon Offset Initiatives<br />
Using Paper Collecting Boxes<br />
Nippon Express has developed an offi ce-based<br />
paper collecting box system that facilitates the<br />
recycling and disposal of confi dential<br />
documents. The Company began offsetting the<br />
CO 2 emitted during the transport of paper<br />
collecting boxes on October 1, 2010, by utilizing<br />
CO 2 emission rights obtained by Mitsubishi UFJ<br />
Lease & Finance (project type: wind power<br />
generation project in state of Karnataka, India).<br />
In March <strong>2011</strong>, we completed sales of paper<br />
collecting boxes owing to favorable reviews.<br />
Through this initiative, we are helping to offset<br />
CO 2 emissions.<br />
Construction of Eco-Friendly Mercedes<br />
Benz Logistics Center<br />
Nippon Express completed the Mercedes Benz<br />
Logistics Center in Narashino City, Chiba<br />
Prefecture, which will form the core of Mercedes<br />
Benz Japan’s parts storage and delivery<br />
operations. Solar panels installed on the roof<br />
generate a third of the electricity used by the<br />
center. The Mercedes Benz Logistics Center<br />
provides high-quality, comprehensive logistics<br />
services while contributing to the reduction of<br />
the Company’s environmental burden.<br />
November February <strong>2011</strong><br />
Commencement of Forwarder Charter<br />
Service Utilizing Haneda Airport’s Late<br />
Night Slots<br />
Nippon Express has commenced forwarder<br />
charter* fl ights to Hong Kong taking<br />
advantage of Haneda Airport’s late-night<br />
slots. Such fl ights are made possible through<br />
the easing of regulations for cargo charter<br />
fl ights in line with the further<br />
internationalization of Haneda Airport.<br />
*Forwarder charter:<br />
A forwarder is a cargo operator with no independent<br />
means of air transport that charters cargo space on<br />
aircraft.<br />
Launch of New Overseas Moving<br />
Service Products for China<br />
Nippon Express has launched the China<br />
Tanshinfunin Plan (CTP) and Shanghai<br />
Kantanbin (simple package) as new products<br />
in its China-related moving services for single<br />
people. The CTP reduces complications<br />
caused by customs procedures (which has<br />
been an issue for cities in China’s interior)<br />
and, in turn, decreases cargo delivery times.<br />
The Shanghai Kantanbin is a new product<br />
that provides convenience for customers<br />
moving to Shanghai owing to its<br />
comprehensive range of services and<br />
simplifi ed storage cases (which are also<br />
suitable for ordinary household use).<br />
Commencement of Refrigerated Marine<br />
LCL Services in Asia<br />
Nippon Express began offering refrigerated<br />
marine less than container load (LCL)<br />
services using reefer containers (refrigerated<br />
chilled/frozen freight containers) shipped<br />
from CFSs in Tokyo, Nagoya and Kobe to<br />
Asia. We have developed a unique operating<br />
structure that offers uniform reefer freight<br />
transport from departure to arrival. In<br />
addition, by using Orient Overseas Container<br />
Line (OOCL) ’s reefer services, Nippon<br />
Express can provide reefer LCL services to<br />
Hong Kong as well as reefer (frozen) service<br />
to Singapore and Bangkok (from Tokyo and<br />
Kobe only). Consequently, we are reducing<br />
transport costs for customers while realizing<br />
high-quality refrigerated freight forwarding<br />
services.<br />
15
Special Feature: Overseas Topics<br />
The Nippon Express Group encompasses 388 business bases in 210 cities across 36 countries worldwide (as of June 30,<br />
<strong>2011</strong>). Based on “Nippon Express Group Corporate Strategy 2012 – Towards New Growth,” we aim to grow as a global<br />
logistics company. Specifically, Nippon Express is focusing on securing competitive superiority in Asian markets and<br />
expanding its businesses in emerging countries.<br />
In May 2010, Nippon Express divides Asia & Oceania into East Asia and South Asia & Oceania, which are overseen<br />
by regional general offices in Shanghai and Singapore, respectively. This organizational restructuring has enabled us to<br />
improve the speed and accuracy of management decisions related to business issues that are unique to each region.<br />
Furthermore, through this restructuring, the Group maintains global coverage through five regions, namely, Japan, the<br />
Americas, Europe, East Asia and South Asia & Oceania.<br />
In May <strong>2011</strong>, Nippon Express relocated the regional general office for East Asia from Hong Kong to Shanghai in line<br />
with the growing importance of logistics activities within China and to facilitate more rapid management decision making.<br />
Europe<br />
Germany, Austria, Belgium, Czech<br />
Republic, France, Hungary, Ireland,<br />
Italy, Luxemburg, the Netherlands,<br />
Poland, Portugal, Russia, South Africa,<br />
Spain, Switzerland, Turkey,<br />
UAE, the United Kingdom<br />
Establishment of the AEO Network<br />
across 13 European Countries<br />
Nippon Express’s European subsidiaries<br />
have made efforts to acquire EU certifi cation<br />
as Authorized Economic Operators (AEOs)<br />
since the fi rst AEO certifi cation was obtained<br />
in the Netherlands in May 2008. The process<br />
of acquiring AEO certifi cation was completed<br />
by 13 of our European subsidiaries in June<br />
2010. Qualifi cation as Authorized Economic<br />
Operators, Full (AEOF) entitles Nippon<br />
Express to simplifi ed customs clearance<br />
procedures and preferential treatment in<br />
terms of both security and safety. Obtaining<br />
such certifi cations demonstrates the regard<br />
that key European countries have for the<br />
quality of the Nippon Express Group’s<br />
customs clearance operations and security.<br />
Establishment of a Local<br />
Corporation in Turkey<br />
In Turkey, Nippon Express established the<br />
local corporation Nippon Express (Istanbul)<br />
Global Logistics A.S., which commenced<br />
operations in November 2010. In addition to<br />
its advantageous location as the bridge<br />
between Europe and Asia, Turkey has seen<br />
heightened expectations in recent years as<br />
an emerging consumer market after China<br />
and India. Turkey is home to many Japanese<br />
automobile and home appliance production<br />
bases and is attracting the attention of other<br />
sectors seeking to establish production<br />
bases in the region. Nippon Express is<br />
developing air and marine cargo transport<br />
services serving former Soviet Bloc, East<br />
European and other countries, utilizing<br />
Turkey as a hub—the Black Sea Route<br />
Service transporting cargo to southern<br />
Russia via the Black Sea—and creating<br />
consolidated truck transport service products<br />
linking Europe and Turkey.<br />
South Asia &<br />
Oceania<br />
Singapore, Australia, Bangladesh, India,<br />
Indonesia, Malaysia, New Zealand,<br />
the Philippines, Thailand, Vietnam<br />
Establishment of Representative Office<br />
in Bangladesh<br />
In August 2010, the Dhaka representative<br />
Offi ce was established in Bangladesh, which<br />
has been in the spotlight recently as a new<br />
investment destination, particularly with<br />
regard to the textile industry and in light of<br />
rapid growth in the production and sale of<br />
automobiles, household appliances and daily<br />
necessities. In February <strong>2011</strong>, we launched<br />
“NEX-FORWARDING Bengal SAT!” an<br />
intermodal transport service that combines<br />
air and marine transport in Bangladesh.<br />
Consequently, Nippon Express has<br />
constructed a system that meets a wide<br />
range of needs, from international air freight<br />
forwarding and international marine transport<br />
to domestic truck transport, warehousing<br />
and moving services. We will continue to<br />
support various corporate activities that are<br />
expanding in Bangladesh.<br />
16
Completion of a Multifunctional<br />
Logistics Warehouse in Rajasthan,<br />
India<br />
Nippon Express (India) Private Limited<br />
completed construction on the<br />
multifunctional logistics warehouse,<br />
Neemrana Logistics Center, in November<br />
2010 with an eye to bolstering its operations<br />
in India. The center is located in the state of<br />
Rajasthan’s Neemrana Industrial Zone, which<br />
is exclusively used by Japanese companies.<br />
In addition, the center boasts a state-of-theart<br />
security system as well as multiple<br />
functions designed to effectively store<br />
precision equipment and medical devices.<br />
The center is able to meet the needs for milkrun<br />
transport and JIT distribution while<br />
featuring cross-docking functions.<br />
Conclusion of a Strategic Partnership<br />
Letter of Intent with the Largest Shipping<br />
Company on China’s Yangtze River<br />
In June 2010, Nippon Express (China) Co.,<br />
Ltd. concluded a strategic partnership letter of<br />
intent with Minsheng Logistics Co., Ltd., a<br />
member of the Minsheng Shipping Group,<br />
headquartered in Chongqing. This strategic<br />
partnership will enable Nippon Express to offer<br />
Yangtze River waterborne transport products<br />
and such logistics services as just-in-time (JIT)<br />
and vendor-managed inventory (VMI).<br />
The Americas<br />
The United States, Brazil, Canada, Mexico<br />
East Asia<br />
China, South Korea, Taiwan<br />
Development of International Transport<br />
Product That Utilizes the 31-Ft Railway<br />
Container “Ecoliner”<br />
Nippon Express has developed a product<br />
that enables integrated transport between<br />
Japan and East China. This product allows<br />
us to load the Ecoliner 31-ft railway wing<br />
container (which is widely used in Japan) on<br />
to the high-speed, roll-on, roll-off (RORO)<br />
cargo ship, Shanghai Super Express, which<br />
operates between Hakata, Japan and<br />
Shanghai. The Ecoliner’s loading volume is<br />
almost identical to that of the 10-ton wing<br />
trucks commonly used in domestic transport.<br />
In addition, the Ecoliner makes determining<br />
shipping freight size easy while playing a role<br />
in promoting a modal shift in logistics.<br />
Establishment of a New Location in<br />
China’s Major Automotive Industry<br />
Center<br />
Nippon Express (South China) Co., Ltd.<br />
opened its Zhengzhou branch in Zhengzhou<br />
City, Henan Province, in December 2010.<br />
Nippon Express (South China) is poised to<br />
offer Super-Supply Chain Management<br />
(S-SCM) high-quality production procurement<br />
logistics—the culmination of expertise<br />
cultivated since its founding—through the<br />
Zhengzhou Multi Logistics Center. We are<br />
enhancing the JIT delivery of automotive<br />
parts, the need for which is increasing in the<br />
Zhengzhou area.<br />
Enhancement of Efforts to Meet Logistics<br />
Needs along the U.S.-Mexico Border<br />
In February <strong>2011</strong>, NEX Global Logistics de<br />
Mexico, S.A. de C.V. opened a new sales<br />
offi ce in a suburb of Aguascalientes, Mexico,<br />
a city that has been enjoying rapid growth as<br />
a new re-export processing base where<br />
many Japanese automotive and other<br />
manufacturers have set up operations. The<br />
opening of the new offi ce will enable the<br />
creation of in-house, door-to-door bonded<br />
transport services utilizing the IMMEX*<br />
system. In addition, the new offi ce will<br />
provide high-quality services for bonded<br />
logistics that require more complex<br />
management by utilizing REWARDS, Nippon<br />
Express’s global inventory control system.<br />
* Mexico’s IMMEX program is an instrument to<br />
temporarily import goods and services that will be<br />
manufactured, and then re-exported without payment<br />
of taxes and other specifi c benefi ts. IMMEX consists<br />
of numerous programs, including Industrial IMMEX and<br />
Service IMMEX. Service IMMEX-certifi ed companies<br />
are able to provide transport and warehouse storage<br />
services for raw materials and parts.<br />
17
Financial Section<br />
19 Management Discussion and Analysis<br />
24 11-Year Summary<br />
26 (1) Consolidated Financial Statements<br />
26 Consolidated Balance Sheets<br />
28 Consolidated Statements of Operations<br />
29 Consolidated Statements of Comprehensive Income<br />
30 Consolidated Statements of Changes in Net Assets<br />
31 Consolidated Statements of Cash Flows<br />
32 Notes to Consolidated Financial Statement<br />
63 (2) Other<br />
64 <strong>Report</strong> of Independent Auditors<br />
18
Management Discussion and Analysis<br />
Corporate Overview<br />
The Nippon Express Group consists of Nippon Express Co., Ltd. and<br />
its 275 subsidiaries, including 250 consolidated subsidiaries and 1<br />
equity-method subsidiary, as well as 62 affi liates, of which 20 are<br />
equity-method affi liates, totaling 338 companies. In Japan, the<br />
Group’s Distribution & Transportation segment encompasses<br />
domestic companies primarily operating in the following reportable<br />
segments: the Combined Business (motor cargo transportation,<br />
railway forwarding), Air Freight Forwarding & Travel and Marine &<br />
Harbor Transportation. The Distribution & Transportation segment also<br />
operates companies overseas. The Group’s remaining reportable<br />
segments comprise Goods Sales-related businesses as well as real<br />
estate and other operations that are classifi ed as Other.<br />
The Nippon Express Group’s business operations by industry<br />
and reportable segment are as follows.<br />
Distribution & Transportation, domestic companies<br />
231 companies, including Nippon Express Co., Ltd. and Nippon Truck<br />
Co., Ltd.<br />
Combined Business<br />
With a network of facilities throughout Japan, the Company engages in<br />
businesses related to railway forwarding, motor cargo transportation<br />
services and warehousing operations. A portion of these businesses are<br />
undertaken by the Company’s subsidiaries and affi liates, including Nippon<br />
Truck,* Bingo Express Co., Ltd., and Tokushima Express Co., Ltd..<br />
* Nippon Truck changed its name to Nittsu Transport Co., Ltd. on June 1, <strong>2011</strong>.<br />
Security Transportation<br />
The Company operates security guard and related businesses<br />
throughout Japan.<br />
Heavy Haulage & Construction<br />
In this segment, the Company handles the transportation, erection<br />
and installation of heavy cargo and pursues related businesses<br />
throughout Japan.<br />
Air Freight Forwarding & Travel<br />
The Company operates the air freight forwarding, travel and other<br />
related businesses. A portion of these businesses are operated by the<br />
Company’s subsidiaries and affi liates.<br />
Marine & Harbor Transportation<br />
The Company engages in marine and harbor transportation at all key<br />
domestic ports. The Company’s subsidiaries, including Nippon<br />
Shipping Co., Ltd., and affi liates undertake marine transportation and<br />
coastal shipping, while the Company’s subsidiaries and affi liates<br />
operate the harbor transportation business at certain ports in Japan.<br />
Distribution & Transportation, overseas companies<br />
62 companies, including Nippon Express U.S.A., Inc.<br />
The Americas<br />
Nippon Express U.S.A. and other subsidiaries engage in air freight<br />
forwarding, marine and harbor transportation, and warehousing<br />
businesses in various cities in the Americas. In addition, Nippon<br />
Express Travel USA, Inc. operates a travel business.<br />
Europe<br />
Nippon Express (U.K.) Ltd., Nippon Express (Nederland) B.V., Nippon<br />
Express (Deutschland) GmbH, Nippon Express France, S.A. and other<br />
subsidiaries engage in air freight forwarding, marine and harbor<br />
transportation, and warehousing businesses in various cities in<br />
Europe.<br />
East Asia<br />
Nippon Express (H.K.) Co., Ltd., Nippon Express (China) Co., Ltd.,<br />
Nippon Express (Taiwan) Co., Ltd. and other subsidiaries and affi liates<br />
engage in air freight forwarding, marine and harbor transportation, and<br />
warehousing businesses in various cities in East Asia.<br />
South Asia & Oceania<br />
Nippon Express (Singapore) Pte., Ltd., Nippon Express (Thailand) Co.,<br />
Ltd., Nippon Express (Australia) Pty., Ltd. and other subsidiaries and<br />
affi liates engage in air freight forwarding, marine and harbor<br />
transportation, warehousing, and heavy haulage and construction<br />
businesses in various cities in South Asia and Oceania.<br />
Goods Sales<br />
32 companies, including Nittsu Shoji Co., Ltd.<br />
Nittsu Shoji, Taiyo Nissan Auto Sales., Ltd., Nittsu Shoji U.S.A., Inc.<br />
and other domestic and overseas subsidiaries and affi liates engage in<br />
the sale and leasing of distribution equipment, sale of wrapping and<br />
packaging materials, sale and leasing of vehicles, sale of petroleum and<br />
liquefi ed petroleum (LP) gas; vehicle maintenance; and insurance sales.<br />
Other<br />
12 companies, including Nittsu Real Estate Co., Ltd.<br />
Nittsu Real Estate and other subsidiaries and affi liates mainly engage<br />
in real estate rentals, mediation and appraisals as well as building and<br />
warehouse planning, design and management. In addition, this<br />
business segment conducts investigation and research through Nittsu<br />
Research Institute and Consulting, Inc., offers fi nancing through<br />
Nippon Express Capital Co., Ltd., provides driver training courses for<br />
the general public through Nittsu Driving School Co., Ltd. and<br />
operates an employee dispatching business through Careerroad Inc.<br />
Performance Overview<br />
Business Environment and Activities during the Period<br />
During the consolidated fi scal year under review, the Japanese<br />
economy continued to experience a moderate turnaround in<br />
corporate earnings on the back of a recovery in the overseas<br />
economy. However, overall conditions remained uncertain, affected by<br />
19
persistent concerns regarding an economic downturn caused<br />
primarily by a slowdown in exports due to the appreciation of the yen,<br />
a fl agging employment situation and the waning effectiveness of<br />
economic policy packages implemented both at home and abroad.<br />
Furthermore, the Great East Japan Earthquake, which struck on<br />
March 11, <strong>2011</strong>, had a devastating effect on the country’s economy,<br />
adding signifi cantly to the uncertainty about its future direction.<br />
In the fi eld of logistics, given the diffi cult economic environment,<br />
demand for international freight transportation, especially with regard to<br />
exports to such Asian countries as China and other emerging<br />
economies, grew solidly over the course of the year. In contrast,<br />
demand for domestic freight transportation remained stagnant, with<br />
total freight handling volume decreasing and a disruption of distribution<br />
systems in the Tohoku region following the earthquake.<br />
In this tough business environment, the Nippon Express Group<br />
made collective efforts to achieve four basic strategies comprising two<br />
aimed at establishing the foundations for growth, namely, “Growth as a<br />
Global Logistics Company” and “Promotion of Strategic Environmental<br />
Management,” and two intended to help secure these foundations,<br />
namely, “Enhancement of Management Infrastructure” and “Promotion<br />
of Corporate Social Responsibility (CSR) Management.” The strategies<br />
are based on “Nippon Express Group Corporate Strategy 2012 –<br />
Towards New Growth,” a three-year medium-term management plan<br />
that commenced on April 1, 2010.<br />
Specifi cally, to ensure “Growth as a Global Logistics Company,”<br />
the Group has embarked on organizational reform designed to<br />
develop its overseas-related businesses in the fast growing Asian<br />
market while initiating projects with such targets as expanding the<br />
solution business, strengthening the function of global business bases<br />
and broadening the overseas transportation network with the aim of<br />
ensure the Group’s ability to swiftly and positively respond to<br />
increasingly sophisticated global business needs. With regard to the<br />
“Promotion of Strategic Environmental Management,” the Group has<br />
been actively expanding environmental businesses and supporting the<br />
nurture and dissemination of environmental awareness by offering its<br />
environmentally friendly logistics products, promoting a modal shift for<br />
increased effi ciency and implementing resource-saving measures with<br />
regard to packing materials.<br />
Toward the “Enhancement of Management Infrastructure” and<br />
“Promotion of Corporate Social Responsibility (CSR) Management,”<br />
the Group has begun reviewing its in-house educational promotion<br />
system with the intention of enhancing its competitiveness both within<br />
the global market and in highly advanced specialist fi elds.<br />
Furthermore, the Group is pursuing various initiatives geared toward<br />
the achievement of sustainable growth, such as the promotion of<br />
social contribution activities.<br />
The Great East Japan Earthquake caused substantial damage<br />
to a number of Nippon Express Group facilities. Nevertheless, the<br />
Group has engaged proactively in collective efforts to respond to<br />
customer requirements and resume operation at stricken offi ces. In<br />
parallel with this, the Group is fulfi lling its emergency transporter role,<br />
in accordance with its designation by the government as a public<br />
institution in the event of natural disaster, by utilizing its entire<br />
transportation network to deliver relief supplies.<br />
Business Results<br />
Revenues and Operating Costs<br />
As a result of the above, consolidated revenues increased ¥47.5 billion,<br />
or 3.0%, compared with the previous fi scal year, to ¥1,617.1 billion.<br />
Financial results by segment are as follows:<br />
In Distribution & Transportation, domestic companies, Combined<br />
Business revenues fell ¥33.5 billion, or 4.5%, while those of Security<br />
Transportation shrank ¥1.3 billion, or 2.2%, and Heavy Haulage &<br />
Construction saw a ¥4.9 billion, or 12.6% decrease. The declines<br />
were primarily attributable to a fall in demand for freight transportation<br />
and the impact of the Great East Japan Earthquake. By Contrast, Air<br />
Freight Forwarding & Travel recorded a ¥19.5 billion, or 10.6%,<br />
increase and Marine & Harbor Transportation was up ¥13.4 billion, or<br />
12.2%, owing largely to the recovery of the world economy and an<br />
increase in export and import cargoes.<br />
Revenues<br />
(Millions of yen)<br />
Operating income<br />
(Millions of yen)<br />
Net income<br />
(Millions of yen)<br />
2,000,000<br />
60,000<br />
40,000<br />
1,500,000<br />
50,000<br />
40,000<br />
30,000<br />
1,000,000<br />
30,000<br />
20,000<br />
500,000<br />
20,000<br />
10,000<br />
10,000<br />
0<br />
07/3 08/3 09/3 10/3 11/3<br />
0<br />
07/3 08/3 09/3 10/3 11/3<br />
0<br />
07/3 08/3 09/3 10/3 11/3<br />
20
In Distribution & Transportation, overseas companies, revenues<br />
rose ¥5.0 billion, or 13.5%, in the Americas, ¥0.3 billion, or 0.8%, in<br />
Europe and ¥28.6 billion, or 30.6%, in Asia & Oceania. This was<br />
mainly attributable to an increase in freight imports and exports on the<br />
back of a recovery in the global economy.<br />
In the Goods Sales segment, revenues improved ¥29.8 billion,<br />
or 9.2%, due to an upswing in packaging material related sales and<br />
services following growth in export cargo. In the Other Business<br />
segment, revenues improved ¥3.6 billion, or 11.2%.<br />
Operating costs came to ¥1,510.5 billion, an increase of ¥52.7<br />
billion, or 3.6%, from the previous fi scal year. Gross profi t declined by<br />
¥5.1 billion, or 4.6%, year on year to ¥106.5 billion and the ratio of<br />
gross profi ts to revenues was 0.5 of a percentage point lower at 6.6%.<br />
The rise in operating costs was mainly attributable to higher forwarding<br />
costs in line with increases in international air freight forwarding in<br />
Japan and Asia.<br />
Selling, General and Administrative Expenses, Operating<br />
Income and Ordinary Income<br />
Selling, general and administrative expenses edged up by ¥0.7 billion,<br />
or 1.0%, to ¥74.9 billion year on year, mainly due to rises in<br />
employment costs along with depreciation and amortization.<br />
As a result of the above, operating income stood at ¥31.6 billion,<br />
down ¥5.9 billion, or 15.7%, from the previous fi scal year. Ordinary<br />
income stood at ¥40.6 billion, up 2.9 billion, or 7.8%, due in part to a<br />
fall in equity in losses of affi liates.<br />
Other Income and Expenses and Net Income<br />
Extraordinary income was ¥5.5 billion, an increase of ¥0.1 billion, or<br />
3.6%, compared with the previous fi scal year, with extraordinary loss<br />
rising ¥5.9 billion, or 33.9%, to ¥23.2 billion. The main reason for the<br />
increase in extraordinary income was the recording of a gain on sales<br />
of noncurrent assets of ¥3.6 billion. The primary reasons for the rise in<br />
extraordinary loss was the recording of a loss on adjustment for<br />
changes of accounting standard for asset retirement obligations of<br />
¥7.5 billion and a loss on disaster of ¥4.8 billion due to damage<br />
caused by the Great East Japan Earthquake.<br />
Income before income taxes and minority interests amounted to<br />
¥22.9 billion. After deducting current income taxes, inhabitants’ tax,<br />
enterprise tax and other adjustments as well as minority interests, net<br />
income came to ¥8.5 billion, a decline of ¥4.0 billion, or 32.0%, from<br />
the previous fi scal year.<br />
Net income per share was ¥3.86 lower year on year at ¥8.19,<br />
while the return on equity ratio edged down 0.8 percentage point to<br />
1.8%.<br />
Results by <strong>Report</strong>able Segment<br />
Financial results by reportable segment are summarized below.<br />
1. Combined Business (Distribution & Transportation, domestic<br />
companies)<br />
This segment suffered a decline in transactions due to a fall in demand<br />
for domestic freight transportation. The situation deteriorated, with a<br />
sharp decline in the volume of moving & relocation business during the<br />
seasonal peak demand period in the wake of the Great East Japan<br />
Earthquake. As a result, segment sales decreased ¥33.5 billion, or<br />
4.5%, year on year to ¥717.4 billion, while operating income was ¥8.3<br />
billion, down ¥6.3 billion, or 43.1%.<br />
2. Security Transportation (Distribution & Transportation, domestic<br />
companies)<br />
As a result of a decline in demand for domestic freight transportation<br />
and decreases in the unit prices of services as well as other factors,<br />
segment sales were ¥59.5 billion, a year-on-year decrease of ¥1.3<br />
billion, or 2.2%, and operating income was ¥1.8 billion, a decrease of<br />
¥1.8 billion, or 50.6%.<br />
3. Heavy Haulage & Construction (Distribution & Transportation,<br />
domestic companies)<br />
Due to a decline in demand for the construction of wind power, plant<br />
and other facilities, segment sales came to ¥34.3 billion, a ¥4.9 billion,<br />
or 12.6%, decrease on a year-on-year basis, while operating income<br />
dropped ¥1.5 billion, or 36.7%, to ¥2.6 billion.<br />
Total net assets<br />
(Millions of yen)<br />
Total assets<br />
(Millions of yen)<br />
Net cash provided<br />
by operating activities<br />
(Millions of yen)<br />
600,000<br />
1,500,000<br />
150,000<br />
500,000<br />
1,200,000<br />
120,000<br />
400,000<br />
300,000<br />
200,000<br />
100,000<br />
900,000<br />
600,000<br />
300,000<br />
90,000<br />
60,000<br />
30,000<br />
0<br />
07/3 08/3 09/3 10/3 11/3<br />
0<br />
07/3 08/3 09/3 10/3 11/3<br />
0<br />
07/3 08/3 09/3 10/3<br />
11/3<br />
21
4. Air Freight Forwarding & Travel (Distribution & Transportation,<br />
domestic companies)<br />
Mainly due to an increase in export and import cargoes, helped by the<br />
recovery of the world economy, segment sales were ¥203.4 billion, an<br />
increase of ¥19.5 billion, or 10.6%, year on year, but operating income<br />
was ¥0.9 billion, a decrease of ¥1.6 billion, or 63.9%.<br />
9. South Asia & Oceania (Distribution & Transportation, overseas<br />
companies)<br />
The transaction volume with regard to air transportation expanded,<br />
particularly in services for electronics parts manufacturers, helped by<br />
the recovery of the world economy. Thanks chiefl y to this, segment<br />
sales were ¥45.5 billion and operating income was ¥1.3 billion.<br />
5. Marine & Harbor Transportation (Distribution & Transportation,<br />
domestic companies)<br />
Mainly due to an increase in export and import cargoes, helped by the<br />
recovery of the world economy, segment sales were ¥124.2 billion, an<br />
increase of ¥13.4 billion, or 12.2%, year on year, and operating<br />
income was ¥5.4 billion, an increase of ¥2.0 billion, or 62.6%.<br />
6. The Americas (Distribution & Transportation, overseas companies)<br />
Both air and marine & harbor transportation showed steady<br />
performances, helped by the recovery of the world economy, with air<br />
freight export cargoes of such items as automotive-related and<br />
electronics goods marking notable increases. Thanks chiefl y to this,<br />
segment sales rose ¥5.0 billion, or 13.5%, year on year to ¥42.8 billion<br />
and operating income soared ¥1.3 billion to ¥1.5 billion.<br />
7. Europe (Distribution & Transportation, overseas companies)<br />
As a result of increases in exports of automotive-related cargoes and<br />
imports of home-appliance parts, materials and products as well as<br />
other positive trends driven by recovery in the world economy,<br />
segment sales increased ¥0.3 billion, or 0.8%, year on year to ¥45.0<br />
billion, while operating income increased ¥1.3 billion to ¥1.7 billion.<br />
8. East Asia (Distribution & Transportation, overseas companies)<br />
Solid results were seen not only in the transport of home-appliance<br />
parts, materials and products to Europe and the United States, but in<br />
the freight of overall goods to Asian destinations, thanks to the<br />
recovery of the world economy. Refl ecting such trends, segment sales<br />
came to ¥76.9 billion and operating income came to ¥2.0 billion.<br />
10. Goods Sales<br />
Mainly thanks to an increase in packaging service transactions along<br />
with an increase in export-related cargo, segment sales climbed ¥29.8<br />
billion, or 9.2%, year on year to ¥352.5 billion. Similarly, operating<br />
income rose ¥1.2 billion, or 20.8%, to ¥7.0 billion.<br />
11. Other<br />
Mainly thanks to the solid performance of the logistic fi nance business,<br />
segment sales increased ¥3.6 billion, or 11.2%, year on year to ¥35.9<br />
billion, while operating income edged up ¥0.06 billion, or 4.3%, to<br />
¥1.5 billion.<br />
Cash Flows<br />
Consolidated cash and cash equivalents (“cash”) amounted to ¥107.0<br />
billion as of March 31, <strong>2011</strong>. This represented a year-on-year<br />
decrease of ¥14.1 billion.<br />
Cash Flows from Operating Activities<br />
Cash fl ows from operating activities resulted in a net infl ow of ¥64.3<br />
billion, a decline from ¥82.1 billion recorded in the previous fi scal year.<br />
This was mainly due to income before income taxes and minority<br />
interests of ¥22.9 billion as well as income taxes paid of ¥12.2 billion.<br />
Cash Flows from Investing Activities<br />
Cash fl ows from investing activities resulted in a net outfl ow of ¥48.0<br />
billion, a year-on-year decrease in expenditures from ¥54.3 billion. This<br />
was mainly due to payment for purchase of property and equipment<br />
of ¥58.0 billion, including for distribution centers, warehousing<br />
Cash and cash equivalents at<br />
end of year<br />
(Millions of yen)<br />
Equity per share<br />
(Yen)<br />
Net income per share<br />
(Yen)<br />
200,000<br />
500<br />
35<br />
150,000<br />
100,000<br />
50,000<br />
400<br />
300<br />
200<br />
100<br />
30<br />
25<br />
20<br />
15<br />
10<br />
5<br />
0<br />
07/3 08/3 09/3 10/3<br />
11/3<br />
0<br />
07/3 08/3 09/3 10/3 11/3<br />
0<br />
07/3 08/3 09/3 10/3 11/3<br />
22
upgrades and vehicle acquisitions, as well as proceeds from sale of<br />
property and equipment of ¥8.5 billion.<br />
Cash Flows from Financing Activities<br />
Cash fl ows from fi nancing activities resulted in a net outfl ow of ¥26.2<br />
billion, a year-on-year increase in expenditure from ¥0.6 billion.<br />
Contributing factors leading to this result were a rise in proceeds from<br />
long-term loans payable of ¥101.1 billion, payment of long-term loans<br />
payable of ¥104.8 billion and cash dividends of ¥10.4 billion.<br />
Financial Position<br />
Assets<br />
Total assets as of March 31, <strong>2011</strong> amounted to ¥1,147.5 billion, a<br />
decrease of ¥54.2 billion, or 4.5%, compared with the previous fi scal<br />
year-end.<br />
Current assets decreased ¥31.5 billion, or 6.0%, to ¥490.4<br />
billion mainly due to a fall in cash and cash in banks. Noncurrent<br />
assets declined ¥22.7 billion, or 3.3%, to ¥657.0 billion largely<br />
because of a decrease in investment securities following a drop in<br />
share prices.<br />
Liabilities and Net Assets<br />
Total liabilities amounted to ¥667.6 billion as of March 31, <strong>2011</strong>, a<br />
decrease of ¥38.2 billion, or 5.4%, compared with the previous fi scal<br />
year-end.<br />
Total current liabilities declined by ¥93.8 billion, or 21.6%, to<br />
¥340.4 billion, mainly as a result of a decrease in short-term loans<br />
payable. Total noncurrent liabilities increased ¥55.5 billion, or 20.5%,<br />
to ¥327.2 billion, primarily due to growth in long-term loans payable.<br />
Net assets decreased by ¥15.9 billion, or 3.2%, to ¥479.8 billion<br />
as of March 31, <strong>2011</strong>. The main contributory factors in this decrease<br />
were drops in valuation difference on available-for-sale securities and<br />
foreign currency translation adjustment.<br />
Equity per share amounted to ¥448.29, a decrease of ¥16.09<br />
compared with the position at the previous fi scal year-end. The equity<br />
ratio increased by 0.4 of a percentage point to 40.7%.<br />
Capital Investment<br />
Total capital investment by the Nippon Express Group in fi scal 2010<br />
amounted to ¥56.7 billion. Major items included changes to logistics<br />
systems and the improvement of distribution depots to support<br />
international freight operations. Other investments included the<br />
development of commercial warehouses and the replacement of<br />
vehicles and transportation equipment.<br />
Dividend Policy<br />
The Company regards the return of profi ts to shareholders as one of<br />
its most important priorities. We aim to maximize returns and maintain<br />
dividend stability, while also expanding our business operations,<br />
strengthening our fi nancial position, expanding shareholders’ equity<br />
and improving profi t ratios.<br />
The Company’s basic policy is to pay dividends from retained<br />
earnings twice a year in the form of interim and year-end dividends.<br />
The Board of Directors is responsible for decisions concerning the<br />
interim dividend, while decisions on the year-end dividend are taken at<br />
the General Shareholders’ Meeting held following each fi scal year-end.<br />
At the 105th General Shareholders’ Meeting on June 29, <strong>2011</strong>,<br />
we proposed and received approval to set the year-end dividend for<br />
fi scal 2010 at ¥5 per share. Together with the interim dividend of ¥5,<br />
this brought the annual dividend to ¥10 per share.<br />
The earnings retained within Nippon Express will be used for<br />
investments mainly in the development of logistics bases and the<br />
replacement of vehicles, to expand sales of our distribution and<br />
transportation services and improve our transportation effi ciency. We<br />
will also utilize retained earnings to strengthen our fi nancial position as<br />
well as our corporate foundation.<br />
Net assets to total assets<br />
(%)<br />
Return on equity<br />
(%)<br />
Employees and<br />
Average temporary employees<br />
45<br />
10<br />
80,000<br />
40<br />
35<br />
8<br />
6<br />
4<br />
2<br />
60,000<br />
40,000<br />
20,000<br />
30<br />
07/3 08/3 09/3 10/3 11/3<br />
0<br />
07/3 08/3 09/3 10/3 11/3<br />
0<br />
07/3 08/3 09/3 10/3 11/3<br />
Employees<br />
Average temporary employees<br />
23
11-Year Summary<br />
Nippon Express Co., Ltd and consolidated subsidiaries<br />
For the years ended March 31<br />
Millions of yen<br />
<strong>2011</strong> 2010 2009 2008<br />
For the year: Revenues 1 ¥ 1,617,185 ¥ 1,569,633 ¥ 1,828,946 ¥ 1,901,433<br />
Revenues by industry segment up to the<br />
previous consolidated fi scal year 2<br />
Distribution and Transportation — 1,284,772 1,524,639 1,597,284<br />
Goods Sales — 266,211 291,084 291,923<br />
Other — 18,649 13,222 12,225<br />
Revenues by geographical segment up to<br />
the previous consolidated fi scal year 2<br />
Japan — 1,412,630 1,616,285 1,682,699<br />
The Americas — 29,794 45,447 48,009<br />
Europe — 40,006 62,227 69,146<br />
Asia & Oceania — 87,201 104,986 101,578<br />
Revenues by reportable segment from the<br />
consolidated fi scal year under review onward 2<br />
Distribution & Transportation<br />
Domestic Companies<br />
Combined Business 711,308 745,058 — —<br />
Security Transportation 59,515 60,849 — —<br />
Heavy Haulage & Construction 33,744 38,872 — —<br />
Air Freight Forwarding & Travel 202,099 182,763 — —<br />
Marine & Harbor Transportation 116,059 103,959 — —<br />
Overseas Companies<br />
The Americas 32,898 29,794 — —<br />
Europe 40,309 40,006 — —<br />
East Asia 70,879<br />
3<br />
87,201<br />
South Asia & Oceania 42,878 — —<br />
Goods Sales 287,929 263,066 — —<br />
Other 19,561 18,061 — —<br />
Operating income 31,629 37,535 33,513 48,502<br />
Net income 8,541 12,566 15,172 36,439<br />
At year-end: Total net assets 4 479,898 495,883 484,337 520,823<br />
Total assets 1,147,539 1,201,801 1,172,074 1,297,406<br />
Net cash provided by operating activities 64,394 82,198 64,080 90,096<br />
Cash and cash equivalents at end of year 107,062 121,187 93,031 144,639<br />
Per share: (yen) Equity per share ¥ 448.29 ¥ 464.38 ¥ 454.03 ¥ 489.26<br />
Net income per share 8.19 12.05 14.55 34.94<br />
Ratios: (%) Equity ratio 40.74% 40.29% 40.40% 39.33%<br />
Return on equity 1.80 2.62 3.08 7.16<br />
Other: Employees 66,924 65,916 71,352 69,177<br />
(Average temporary employees) 16,583 19,406 22,801 24,434<br />
1. Revenue fi gures do not include consumption taxes.<br />
2. Effective from the consolidated fi scal year under review, the Company has adopted the “Accounting Standard for Disclosures about Segments of an Enterprise and Related<br />
Information” (ASBJ Statement No. 17 issued on March 27, 2009) and the “Guidance on Accounting Standard for Disclosures about Segments of an Enterprise and Related<br />
Information” (ASBJ Guidance No. 20 issued on March 21, 2008). The above listed revenues by industry, geographical and reportable segments do not include internal sales or<br />
money transfers between segments.<br />
24
Millions of yen<br />
2007 2006 2005 2004 2003 2002 2001<br />
¥ 1,866,267 ¥ 1,793,925 ¥ 1,753,306 ¥ 1,666,945 ¥ 1,676,918 ¥ 1,708,140 ¥ 1,760,687<br />
1,580,546 1,522,325 1,485,266 1,419,156 1,429,489 1,454,133 1,491,528<br />
279,080 266,908 263,216 243,084 242,988 248,898 263,898<br />
6,640 4,690 4,823 4,703 4,440 5,108 5,259<br />
1,666,887 1,631,402 1,605,602 1,556,828 1,566,037 1,590,309 1,652,365<br />
45,126 38,495 33,722 31,297 36,055 45,944 42,520<br />
59,422 49,333 45,525 38,688 37,406 33,997 28,626<br />
94,831 74,693 68,455 40,130 37,419 37,889 37,174<br />
— — — — — — —<br />
— — — — — — —<br />
— — — — — — —<br />
— — — — — — —<br />
— — — — — — —<br />
— — — — — — —<br />
— — — — — — —<br />
— — — — — — —<br />
— — — — — — —<br />
— — — — — — —<br />
50,325 43,187 43,025 46,156 42,802 33,370 35,283<br />
33,208 18,663 32,190 27,263 23,330 21,180 (26,589)<br />
517,516 488,205 444,940 421,128 367,551 375,390 335,730<br />
1,360,694 1,315,599 1,287,351 1,262,383 1,205,103 1,248,205 1,230,342<br />
123,058 63,966 83,139 83,108 48,315 113,752 89,057<br />
170,109 150,615 145,983 138,236 136,149 165,625 140,674<br />
¥ 486.94 ¥ 467.80 ¥ 426.24 ¥ 403.38 ¥ 352.02 ¥ 353.99 ¥ 313.76<br />
31.84 17.71 30.64 25.93 22.08 19.97 (24.78)<br />
37.33% 37.11% 34.56% 33.36% 30.50% 30.07% 27.29%<br />
6.67 4.00 7.43 6.91 6.28 5.96 —<br />
67,773 65,562 65,321 64,699 65,160 66,716 66,219<br />
23,796 24,190 24,400 25,321 25,701 27,263 27,075<br />
3. Nippon Express underwent an organizational change in the consolidated fi scal year under review. Consequently, for Distribution & Transportation, overseas companies, Asia &<br />
Oceania has been divided into East Asia and South Asia & Oceania. As it is not possible to restate the results for the previous consolidated fi scal year under the new reportable<br />
segments, such results are presented here in accordance with the previous segment designations.<br />
4. The calculation of net assets is carried out by applying the Accounting Standards for Description of Net Assets in the Balance Sheet (Accounting Standards Board of Japan,<br />
“Accounting Standards for Business Enterprises, No. 5” dated December 9, 2005) and the Application Guidelines for Accounting Standards and Others for Description of Net<br />
Assets in the Balance Sheet (Accounting Standards Board of Japan, “Application Guideline for Accounting Standards for Business Enterprises, No. 8” dated December 9,<br />
2005) from the year ended March 31, 2007.<br />
25
(1) Consolidated Financial Statements<br />
Consolidated Balance Sheets<br />
Nippon Express Co., Ltd. and consolidated subsidiaries<br />
As of March 31, 2010 and <strong>2011</strong><br />
Thousands of<br />
Millions of yen<br />
U.S. dollars<br />
ASSETS 2010 <strong>2011</strong> <strong>2011</strong><br />
Current assets:<br />
Cash and cash in banks (Note 1) ¥ 129,217 ¥ 113,149 $ 1,360,789<br />
Notes receivable-trade 12,023 11,934 143,532<br />
Accounts receivable-trade 226,907 221,814 2,667,648<br />
Inventories (Note 7) 4,985 4,806 57,806<br />
Advanced money 1,330 2,056 24,735<br />
Prepaid expenses 8,197 7,921 95,271<br />
Deferred tax assets 15,281 12,863 154,700<br />
Lease investment assets (Note 1) 89,978 87,989 1,058,204<br />
Other (Note 6) 35,179 28,990 348,648<br />
Less: allowance for doubtful accounts (1,084) (1,046) (12,587)<br />
Total current assets 522,014 490,481 5,898,750<br />
Noncurrent assets:<br />
Property and equipment<br />
Vehicles 181,553 171,293 2,060,050<br />
Less: accumulated depreciation (157,686) (151,339) (1,820,083)<br />
Vehicles, net 23,867 19,953 239,966<br />
Buildings 522,012 538,495 6,476,195<br />
Less: accumulated depreciation (274,811) (287,429) (3,456,754)<br />
Buildings, net 247,200 251,066 3,019,441<br />
Structures 64,341 64,501 775,723<br />
Less: accumulated depreciation (48,633) (49,383) (593,914)<br />
Structures, net 15,707 15,117 181,809<br />
Machinery 65,055 64,459 775,224<br />
Less: accumulated depreciation (49,883) (50,889) (612,017)<br />
Machinery, net 15,171 13,570 163,206<br />
Tools, furniture and fi xtures 92,565 90,128 1,083,931<br />
Less: accumulated depreciation (69,128) (68,062) (818,554)<br />
Tools, furniture and fi xtures, net 23,437 22,066 265,376<br />
Vessels 16,696 16,870 202,891<br />
Less: accumulated depreciation (11,587) (12,483) (150,129)<br />
Vessels, net 5,109 4,387 52,762<br />
Land 167,448 171,977 2,068,278<br />
Leased assets 5,394 5,146 61,892<br />
Less: accumulated depreciation (1,438) (1,776) (21,364)<br />
Leased assets, net 3,955 3,369 40,527<br />
Construction in progress 5,170 2,631 31,653<br />
Net property and equipment (Notes 1, 2) 507,069 504,140 6,063,021<br />
Intangible assets<br />
Leasehold right 6,742 7,133 85,785<br />
Other 21,539 20,227 243,264<br />
Total intangible assets 28,282 27,360 329,050<br />
Investments and other assets<br />
Investment securities (Notes 1, 3) 104,585 87,795 1,055,866<br />
Long-term loans receivable 1,425 1,335 16,065<br />
Long-term loan to employees 1,655 1,305 15,700<br />
Long-term prepaid expense 3,407 2,976 35,795<br />
Security deposit 14,708 14,250 171,377<br />
Other (Note 3) 20,613 19,813 238,288<br />
Less: allowance for doubtful accounts (1,959) (1,919) (23,081)<br />
Total investments and other assets 144,435 125,557 1,510,012<br />
Total noncurrent assets 679,786 657,058 7,902,084<br />
Total assets ¥1,201,801 ¥1,147,539 $13,800,834<br />
26<br />
The accompanying notes are an integral part of these statements.
Thousands of<br />
Millions of yen<br />
U.S. dollars<br />
LIABILITIES 2010 <strong>2011</strong> <strong>2011</strong><br />
Current liabilities:<br />
Notes payable-trade ¥ 6,687 ¥ 6,991 $ 84,084<br />
Accounts payable-trade (Note 1) 129,002 119,899 1,441,966<br />
Short-term loans payable (Note 1) 111,501 49,925 600,426<br />
Other payables 30,057 24,616 296,050<br />
Income taxes payable 7,680 5,297 63,708<br />
Consumer taxes payable 4,899 4,899 58,920<br />
Unpaid expenses 19,267 17,010 204,578<br />
Advance receipt 10,754 10,140 121,954<br />
Deposits 53,341 40,302 484,698<br />
Deposits from employees 29,932 29,670 356,833<br />
Provision for bonus 19,159 19,139 230,180<br />
Provision for directors’ bonus 154 137 1,651<br />
Allowance for warranty and repair 2 360 4,332<br />
Provision for loss on disaster — 4,035 48,538<br />
Other 11,815 7,980 95,982<br />
Total current liabilities 434,258 340,408 4,093,906<br />
Noncurrent liabilities:<br />
Bonds payable 50,000 50,000 601,322<br />
Long-term loans payable (Note 1) 145,127 199,494 2,399,210<br />
Provision for retirement benefi ts 39,268 37,540 451,484<br />
Provision for directors' retirement benefi ts 417 418 5,030<br />
Provision for special repairment 287 208 2,511<br />
Deferred tax liabilities 21,108 17,510 210,585<br />
Other (Note 1) 15,450 22,060 265,307<br />
Total noncurrent liabilities 271,659 327,232 3,935,453<br />
Total liabilities 705,918 667,641 8,029,359<br />
NET ASSETS<br />
Shareholders’ equity:<br />
Common stock 70,175 70,175 843,960<br />
Additional paid-in capital 26,908 26,908 323,610<br />
Retained earnings 377,675 375,785 4,519,365<br />
Less: treasury stock (11,524) (11,542) (138,813)<br />
Total shareholders’ equity 463,234 461,326 5,548,122<br />
Accumulated other comprehensive income:<br />
Valuation difference on available-for-sale securities 33,248 26,370 317,147<br />
Deferred gains on hedges 12 9 120<br />
Foreign currency translation adjustment (12,241) (20,255) (243,604)<br />
Total accumulated other comprehensive income 21,019 6,125 73,662<br />
Minority interests 11,629 12,446 149,690<br />
Total net assets 495,883 479,898 5,771,475<br />
Total liabilities and net assets ¥1,201,801 ¥1,147,539 $13,800,834<br />
27
Consolidated Statements of Operations<br />
Nippon Express Co., Ltd. and consolidated subsidiaries<br />
For the years ended March 31, 2010 and <strong>2011</strong><br />
Thousands of<br />
Millions of yen<br />
U.S. dollars<br />
20201011 <strong>2011</strong> <strong>2011</strong><br />
Revenues ¥1,569,633 ¥1,617,185 $19,449,013<br />
Operating costs (Note 1) 1,457,865 1,510,590 18,167,051<br />
Gross profit 111,768 106,595 1,281,962<br />
Selling, general and administrative expenses<br />
Salaries, compensation, and welfare expenses 40,699 41,018 493,302<br />
Depreciation and amortization 4,421 4,706 56,597<br />
Advertising expenses 4,042 4,088 49,173<br />
Provision for allowance for doubtful accounts 99 352 4,237<br />
Other 24,969 24,800 298,260<br />
Total selling, general and administrative expenses (Note 1) 74,232 74,965 901,571<br />
Operating income 37,535 31,629 380,391<br />
Non-operating income:<br />
Interest income 507 434 5,221<br />
Dividends income 2,177 2,223 26,743<br />
Gain on sales of vehicles 214 306 3,680<br />
Equity in earnings of affi liates — 541 6,514<br />
Income from foreign exchange 1,724 1,888 22,715<br />
Others 8,714 8,261 99,351<br />
Total non-operating income 13,338 13,655 164,226<br />
Non-operating expenses:<br />
Interest expenses 3,629 3,456 41,564<br />
Loss on sale and retirement of vehicles 271 107 1,295<br />
Equity in losses of affi liates 7,869 — —<br />
Other 1,349 1,032 12,414<br />
Total non-operating expenses 13,120 4,596 55,275<br />
Ordinary income 37,753 40,688 489,342<br />
Extraordinary income:<br />
Gain on sales of noncurrent assets (Note 2) 1,604 5,233 62,934<br />
Gain on sales of investment securities (Note 4) 932 46 553<br />
Gain on change in equity 2,478 — —<br />
Change in profi t for previous term 341 139 1,681<br />
Other 47 179 2,162<br />
Total extraordinary income 5,404 5,598 67,332<br />
Extraordinary loss:<br />
Loss on disposal of noncurrent assets (Note 3) 4,998 4,432 53,307<br />
Loss on sales of investment securities (Note 5) 1,761 47 576<br />
Loss on valuation of investment securities (Note 6) 5,761 5,892 70,863<br />
Impairment loss 464 — —<br />
Promotion expenses for parcel delivery business integration 518 — —<br />
Cost of car painting renewal 3,377 — —<br />
Loss on adjustment for changes of accounting standard for<br />
asset retirement obligations — 7,505 90,264<br />
Change in loss for previous term 6 34 415<br />
Loss on disaster (Note 7) — 4,847 58,296<br />
Other 504 535 6,445<br />
Total extraordinary loss 17,392 23,296 280,168<br />
Income before income taxes and minority interests 25,764 22,991 276,505<br />
Income taxes – current 9,995 9,799 117,851<br />
Income taxes – deferred 2,412 3,576 43,017<br />
Total income taxes etc. 12,407 13,376 160,868<br />
Income before minority interests — 9,615 115,636<br />
Minority interests 790 1,073 12,913<br />
Net income ¥ 12,566 ¥ 8,541 $ 102,723<br />
28<br />
The accompanying notes are an integral part of these statements.
Consolidated Statements of Comprehensive Income<br />
Nippon Express Co., Ltd. and consolidated subsidiaries<br />
For the years ended March 31, 2010 and <strong>2011</strong><br />
Thousands of<br />
Millions of yen<br />
U.S. dollars<br />
<strong>2011</strong> <strong>2011</strong><br />
Income before minority interests ¥ 9,615 $ 115,636<br />
Other comprehensive income:<br />
Valuation difference on available-for-sale securities (6,886) (82,819)<br />
Deferred gains (losses) on hedges (2) (33)<br />
Foreign currency translation adjustment (7,971) (95,867)<br />
Share of other comprehensive income of associates<br />
accounted for using equity method (178) (2,145)<br />
Other comprehensive income (Note 2) (15,038) (180,865)<br />
Comprehensive income (Note 1) (5,423) (65,228)<br />
(Comprehensive income attributable to)<br />
Comprehensive income attributable to owners of the parent (6,353) (76,407)<br />
Comprehensive income attributable to minority interests ¥ 929 $ 11,179<br />
The accompanying notes are an integral part of these statements.<br />
29
Consolidated Statements of Changes in Net Assets<br />
Nippon Express Co., Ltd. and consolidated subsidiaries<br />
For the years ended March 31, 2010 and <strong>2011</strong><br />
Thousands of<br />
Millions of yen U.S. dollars<br />
20201011 <strong>2011</strong> <strong>2011</strong><br />
Shareholders’ equity<br />
Common stock<br />
Balance at beginning of the year ¥ 70,175 ¥ 70,175 $ 843,960<br />
Total changes during the year — — —<br />
Balance at end of the year 70,175 70,175 843,960<br />
Additional paid-in capital<br />
Balance at beginning of the year 26,908 26,908 323,610<br />
Total changes during the year — — —<br />
Balance at end of the year 26,908 26,908 323,610<br />
Retained earnings<br />
Balance at beginning of the year 373,749 377,675 4,542,094<br />
Changes during the year:<br />
Cash dividends (10,428) (10,427) (125,410)<br />
Net income 12,566 8,541 102,723<br />
Decrease in treasury stock (5) (3) (42)<br />
Increase of affi liated company 1,793 — —<br />
Total changes during the year 3,925 (1,889) (22,729)<br />
Balance at end of the year 377,675 375,785 4,519,365<br />
Treasury stock<br />
Balance at beginning of the year (11,507) (11,524) (138,599)<br />
Changes during the year:<br />
Increase in treasury stock (32) (26) (315)<br />
Decrease in treasury stock 15 8 101<br />
Total changes during the year (17) (17) (214)<br />
Balance at end of the year (11,524) (11,542) (138,813)<br />
Total shareholders’ equity<br />
Balance at beginning of the year 459,326 463,234 5,571,065<br />
Changes during the year:<br />
Cash dividends (10,428) (10,427) (125,410)<br />
Net income 12,566 8,541 102,723<br />
Increase in treasury stock (32) (26) (315)<br />
Decrease in treasury stock 9 4 59<br />
Increase of affi liated company 1,793 — —<br />
Total changes during the year 3,907 (1,907) (22,943)<br />
Balance at end of the year ¥463,234 ¥461,326 $5,548,122<br />
Thousands of<br />
Millions of yen U.S. dollars<br />
20201011 <strong>2011</strong> <strong>2011</strong><br />
Accumulated other comprehensive<br />
income<br />
Valuation difference on availablefor-sale<br />
securities<br />
Balance at beginning of the year ¥ 28,271 ¥ 33,248 $ 399,858<br />
Net changes in items other<br />
than shareholders’ equity 4,976 (6,877) (82,710)<br />
Total changes during the year 4,976 (6,877) (82,710)<br />
Balance at end of the year 33,248 26,370 317,147<br />
Deferred gains (losses) on<br />
hedges<br />
Balance at beginning of the year (0) 12 154<br />
Net changes in items other<br />
than shareholders’ equity 12 (2) (34)<br />
Total changes during the year 12 (2) (34)<br />
Balance at end of the year 12 9 120<br />
Foreign currency translation<br />
adjustment<br />
Balance at beginning of the year (14,106) (12,241) (147,219)<br />
Net changes in items other<br />
than shareholders’ equity 1,865 (8,014) (96,385)<br />
Total changes during the year 1,865 (8,014) (96,385)<br />
Balance at end of the year (12,241) (20,255) (243,604)<br />
Total accumulated other<br />
comprehensive income<br />
Balance at beginning of the year 14,164 21,019 252,793<br />
Net changes in items other<br />
than shareholders’ equity 6,855 (14,894) (179,131)<br />
Total changes during the year 6,855 (14,894) (179,131)<br />
Balance at end of the year 20,019 6,125 73,662<br />
Minority interests<br />
Balance at beginning of the year 10,846 11,629 139,864<br />
Net changes in items other<br />
than shareholders’ equity 782 817 9,826<br />
Total changes during the year 782 817 9,826<br />
Balance at end of the year 11,629 12,446 149,690<br />
Total net assets<br />
Balance at beginning of the year 484,337 495,883 5,963,724<br />
Changes during the year:<br />
Cash dividends (10,428) (10,427) (125,410)<br />
Net income 12,566 8,541 102,723<br />
Increase in treasury stock (32) (26) (315)<br />
Decrease in treasury stock 9 4 59<br />
Increase of affi liated company 1,793 — —<br />
Net changes in items other<br />
than shareholders’ equity 7,638 (14,077) (169,305)<br />
Total changes during the year 11,545 (15,985) (192,248)<br />
Balance at end of the year ¥495,883 ¥479,898 $5,771,475<br />
The accompanying notes are an integral part of these statements.<br />
30
Consolidated Statements of Cash Flows<br />
Nippon Express Co., Ltd. and consolidated subsidiaries<br />
For the years ended March 31, 2010 and <strong>2011</strong><br />
Thousands of<br />
Millions of yen<br />
U.S. dollars<br />
20201011 <strong>2011</strong> <strong>2011</strong><br />
Cash flows from operating activities:<br />
Income before income taxes and minority interests ¥ 25,764 ¥ 22,991 $ 276,505<br />
Depreciation and amortization 52,446 52,470 631,034<br />
Impairment loss 464 — —<br />
Expense of consolidation for small-package delivery business 518 — —<br />
Cost of car painting renewal 3,377 — —<br />
Gain on change in equity (2,478) — —<br />
Loss on adjustment for changes of accounting standard for<br />
asset retirement obligations — 7,505 90,264<br />
Loss on disaster — 4,847 58,296<br />
Loss on sale or write-down of securities, net 6,553 5,894 70,885<br />
(Gain) loss on sale or disposal of property and equipment, net 3,488 (998) (12,012)<br />
Increase (decrease) in provision for bonus (186) 54 658<br />
Decrease in provision for retirement benefi ts (5,233) (1,483) (17,844)<br />
Interest and dividend income (2,685) (2,657) (31,965)<br />
Interest expense (Note 2) 3,629 3,456 41,564<br />
Equity in earnings of unconsolidated subsidiaries and affi liates 7,869 (541) (6,514)<br />
(Increase) decrease in trade receivables (753) 2,999 36,075<br />
Decrease in inventories 1,694 162 1,951<br />
Decrease in accounts payable (657) (4,670) (56,172)<br />
Increase (decrease) in consumption taxes etc. payable 1,955 141 1,697<br />
Other (934) (9,017) (108,446)<br />
Sub-total 94,833 81,152 975,980<br />
Interest and dividends received 3,071 2,964 35,646<br />
Interest paid (Note 2) (3,509) (3,604) (43,349)<br />
Cash paid for the shifting to DC (“Defi ned Contribution”) pension plan (3,937) (3,908) (47,005)<br />
Payment for promotional expenses on the combination of<br />
small package delivery business (1,407) — —<br />
Payment of Japan Fair Trade Commission Surcharge (2,495) — —<br />
Payment for changes of vehicles painting design (668) — —<br />
Income taxes paid (3,688) (12,209) (146,839)<br />
Net cash provided by operating activities 82,198 64,394 774,433<br />
Cash flows from investing activities:<br />
Payment for purchase of securities (252) (517) (6,222)<br />
Proceeds from sale of securities 5,310 326 3,927<br />
Payment for purchase of property and equipment (63,673) (58,008) (697,638)<br />
Proceeds from sale of property and equipment 3,906 8,511 102,363<br />
Other 384 1,601 19,262<br />
Net cash used in investing activities (54,325) (48,086) (578,307)<br />
Cash flows from financing activities:<br />
Change in short-term loans payable (14,493) (3,395) (40,834)<br />
Change in commercial paper (4,700) (7,000) (84,185)<br />
Proceeds from long-term loans payable 48,724 101,106 1,215,957<br />
Payment of long-term loans payable (47,427) (104,857) (1,261,068)<br />
Proceeds from issuance of bonds 30,000 — —<br />
Proceeds from stock issuance to minority shareholders 144 99 1,199<br />
Cash dividends (10,428) (10,427) (125,410)<br />
Other (2,468) (1,750) (21,054)<br />
Net cash used in fi nancing activities (648) (26,225) (315,396)<br />
Effect of exchange rate changes on cash 931 (4,207) (50,596)<br />
Net increase in cash and cash equivalents 28,155 (14,124) (169,867)<br />
Cash and cash equivalents at beginning of year 93,031 121,187 1,457,455<br />
Cash and cash equivalents at end of year (Notes 1) ¥121,187 ¥107,062 $1,287,587<br />
The accompanying notes are an integral part of these statements.<br />
31
Notes to Consolidated Financial Statement<br />
Nippon Express Co., Ltd. and consolidated subsidiaries<br />
1. U.S. dollar amounts<br />
The yen amounts are rounded off in millions. Therefore, total or<br />
subtotal amounts do not correspond with the aggregation of such<br />
account balance. U.S. dollar amounts presented in the fi nancial<br />
statements are included solely for convenience. The rate of<br />
¥83.15 to US$1.00, prevailing on March 31, <strong>2011</strong>, has been used<br />
for translation into U.S. dollar amounts in the fi nancial statements.<br />
The U.S. dollar amounts are then rounded off in thousands. The<br />
inclusion of such amounts should not be construed as a<br />
representation that Japanese yen amounts have been or could in<br />
the future be converted into U.S. dollars at that rate.<br />
2. Significant matters serving as a basis for the presentation of consolidated financial statements<br />
2010<br />
(From April 1, 2009 to March 31, 2010)<br />
1. The scope of consolidation<br />
(1) There are 257 consolidated subsidiaries. Names of major<br />
subsidiaries are omitted.<br />
NEX Logistics Europe GmbH is included in the scope of<br />
consolidation from the year ended March 31, 2010 due to<br />
its new establishment.<br />
Three companies including Minato Sagyo were excluded<br />
from the scope of consolidation due to merger with other<br />
consolidated subsidiaries and fi ve companies including<br />
Shinko Maritime were excluded from the scope of<br />
consolidation due to liquidation.<br />
(2) 25 subsidiaries, including Himawari Oil Co., Ltd., other than<br />
above 257 companies are excluded from the scope of<br />
consolidation since the scales of their businesses are small,<br />
and the impact of these companies on the consolidated<br />
fi nancial statements on total assets, net sales, net income<br />
or loss and retained earnings corresponding to the interest<br />
is considered to be immaterial as a whole.<br />
(3) 21 subsidiaries, including Nippon Express Travel U.S.A.,<br />
Inc., sub-consolidated by 10 overseas consolidated<br />
subsidiaries, including Nippon Express U.S.A., Inc., are<br />
included in the scope of the consolidation.<br />
2. Application of the equity-method<br />
(1) Companies to which the equity method is applied:<br />
a. Subsidiary: Awa Godo Tsuun Co., Ltd.<br />
b. Affi liates: 20 affi liates, including Nippon Vopack Co., Ltd.<br />
Effective the year ended March 31, 2010, All Express Co.,<br />
Ltd. was excluded from the scope of affi liates accounted<br />
for by the equity method, since the ownerships of the<br />
Group decreased due to the merger with an external<br />
company. In addition, JP Express Co., Ltd. was included<br />
in the scope of affi liates accounted for by the equity<br />
method in the fi rst quarter ended June 30, 2009 due to<br />
the increased materiality, but eventually excluded from the<br />
scope of affi liates accounted for by the equity method<br />
because certain shares were sold during the third quarter<br />
ended December 31, 2009.<br />
(2) 24 subsidiaries including Himawari Oil Co., Ltd. and 43<br />
affi liates including Nippon Freight Liner Co., Ltd., other than<br />
above 21 companies are excluded from the scope of<br />
subsidiaries or affi liates accounted for by the equity method,<br />
but carried at cost, since the impact of these companies on<br />
the consolidated fi nancial statements on net income or loss<br />
and retained earnings corresponding to the interest is<br />
considered to be immaterial as a whole.<br />
<strong>2011</strong><br />
(From April 1, 2010 to March 31, <strong>2011</strong>)<br />
1. The scope of consolidation<br />
(1) There are 250 consolidated subsidiaries. Names of major<br />
subsidiaries are omitted because they are described in<br />
“Management Discussion and Analysis, Corporate<br />
Overview.”<br />
NEX DG, Inc. and Nippon Express (Istanbul) Global<br />
Logistics A.S. are included in the scope of consolidation<br />
from the year ended March 31, <strong>2011</strong> due to their new<br />
establishment.<br />
Three companies including Nep Distributors System, Inc.<br />
were excluded from the scope of consolidation due to<br />
merger with other consolidated subsidiaries and six<br />
companies including Shibecha Nittsu Yuso were excluded<br />
from the scope of consolidation due to liquidation.<br />
(2) 25 subsidiaries, including Nittsu Energy Kanto, other than<br />
above 250 companies are excluded from the scope of<br />
consolidation since the scales of their businesses are small,<br />
and the impact of these companies on the consolidated<br />
fi nancial statements on total assets, net sales, net income<br />
or loss and retained earnings corresponding to the interest<br />
is considered to be immaterial as a whole.<br />
(3) 18 subsidiaries, including Nippon Express Travel U.S.A.,<br />
Inc., sub-consolidated by 9 overseas consolidated<br />
subsidiaries, including Nippon Express U.S.A., Inc., are<br />
included in the scope of the consolidation.<br />
2. Application of the equity-method<br />
(1) Companies to which the equity method is applied:<br />
a. Subsidiary: Awa Godo Tsuun Co., Ltd.<br />
b. Affi liates: 20 affi liates, including Nippon Vopack Co., Ltd.<br />
(2) 24 subsidiaries including Nittsu Energy Kanto and 42<br />
affi liates including Nippon Freight Liner Co., Ltd., other than<br />
above 21 companies are excluded from the scope of<br />
subsidiaries or affi liates accounted for by the equity method,<br />
but carried at cost, since the impact of these companies on<br />
the consolidated fi nancial statements on net income or loss<br />
and retained earnings corresponding to the interest is<br />
considered to be immaterial as a whole.<br />
32
2010<br />
(From April 1, 2009 to March 31, 2010)<br />
3. Accounting period of consolidated subsidiaries<br />
58 overseas consolidated subsidiaries including Nippon<br />
Express U.S.A., Inc. have the balance sheet date of December<br />
31. In preparing the accompanying consolidated fi nancial<br />
statements, the fi nancial statements as of December 31 and<br />
for the year then ended are used for consolidation after making<br />
necessary adjustments for signifi cant transactions incurred<br />
during the period from January 1 through March 31.<br />
One company and seven companies which are accounted<br />
for by the equity method have the balance sheet dates of<br />
August 31 and December 31, respectively. Signifi cant<br />
transactions between these dates and March 31 are refl ected<br />
in computing the equity earnings attributable to the Group.<br />
4. Significant accounting policies<br />
(1) Evaluation methods for signifi cant assets<br />
a. Securities<br />
Other Securities<br />
• Other securities with market value<br />
Other securities with market value are stated by market<br />
value method based on the market price on the<br />
consolidation date where valuation difference is reported<br />
as a component of shareholders’ equity while cost of<br />
sold securities is stated using the moving average<br />
method.<br />
• Other securities without market value<br />
Other securities without market value are stated at cost<br />
using the moving-average method.<br />
b. Derivatives<br />
By fair value method<br />
c. Inventories<br />
Inventories are stated primarily at the lower of cost<br />
determined by the moving-average method (balance<br />
sheet amount is calculated by the method of inventory<br />
write-down on the basis of the decreased profi tability).<br />
(2) Depreciation methods for signifi cant depreciation assets<br />
a. Property and equipment except for leased assets<br />
Depreciation of property and equipment, except for<br />
buildings, is mainly computed by the declining-balance<br />
method over the applicable useful lives. Buildings are<br />
depreciated by the straight-line method over the<br />
estimated lives. Overseas consolidated subsidiaries<br />
mainly use straight-line method over the estimated lives.<br />
Useful lives of assets are principally as follows:<br />
Vehicles<br />
3 to 7 years<br />
Buildings and structures 3 to 60 years<br />
“Machinery and equipment,”<br />
“Tools, furniture and fi xtures,” 2 to 20 years<br />
and vessels<br />
b. Intangible fi xed assets except for leased assets<br />
Amortization of intangible fi xed assets is computed by the<br />
straight-line method over the estimated useful lives.<br />
Software costs for internal use are amortized using the<br />
straight-line method over the available period (fi ve years).<br />
Overseas consolidated subsidiaries mainly use straightline<br />
method over the estimated lives.<br />
c. Leased assets<br />
Leased assets are stated using the straight-line method<br />
with zero residual value, assuming lease period as service<br />
life.<br />
<strong>2011</strong><br />
(From April 1, 2010 to March 31, <strong>2011</strong>)<br />
3. Accounting period of consolidated subsidiaries<br />
56 overseas consolidated subsidiaries including Nippon<br />
Express U.S.A., Inc. have the balance sheet date of December<br />
31. In preparing the accompanying consolidated fi nancial<br />
statements, the fi nancial statements as of December 31 and<br />
for the year then ended are used for consolidation after making<br />
necessary adjustments for signifi cant transactions incurred<br />
during the period from January 1 through March 31.<br />
One company and seven companies which are accounted<br />
for by the equity method have the balance sheet dates of<br />
August 31 and December 31, respectively. Signifi cant<br />
transactions between these dates and March 31 are refl ected<br />
in computing the equity earnings attributable to the Group.<br />
4. Significant accounting policies<br />
(1) Evaluation methods for signifi cant assets<br />
a. Securities<br />
Other Securities<br />
• Other securities with market value<br />
Same as left<br />
• Other securities without market value<br />
Same as left<br />
b. Derivatives<br />
Same as left<br />
c. Inventories<br />
Same as left<br />
(2) Depreciation methods for signifi cant depreciation assets<br />
a. Property and equipment except for leased assets<br />
Same as left<br />
b. Intangible fi xed assets except for leased assets<br />
Same as left<br />
c. Leased assets<br />
Same as left<br />
33
2010<br />
(From April 1, 2009 to March 31, 2010)<br />
(3) Accounting standards for signifi cant allowances and<br />
provisions<br />
a. Allowance for doubtful accounts<br />
To provide for potential loss on receivables, the Company<br />
makes an allowance for the expected amount of<br />
irrecoverable receivables. Allowances for ordinary bad<br />
debts are computed, based on the historical rate of<br />
default. For specifi c debts where recovery is doubtful, the<br />
Company considers the likelihood of recovery on an<br />
individual basis.<br />
As a result of cancelling out receivables and payables<br />
between consolidated subsidiaries, allowance for doubtful<br />
accounts have been duly adjusted.<br />
b. Reserve for bonuses<br />
Reserve for bonuses is provided in an estimated amount<br />
to be paid to the employees by the Company and its<br />
consolidated subsidiaries based on their services for the<br />
current fi scal period.<br />
c. Reserve for directors’ bonuses<br />
Reserve for directors’ bonuses is provided in an<br />
estimated amount to be paid to the directors by the<br />
Company and its consolidated subsidiaries based on<br />
their services for the current fi scal period.<br />
d. Reserve for warranties and repairs<br />
Reserve for warranties and repairs is provided in an<br />
estimated amount based on the past experience of<br />
certain consolidated subsidiaries to maintain the quality at<br />
the inception of use related to the sales of new cars.<br />
e. Retirement benefi ts obligation and pension plan<br />
To prepare for lump-sum payments upon retirement or<br />
severance of employment, accrual for the lump-sum<br />
payments is stated at the present value of the estimated<br />
future obligations arising from services performed to the<br />
end of the fi scal year.<br />
The retirement benefi ts obligation is attributed to each<br />
period by the straight-line method over the years of<br />
service. The net retirement benefi ts obligation at transition<br />
was charged to operations as incurred.<br />
Actuarial gain and loss are amortized in the year<br />
following the year in which the gain or loss is recognized<br />
primarily by the straight-line method over the period of the<br />
average remaining years of service of the employees.<br />
(Changes in accounting policies)<br />
On July 31, 2008, the ASBJ issued ASBJ Statement No.<br />
19 “Partial Amendments to Accounting Standard for<br />
Retirement Benefi ts (Part 3),” which requires the<br />
companies to use the discount rate determined by<br />
reference to market yields at the end of the fi scal year on<br />
high quality bonds such as long-term Japanese<br />
government bonds, government agency bonds and highquality<br />
corporate bonds. Effective the year ended March<br />
31, 2010, the Company adopted this amendment. There<br />
is no effect of the change on operating income, ordinary<br />
income and Income before income taxes and minority<br />
interests for the year ended March 31, 2010, since an<br />
actuarial difference will be amortized from the following<br />
year. Unamortized actuarial difference on projected<br />
benefi t obligations resulting from this change amounted<br />
to ¥8,503 million as of March 31, 2010.<br />
f. Reserve for directors’ retirement benefi ts<br />
Some of the consolidated subsidiaries are making reserve<br />
for the future payment of retirement benefi ts to directors,<br />
based on the amounts required to be paid according to<br />
their internal rules.<br />
<strong>2011</strong><br />
(From April 1, 2010 to March 31, <strong>2011</strong>)<br />
(3) Accounting standards for signifi cant allowances and<br />
provisions<br />
a. Allowance for doubtful accounts<br />
Same as left<br />
b. Reserve for bonuses<br />
Same as left<br />
c. Reserve for directors’ bonuses<br />
Same as left<br />
d. Reserve for warranties and repairs<br />
Same as left<br />
e. Retirement benefi ts obligation and pension plan<br />
Same as left<br />
———<br />
f. Reserve for directors’ retirement benefi ts<br />
Same as left<br />
34
2010<br />
(From April 1, 2009 to March 31, 2010)<br />
g. Reserve for special repairs<br />
Reserve for special repairs is provided in an estimated<br />
amount for the future repairs of vessels based on the past<br />
experience of certain consolidated subsidiaries.<br />
———<br />
(4) Accounting standards for signifi cant revenue and expenses<br />
a. Basis of recording fi nance lease revenue<br />
Finance lease revenue and related cost of revenue are<br />
recorded when the lease payment is received.<br />
b. Basis of recording amount of completed work<br />
The percentage-of-completion method is applied to the<br />
contracts if the outcome of the construction activity is<br />
deemed certain for the percentage of performance of the<br />
contractor’s obligation at the balance sheet date;<br />
otherwise, the completed-contract method is applied.<br />
The percentage of completion is determined using the<br />
cost incurred to the estimated total cost.<br />
(Changes in accounting policies)<br />
On December 27, 2007, the Accounting Standards Board<br />
of Japan (ASBJ) issued ASBJ Statement No. 15<br />
“Accounting Standard for Construction Contracts” and<br />
ASBJ Guidance No. 18 “Guidance on Accounting<br />
Standard for Construction Contracts.” Effective the year<br />
ended March 31, 2010, the Company adopted this new<br />
accounting standard for construction contracts which<br />
started in the year ended March 31, 2010 and the<br />
percentage-of-completion method has been applied to<br />
the contracts if the outcome of the construction activity is<br />
deemed certain for the percentage of performance of the<br />
contractor’s obligation at the balance sheet date;<br />
otherwise, the completed-contract method is applied.<br />
The percentage of completion is determined using the<br />
cost incurred to the estimated total cost. The effect of<br />
adoption of this new standard on net income is<br />
immaterial.<br />
(5) Signifi cant hedge accounting method<br />
a. Hedge accounting method<br />
Deferred hedge accounting is adopted.<br />
Designation transactions are applied to receivables and<br />
payables denominated in foreign currencies for which<br />
forward foreign exchange contracts are used.<br />
b. Hedge instruments and items<br />
• Hedging instruments<br />
Forward foreign exchange contracts<br />
• Hedged items<br />
Receivables and payables denominated in foreign<br />
currencies and foreign currency-denominated<br />
forecasted transactions<br />
c. Hedging policy<br />
The Company and its consolidated subsidiaries use<br />
derivatives only for hedging purpose to manage the exposure<br />
of assets and liabilities to the market fl uctuation risk.<br />
<strong>2011</strong><br />
(From April 1, 2010 to March 31, <strong>2011</strong>)<br />
g. Reserve for special repairs<br />
Same as left<br />
h. Reserve for loss on disaster<br />
Costs for restoration from the Great East Japan<br />
Earthquake that are likely to accrue after the end of the<br />
fi scal year, including primarily costs for repairs, have been<br />
rationally estimated and stated.<br />
(Additional information)<br />
Costs for restoration from the Great East Japan Earthquake<br />
that are likely to accrue after the end of the fi scal year,<br />
including primarily costs for repairs, have been rationally<br />
estimated and stated.<br />
(4) Accounting standards for signifi cant revenue and expenses<br />
a. Basis of recording fi nance lease revenue<br />
Same as left<br />
b. Basis of recording amount of completed work<br />
Same as left<br />
———<br />
(5) Signifi cant hedge accounting method<br />
a. Hedge accounting method<br />
Same as left<br />
b. Hedge instruments and items<br />
• Hedging instruments<br />
Same as left<br />
• Hedged items<br />
Same as left<br />
c. Hedging policy<br />
Same as left<br />
35
2010<br />
(From April 1, 2009 to March 31, 2010)<br />
d. Method for evaluating hedging effectiveness<br />
The Company and its consolidated subsidiaries use<br />
internally available management data to assess the<br />
effectiveness of hedging.<br />
e. Other<br />
Forward foreign exchange contracts used by the<br />
Company and its consolidated subsidiaries are controlled<br />
by the Control Department based on the application from<br />
each trading section, and the Internal Audit Department<br />
periodically examines the execution and controls on the<br />
forward foreign exchange contracts.<br />
(6) Method and period of amortization of goodwill<br />
———<br />
(7) Cash and cash equivalents in the consolidated statements<br />
of cash fl ows<br />
———<br />
(8) Accounting method for consumption tax<br />
Consumption taxes with respect to the Company and its<br />
domestic subsidiaries are excluded from respective<br />
transaction amounts.<br />
Consumption tax is not applicable to overseas<br />
consolidated subsidiaries.<br />
(9) Accounting method for deferred assets<br />
Bond issuance costs are fully charged to income when they<br />
are paid.<br />
(10) Of all the equity method affi liates, domestic subsidiaries<br />
and affi liates (16 in all) are adopting basically the same<br />
accounting standards as adopted by the Company while<br />
foreign subsidiaries (5 in all) are adopting accounting<br />
standards prevailing in each country they operate, all of<br />
which are not materially different from the accounting<br />
standards adopted by the Company.<br />
5. The valuation of assets and liabilities of consolidated<br />
subsidiaries<br />
Assets and liabilities of consolidated subsidiaries are valued<br />
using the full market value method.<br />
6. Method and period of amortization of goodwill and<br />
negative goodwill<br />
Goodwill and negative goodwill amounts are amortized in equal<br />
installments over 5 years.<br />
7. Cash and cash equivalents in the consolidated<br />
statements of cash flows<br />
Cash and cash equivalents include cash at hand, demand<br />
deposits at banks and highly liquid short-term investments with<br />
negligible risk of fl uctuation in value and maturities of less than<br />
three months.<br />
<strong>2011</strong><br />
(From April 1, 2010 to March 31, <strong>2011</strong>)<br />
d. Method for evaluating hedging effectiveness<br />
Same as left<br />
e. Other<br />
Same as left<br />
(6) Method and period of amortization of goodwill<br />
Goodwill is amortized in equal installments over 5 years.<br />
(7) Cash and cash equivalents in the consolidated statements<br />
of cash fl ows<br />
Cash and cash equivalents include cash at hand, demand<br />
deposits at banks and highly liquid short-term investments<br />
with negligible risk of fl uctuation in value and maturities of<br />
less than three months.<br />
(8) Accounting method for consumption tax<br />
Same as left<br />
(9) Accounting method for deferred assets<br />
———<br />
(10) Same as left<br />
5. The valuation of assets and liabilities of consolidated<br />
subsidiaries<br />
———<br />
6. Method and period of amortization of goodwill and<br />
negative goodwill<br />
———<br />
7. Cash and cash equivalents in the consolidated<br />
statements of cash flows<br />
———<br />
36
3. Changes in significant matters serving as a basis for the presentation of consolidated financial statements<br />
2010<br />
(From April 1, 2009 to March 31, 2010)<br />
<strong>2011</strong><br />
(From April 1, 2010 to March 31, <strong>2011</strong>)<br />
——— (Changes in accounting policies)<br />
(Application of “Accounting Standard for Asset Retirement<br />
Obligations”)<br />
On March 31, 2008, the ASBJ issued ASBJ Statement No. 18<br />
“Accounting Standard for Asset Retirement Obligations” and<br />
issued ASBJ Guidance No. 21 “Guidance on Accounting<br />
Standard for Asset Retirement Obligations.” Effective the year<br />
ended March 31, <strong>2011</strong>, the Company adopted the new<br />
accounting standard and guidance.<br />
As a result of this change, operating income and ordinary<br />
income each decreased ¥405 million (US$4,879 thousand) and<br />
income before income taxes and minority interests decreased<br />
¥7,911 million (US$ 95,144 thousand) for the year ended<br />
March 31, <strong>2011</strong>.<br />
——— (Application of “Accounting Standard for Business<br />
Combinations”)<br />
The Group’s business activities for the year ended March 31,<br />
<strong>2011</strong> included business combinations. Accordingly, the<br />
Company applied ASBJ Statement No. 21 “Accounting<br />
Standard for Business Combinations” issued on December 26,<br />
2008, ASBJ Statement No. 22 “Accounting Standard for<br />
Consolidated Financial Statements” issued on December 26,<br />
2008 and ASBJ Guidance No. 10 “Guidance on Accounting<br />
Standard for Business Combinations and Accounting Standard<br />
for Business Divestitures” issued on December 26, 2008.<br />
4. Changes in presentation method<br />
2010<br />
(From April 1, 2009 to March 31, 2010)<br />
<strong>2011</strong><br />
(From April 1, 2010 to March 31, <strong>2011</strong>)<br />
——— (Consolidated statements of operations)<br />
The Company adopted Cabinet Offi ce Ordinance No. 5<br />
“Cabinet Offi ce Ordinance on Partial Amendment of<br />
Regulations Concerning Terminology, Forms and Methods for<br />
Preparation of Financial Statements” issued on March 24, 2009<br />
based on ASBJ Statement No. 22 “Accounting Standard for<br />
Consolidated Financial Statements” issued on December 26,<br />
2008. Accordingly, the Company disclosed “Income before<br />
minority interests” effective the year ended March 31, <strong>2011</strong>.<br />
5. Additional information<br />
2010<br />
(From April 1, 2009 to March 31, 2010)<br />
<strong>2011</strong><br />
(From April 1, 2010 to March 31, <strong>2011</strong>)<br />
——— (Application of “Accounting Standard for Presentation of<br />
Comprehensive Income”)<br />
Effective the year ended March 31, <strong>2011</strong>, the Company<br />
adopted ASBJ Statement No. 25 “Accounting Standard for<br />
Presentation of Comprehensive Income” issued on June 30,<br />
2010. Amounts for the previous fi scal year under the headings<br />
of “Accumulated other comprehensive income” and “Total<br />
accumulated other comprehensive income” state the amounts<br />
of “Valuation and translation adjustments” and “Total valuation<br />
and translation adjustments,” respectively.<br />
37
6. Notes to Consolidated Balance Sheets<br />
2010<br />
(As of March 31, 2010)<br />
*1. Assets pledged as collateral and secured payables<br />
Assets pledged as collateral are as follows:<br />
(Millions of yen)<br />
Time deposits 157 Land 3,871<br />
Buildings 6,401<br />
Investment<br />
securities<br />
628<br />
Structures 116<br />
Lease investment<br />
assets<br />
463<br />
Machinery and<br />
equipment<br />
21<br />
Total 11,661<br />
The Company’s secured payables are as follows:<br />
(Millions of yen)<br />
Accounts payable-trade 4,601<br />
Long-term loans payable 2,725<br />
Short-term loans payable, etc. 1,980<br />
Total 9,307<br />
*2. Acquisition cost of the assets acquired as substitute for the<br />
assets transferred as a result of impoundment are stated at<br />
the book value of such transferred assets, where the<br />
difference between the transfer values and such book<br />
values (advanced depreciation deduction) are as follows:<br />
(Millions of yen)<br />
Buildings 694 Land 613<br />
Structures 117 Vehicles, etc. 497<br />
Machinery and<br />
equipment<br />
10<br />
Total 1,933<br />
*3. Investments in unconsolidated subsidiaries and affi liates<br />
are as follows:<br />
(Millions of yen)<br />
Equity securities (included in Investment<br />
9,703<br />
securities)<br />
Investments in capital or partnerships (included in<br />
2,193<br />
Other under Investments and other assets)<br />
<strong>2011</strong><br />
(As of March 31, <strong>2011</strong>)<br />
*1. Assets pledged as collateral and secured payables<br />
Assets pledged as collateral are as follows:<br />
(Millions of yen)<br />
Time deposits 155 Land 3,960<br />
Buildings 5,926<br />
Investment<br />
securities<br />
467<br />
Structures 105<br />
Lease investment<br />
assets<br />
380<br />
Machinery and<br />
equipment<br />
12<br />
Total 11,007<br />
(Thousands of U.S. dollars)<br />
Time deposits 1,871 Land 47,633<br />
Buildings 71,270<br />
Investment<br />
securities<br />
5,621<br />
Structures 1,266<br />
Lease investment<br />
assets<br />
4,570<br />
Machinery and<br />
equipment<br />
148<br />
Total 132,382<br />
The Company’s secured payables are as follows:<br />
(Millions of yen)<br />
Accounts payable-trade 3,162<br />
Long-term loans payable 2,255<br />
Short-term loans payable, etc. 1,869<br />
Total 7,287<br />
(Thousands of U.S. dollars)<br />
Accounts payable-trade 38,029<br />
Long-term loans payable 27,120<br />
Short-term loans payable, etc. 22,488<br />
Total 87,638<br />
*2. Acquisition cost of the assets acquired as substitute for the<br />
assets transferred as a result of impoundment are stated at<br />
the book value of such transferred assets, where the<br />
difference between the transfer values and such book<br />
values (advanced depreciation deduction) are as follows:<br />
(Millions of yen)<br />
Buildings 132 Land 186<br />
Machinery and<br />
equipment<br />
137 Structures, etc. 179<br />
Vehicles 10<br />
Total 646<br />
(Thousands of U.S. dollars)<br />
Buildings 1,592 Land 2,242<br />
Machinery and<br />
equipment<br />
1,653 Structures, etc. 2,161<br />
Vehicles 127<br />
Total 7,776<br />
*3. Investments in unconsolidated subsidiaries and affi liates<br />
are as follows:<br />
(Millions of yen)<br />
Equity securities (included in Investment<br />
9,929<br />
securities)<br />
Investments in capital or partnerships (included in<br />
1,760<br />
Other under Investments and other assets)<br />
Equity securities (included in Investment<br />
securities)<br />
Investments in capital or partnerships (included in<br />
Other under Investments and other assets)<br />
(Thousands of U.S. dollars)<br />
119,412<br />
21,171<br />
38
2010<br />
(As of March 31, 2010)<br />
4. Notes discounted with banks ¥56 million<br />
5. Guarantees of loans<br />
The Company has provided guarantees of loans to<br />
unconsolidated subsidiaries and affi liates in respect of their<br />
borrowings from fi nancial institutions.<br />
As of March 31, 2010<br />
Guaranteed<br />
Guaranteed party<br />
amount Type<br />
(Millions of yen)<br />
World Cargo Distribution Center<br />
Loan<br />
783<br />
Co., Ltd.<br />
guarantee<br />
Kobe Port International Distribution<br />
Loan<br />
661<br />
Center Co., Ltd.<br />
guarantee<br />
Yokkaichi Port International Freight<br />
Loan<br />
16<br />
Center Co., Ltd.<br />
guarantee<br />
Guarantees for employees’ housing<br />
Loan<br />
10<br />
loans<br />
guarantee<br />
ANA & JP Express Co., ltd. 8<br />
Loan<br />
guarantee<br />
Nittsu Shoji U.S.A., Inc. 171<br />
Loan<br />
guarantee<br />
Total 1,653<br />
*6. “Other current assets” include reserved payment resulting<br />
from sales of notes receivable issued for the purpose of<br />
securitization of assets in the amount of ¥4,212 million.<br />
*7. Inventories (Millions of yen)<br />
Merchandise and fi nished goods 2,454<br />
Work in process 317<br />
Raw materials and stores 2,213<br />
———<br />
<strong>2011</strong><br />
(As of March 31, <strong>2011</strong>)<br />
4. Notes discounted with banks ¥46 million<br />
US$562 thousand<br />
5. Guarantees of loans<br />
The Company has provided guarantees of loans to<br />
unconsolidated subsidiaries and affi liates in respect of their<br />
borrowings from fi nancial institutions.<br />
As of March 31, <strong>2011</strong><br />
Guaranteed party<br />
Guaranteed<br />
amount<br />
(Millions of yen)<br />
Guaranteed<br />
amount<br />
(Thousands of<br />
U.S. dollars)<br />
World Cargo Distribution<br />
Center Co., Ltd.<br />
678 8,159<br />
Kobe Port International<br />
Distribution Center Co., 578 6,961<br />
Ltd.<br />
Yokkaichi Port International<br />
Freight Center Co., Ltd.<br />
11 140<br />
Guarantees for employees’<br />
housing loans<br />
6 80<br />
Nittsu Shoji U.S.A., Inc. 163 1,964<br />
Total 1,439 17,307<br />
Type<br />
Loan<br />
guarantee<br />
Loan<br />
guarantee<br />
Loan<br />
guarantee<br />
Loan<br />
guarantee<br />
Loan<br />
guarantee<br />
*6. “Other current assets” include reserved payment resulting<br />
from sales of notes receivable issued for the purpose of<br />
securitization of assets in the amount of ¥3,421 million<br />
(U.S.$41,150 thousand).<br />
*7. Inventories (Millions of yen)<br />
Merchandise and fi nished goods 2,269<br />
Work in process 337<br />
Raw materials and stores 2,200<br />
(Thousands of U.S. dollars)<br />
Merchandise and fi nished goods 27,288<br />
Work in process 4,059<br />
Raw materials and stores 26,458<br />
8. Contingent liabilities<br />
In March 2009, the Company was issued by the Fair Trade<br />
Commission a cease and desist order as well as an order<br />
to pay punitive levy, on account of its conduct deemed to<br />
be a breach of the Antimonopoly Act, in respect of the fuel<br />
surcharge applied to its international air cargo transport<br />
service. In this connection, the Company is being<br />
investigated by the U.S. Department of Justice on account<br />
of suspicion of the similar charges in respect of the U.S.<br />
competition law. At this point in time, it is diffi cult to make a<br />
reasonable estimation of the amount of punitive levy to be<br />
payable in association with these charges.<br />
39
7. Notes to Consolidated Statements of Operations<br />
2010<br />
(From April 1, 2009 to March 31, 2010)<br />
*1. Provisions for various reserves are as follows:<br />
Operating<br />
costs<br />
(Millions of yen)<br />
Selling, general,<br />
and administrative<br />
expenses<br />
Reserve for bonuses 16,536 2,623<br />
Reserve for directors’ bonuses — 154<br />
Reserve for warranties and repairs — 2<br />
Retirement benefi t obligation 12,750 1,562<br />
Reserve for directors’ retirement<br />
allowances<br />
— 159<br />
Reserve for special repairs 70 —<br />
*2. Breakdown of gain on sales of property and equipment<br />
(Millions of yen)<br />
Land 1,442<br />
Buildings 59<br />
Intangible assets, etc. 102<br />
Total 1,604<br />
*3. Breakdown of loss on disposal of property and equipment<br />
(Millions of yen)<br />
Buildings 2,802<br />
Structures 598<br />
Machinery and equipment 213<br />
Tools, furniture and fi xtures 270<br />
Land 158<br />
Intangible assets, etc. 955<br />
Total 4,998<br />
*4. Breakdown of gain on sales of securities<br />
(Millions of yen)<br />
Equities in subsidiaries and affi liates 912<br />
Other securities 20<br />
Total 932<br />
*5. Breakdown of loss on sales of securities<br />
(Millions of yen)<br />
Other securities 1,761<br />
Total 1,761<br />
<strong>2011</strong><br />
(From April 1, 2010 to March 31, <strong>2011</strong>)<br />
*1. Provisions for various reserves are as follows:<br />
Operating<br />
costs<br />
(Millions of yen)<br />
Selling, general,<br />
and administrative<br />
expenses<br />
Reserve for bonuses 16,634 2,519<br />
Reserve for directors’ bonuses — 137<br />
Reserve for warranties and repairs — 360<br />
Retirement benefi t obligation 15,774 1,529<br />
Reserve for directors’ retirement<br />
allowances<br />
— 160<br />
Reserve for special repairs 77 —<br />
(Thousands of U.S. dollars)<br />
Operating<br />
costs<br />
Selling, general,<br />
and administrative<br />
expenses<br />
Reserve for bonuses 200,056 30,301<br />
Reserve for directors’ bonuses — 1,651<br />
Reserve for warranties and repairs — 4,332<br />
Retirement benefi t obligation 189,708 18,397<br />
Reserve for directors’ retirement<br />
allowances<br />
— 1,928<br />
Reserve for special repairs 934 —<br />
*2. Breakdown of gain on sales of property and equipment<br />
(Millions of yen)<br />
Land 4,631<br />
Buildings 327<br />
Intangible assets, etc. 273<br />
Total 5,233<br />
(Thousands of U.S. dollars)<br />
Land 55,703<br />
Buildings 3,943<br />
Intangible fi xed assets, etc. 3,287<br />
Total 62,934<br />
*3. Breakdown of loss on disposal of property and equipment<br />
(Millions of yen)<br />
Buildings 2,344<br />
Structures 310<br />
Machinery and equipment 116<br />
Tools, furniture and fi xtures 256<br />
Land 175<br />
Intangible assets, etc. 1,228<br />
Total 4,432<br />
(Thousands of U.S. dollars)<br />
Buildings 28,198<br />
Structures 3,737<br />
Machinery and equipment 1,399<br />
Tools, furniture and fi xtures 3,082<br />
Land 2,113<br />
Intangible assets, etc. 14,774<br />
Total 53,307<br />
*4. Breakdown of gain on sales of securities<br />
(Millions of yen)<br />
Other securities 46<br />
Total 46<br />
(Thousands of U.S. dollars)<br />
Other securities 553<br />
Total 553<br />
*5. Breakdown of loss on sales of securities<br />
(Millions of yen)<br />
Other securities 47<br />
Total 47<br />
(Thousands of U.S. dollars)<br />
Other securities 576<br />
Total 576<br />
40
2010<br />
(From April 1, 2009 to March 31, 2010)<br />
*6. Loss on valuation of golf membership included in the loss<br />
on valuation of investment securities<br />
¥39 million<br />
<strong>2011</strong><br />
(From April 1, 2010 to March 31, <strong>2011</strong>)<br />
*6. Loss on valuation of golf membership included in the loss<br />
on valuation of investment securities<br />
¥20 million (US$245 thousand)<br />
——— *7. Loss on disaster<br />
Provision has been made for the expenses required for<br />
restoring the facilities damaged by the Great East Japan<br />
Earthquake.<br />
Breakdown of the loss on disaster is as follows:<br />
(Millions of yen)<br />
Expenses for the restoration of noncurrent assets 3,372<br />
Loss on damage to noncurrent assets 665<br />
Other 809<br />
(Thousands of U.S. dollars)<br />
Expenses for the restoration of noncurrent assets 40,560<br />
Loss on damage to noncurrent assets 8,002<br />
Other 9,732<br />
8. Notes to Consolidated Statements of Comprehensive Income<br />
<strong>2011</strong> (From April 1, 2010 to March 31, <strong>2011</strong>)<br />
*1. Comprehensive income for the year immediately preceding the year ended March 31, <strong>2011</strong><br />
(Millions of yen)<br />
Comprehensive income attributable to owners of the parent 19,421<br />
Comprehensive income attributable to minority interests 847<br />
Total 20,269<br />
(Thousands of U.S. dollars)<br />
Comprehensive income attributable to owners of the parent 233,568<br />
Comprehensive income attributable to minority interests 10,198<br />
Total 243,766<br />
*2. Other comprehensive income for the year immediately preceding the year ended March 31, <strong>2011</strong><br />
(Millions of yen)<br />
Valuation difference on available-for-sale securities 5,022<br />
Deferred gains or losses on hedges 12<br />
Foreign currency translation adjustment 1,838<br />
Share of other comprehensive income of associates accounted for using equity method 38<br />
Total 6,912<br />
(Thousands of U.S. dollars)<br />
Valuation difference on available-for-sale securities 60,407<br />
Deferred gains or losses on hedges 154<br />
Foreign currency translation adjustment 22,107<br />
Share of other comprehensive income of associates accounted for using equity method 459<br />
Total 83,129<br />
9. Notes to Consolidated Statements of Changes in Net Assets<br />
2010 (From April 1, 2009 to March 31, 2010)<br />
1. Class and number of shares issued<br />
Class of shares<br />
Number of shares<br />
as of March 31, 2009<br />
Number of shares increased<br />
during 2010<br />
Number of shares decreased<br />
during 2010<br />
Number of shares<br />
as of March 31, 2010<br />
Common stock (Thousand shares) 1,062,299 — — 1,062,299<br />
41
2. Class and number of treasury stock<br />
Class of shares<br />
Number of shares<br />
as of March 31, 2009<br />
Number of shares increased<br />
during 2010<br />
Number of shares decreased<br />
during 2010<br />
Number of shares<br />
as of March 31, 2010<br />
Common stock (Thousand shares) 19,441 84 25 19,500<br />
(Outline of reasons for the change)<br />
Increase in treasury stock of common stock is due to purchase of shares of less than one unit.<br />
Decrease in treasury stock of common stock is due to transfer of shares of less than one unit.<br />
3. Dividends<br />
(1) Dividends paid<br />
Resolution<br />
General Shareholders’ Meeting<br />
held on June 26, 2009<br />
Board of Directors’ Meeting<br />
held on October 30, 2009<br />
Class of shares<br />
Total amount of dividends<br />
(Millions of yen)<br />
Dividend per<br />
share (yen)<br />
Record date<br />
Effective date<br />
Common stock 5,214 5.0 March 31, 2009 June 29, 2009<br />
Common stock 5,214 5.0 September 30, 2009 December 4, 2009<br />
(2) Dividends whose record date falls in 2010, but whose effective date comes after March 31, 2010<br />
Class of Source of Total amount of dividends Dividend per<br />
Resolution<br />
Record date<br />
shares dividends (Millions of yen) share (yen)<br />
General Shareholders’ Meeting<br />
held on June 29, 2010<br />
Common<br />
stock<br />
Retained<br />
earnings<br />
Effective date<br />
5,213 5.0 March 31, 2010 June 30, 2010<br />
<strong>2011</strong> (From April 1, 2010 to March 31, <strong>2011</strong>)<br />
1. Class and number of shares issued<br />
Class of shares<br />
Number of shares<br />
as of March 31, 2010<br />
Number of shares increased<br />
during <strong>2011</strong><br />
Number of shares decreased<br />
during <strong>2011</strong><br />
Number of shares<br />
as of March 31, <strong>2011</strong><br />
Common stock (Thousand shares) 1,062,299 — — 1,062,299<br />
2. Class and number of treasury stock<br />
Class of shares<br />
Number of shares<br />
as of March 31, 2010<br />
Number of shares increased<br />
during <strong>2011</strong><br />
Number of shares decreased<br />
during <strong>2011</strong><br />
Number of shares<br />
as of March 31, <strong>2011</strong><br />
Common stock (Thousand shares) 19,500 72 14 19,559<br />
(Outline of reasons for the change)<br />
Increase in treasury stock of common stock is due to purchase of shares of less than one unit.<br />
Decrease in treasury stock of common stock is due to transfer of shares of less than one unit.<br />
3. Dividends<br />
(1) Dividends paid<br />
Resolution<br />
General Shareholders’ Meeting<br />
held on June 29, 2010<br />
Board of Directors’ Meeting<br />
held on October 29, 2010<br />
Resolution<br />
General Shareholders’ Meeting<br />
held on June 29, 2010<br />
Board of Directors’ Meeting<br />
held on October 29, 2010<br />
Class of shares<br />
Total amount of dividends<br />
(Millions of yen)<br />
Dividend per<br />
share (yen)<br />
Record date<br />
Effective date<br />
Common stock 5,213 5.0 March 31, 2010 June 30, 2010<br />
Common stock 5,213 5.0 September 30, 2010 December 3, 2010<br />
Class of shares<br />
Total amount of dividends Dividend per<br />
(Thousands of U.S. dollars) share (U.S. cents)<br />
Record date<br />
Effective date<br />
Common stock 62,705 6.0 March 31, 2010 June 30, 2010<br />
Common stock 62,704 6.0 September 30, 2010 December 3, 2010<br />
(2) Dividends whose record date falls in <strong>2011</strong>, but whose effective date comes after March 31, <strong>2011</strong><br />
Class of Source of Total amount of dividends Dividend per<br />
Resolution<br />
Record date<br />
shares dividends (Millions of yen) share (yen)<br />
General Shareholders’ Meeting<br />
held on June 29, <strong>2011</strong><br />
Common<br />
stock<br />
Retained<br />
earnings<br />
Effective date<br />
5,213 5.0 March 31, <strong>2011</strong> June 30, <strong>2011</strong><br />
Resolution<br />
Class of<br />
shares<br />
Source of<br />
dividends<br />
Total amount of dividends<br />
(Thousands of U.S. dollars)<br />
Dividend per<br />
share (U.S. cents)<br />
Record date<br />
Effective date<br />
General Shareholders’ Meeting<br />
held on June 29, <strong>2011</strong><br />
Common<br />
stock<br />
Retained<br />
earnings<br />
62,702 6.0 March 31, <strong>2011</strong> June 30, <strong>2011</strong><br />
42
10. Notes to Consolidated Statements of Cash Flows<br />
2010<br />
(From April 1, 2009 to March 31, 2010)<br />
*1. Relationship between the year-end balance of cash and<br />
cash equivalents and the amount of consolidated balance<br />
sheet items.<br />
(Millions of yen)<br />
(As of March 31, 2010)<br />
Cash and cash in banks 129,217<br />
Time deposits with maturities of over three months (7,872)<br />
Time deposits pledged as collateral for debts (157)<br />
Cash and cash equivalents 121,187<br />
*2. “Interest expenses” as well as “Interest expenses paid” in<br />
Cash fl ows from operating activities are presented<br />
excluding ¥1,118 million fi nancial expenses included in cost<br />
of sales in Goods Sales business (leasing business).<br />
11. Notes to leases<br />
2010<br />
(From April 1, 2009 to March 31, 2010)<br />
1. Finance leases<br />
(Lessee) ———<br />
(Lessor)<br />
(1) Breakdown of lease investment assets<br />
(Millions of yen)<br />
Gross lease receivables 92,310<br />
Estimated residual values 1,076<br />
Unearned interest income (3,408)<br />
Lease investment assets 89,978<br />
(2) Amount scheduled for recovery after the consolidation date<br />
of the gross lease receivables in respect of lease receivables<br />
and lease investment assets.<br />
(Millions of yen)<br />
Lease<br />
receivables<br />
Lease<br />
investment<br />
assets<br />
Due in one year or less 2,948 31,034<br />
Due after one year through two years 2,656 24,686<br />
Due after two years through three years 2,217 17,610<br />
Due after three years through four years 1,270 10,830<br />
Due after four years through fi ve years 562 4,353<br />
Due after fi ve years 577 3,794<br />
<strong>2011</strong><br />
(From April 1, 2010 to March 31, <strong>2011</strong>)<br />
*1. Relationship between the year-end balance of cash and<br />
cash equivalents and the amount of consolidated balance<br />
sheet items.<br />
(Millions of yen)<br />
(As of March 31, <strong>2011</strong>)<br />
Cash and cash in banks 113,149<br />
Time deposits with maturities of over three months (5,931)<br />
Time deposits pledged as collateral for debts (155)<br />
Cash and cash equivalents 107,062<br />
(Thousands of U.S. dollars)<br />
(As of March 31, <strong>2011</strong>)<br />
Cash and cash in banks 1,360,789<br />
Time deposits with maturities of over three months (71,330)<br />
Time deposits pledged as collateral for debts (1,871)<br />
Cash and cash equivalents 1,287,587<br />
*2. “Interest expenses” as well as “Interest expenses paid” in<br />
Cash fl ows from operating activities are presented<br />
excluding ¥982 million (US$11,813 thousand) fi nancial<br />
expenses included in cost of sales in Goods Sales<br />
business (leasing business).<br />
<strong>2011</strong><br />
(From April 1, 2010 to March 31, <strong>2011</strong>)<br />
1. Finance leases<br />
(Lessee) ———<br />
(Lessor)<br />
(1) Breakdown of lease investment assets<br />
(Millions of yen)<br />
Gross lease receivables 89,627<br />
Estimated residual values 1,114<br />
Unearned interest income (2,752)<br />
Lease investment assets 87,989<br />
(Thousands of U.S. dollars)<br />
Gross lease receivables 1,077,896<br />
Estimated residual values 13,404<br />
Unearned interest income (33,097)<br />
Lease investment assets 1,058,204<br />
(2) Amount scheduled for recovery after the consolidation date<br />
of the gross lease receivables in respect of lease receivables<br />
and lease investment assets.<br />
(Millions of yen)<br />
Lease<br />
receivables<br />
Lease<br />
investment<br />
assets<br />
Due in one year or less 3,153 30,891<br />
Due after one year through two years 2,672 23,931<br />
Due after two years through three years 1,647 16,980<br />
Due after three years through four years 886 10,052<br />
Due after four years through fi ve years 418 3,974<br />
Due after fi ve years 495 3,797<br />
(Thousands of U.S. dollars)<br />
Lease<br />
receivables<br />
Lease<br />
investment<br />
assets<br />
Due in one year or less 37,923 371,511<br />
Due after one year through two years 32,140 287,813<br />
Due after two years through three years 19,811 204,212<br />
Due after three years through four years 10,661 120,891<br />
Due after four years through fi ve years 5,031 47,793<br />
Due after fi ve years 5,959 45,673<br />
43
2010<br />
(From April 1, 2009 to March 31, 2010)<br />
2. Operating leases<br />
Future payment obligations under non-cancellable operating<br />
leases are as follows:<br />
(Lessee)<br />
(Millions of yen)<br />
Portion due within one year 19,188<br />
Thereafter 124,138<br />
Total 143,327<br />
(Lessor) ———<br />
<strong>2011</strong><br />
(From April 1, 2010 to March 31, <strong>2011</strong>)<br />
2. Operating leases<br />
Future payment obligations under non-cancellable operating<br />
leases are as follows:<br />
(Lessee)<br />
(Millions of yen)<br />
Portion due within one year 18,205<br />
Thereafter 110,059<br />
Total 128,264<br />
(Thousands of U.S. dollars)<br />
Portion due within one year 218,944<br />
Thereafter 1,323,623<br />
Total 1,542,567<br />
(Lessor) ———<br />
12. Financial instruments<br />
2010 (From April 1, 2009 to March 31, 2010)<br />
(Additional information)<br />
On March 10, 2008, the ASBJ revised ASBJ Statement No. 10<br />
“Accounting Standard for Financial Instruments” and issued ASBJ<br />
Guidance No. 19 “Guidance on Disclosures about Fair Value of<br />
Financial Instruments.” The Group applied the revised accounting<br />
standard and the new guidance effective the year ended March<br />
31, 2010.<br />
1. Financial instruments and related disclosures<br />
1) Group policy for financial instruments<br />
The Group raises necessary funds for capital investments<br />
mainly by bank loans and issuance of bonds. Short-term<br />
working funds are raised mainly by bank loans. Derivatives are<br />
used only for hedging purposes to manage the exposure of<br />
assets and liabilities to the market fl uctuation risk and mainly<br />
forward foreign currency contracts are utilized to avoid foreign<br />
exchange risk on receivables and payables denominated in<br />
foreign currencies as described below. The Group does not<br />
enter into derivatives for speculative or trading purposes.<br />
2) Nature and risk of financial instruments and risk<br />
management system<br />
Trade receivables such as trade notes and trade accounts are<br />
exposed to customer credit risk. The Group manages its<br />
customer credit risk by managing payment terms and balances<br />
by monitoring periodically the fi nancial positions of customers in<br />
accordance with the internal guidelines. Although foreign<br />
currency trade receivables are exposed to foreign currency<br />
fl uctuation risk, they are partially hedged by forward foreign<br />
currency contracts. Investment securities mainly consisting of<br />
the equities of customers or suppliers owned for business or<br />
capital alliance purposes are exposed to the risk of market<br />
price fl uctuations and their holding status is continuously<br />
reviewed by monitoring the market value and fi nancial position<br />
of the issuers on a regular basis and considering relationships<br />
with the counterparties.<br />
The payment terms of trade payables are almost all less<br />
than one year. Although some of them are denominated in<br />
foreign currencies and exposed to foreign currency fl uctuation<br />
risk, they are partially hedged using forward foreign currency<br />
contracts. Short-term loans payable are mainly used for<br />
operations and the main objective of long-term loans and<br />
bonds is to raise necessary funds for capital investments.<br />
Maturities of bonds are within nine years after the balance sheet<br />
date and interest expenses of long-term loans are fi xed by the<br />
fi xed interest rate.<br />
Derivatives mainly include forward foreign currency<br />
contracts, which are used to hedge foreign exchange risk on<br />
trade receivables and payables denominated in foreign<br />
currencies. The effectiveness of hedging is assessed using<br />
internal effectiveness management data.<br />
Derivative transactions are controlled by the Control<br />
Department based on the application from each trading<br />
section, and the Internal Audit Department periodically<br />
examines the execution and controls on the derivative<br />
transactions. In using derivatives, the Group enters into the<br />
contracts with the high credit rating banks and believes that<br />
credit risk arising from default is quite limited.<br />
With respect to liquidity risk related to fund raising, the<br />
Group manages its liquidity risk by controlling the funds of the<br />
Group as a whole on a timely basis, diversifying the funding<br />
instruments, obtaining commitment lines from fi nancial<br />
institutions and making adjustments for the short-term and<br />
long-term fund considering market environments.<br />
3) Supplementary explanation about the fair values of<br />
financial instruments<br />
The fair values of fi nancial instruments comprise the quoted<br />
market price and other rationally computed values, if market<br />
price is not available. Since various variable factors are<br />
considered in computing the values, such values may vary<br />
depending on the assumptions to be adopted. The contract<br />
amounts of derivatives described in Note “Derivatives” do not<br />
indicate the amount of exposure to the market risk related to<br />
the derivatives.<br />
44
2. Fair value of financial instruments<br />
Carrying amount, fair value and related unrealized gain (loss) on fi nancial instruments at March 31, 2010 are as follows:<br />
Millions of yen<br />
Carrying amount (*1) Fair value (*1) Unrealized gain (loss)<br />
(1) Cash and cash in banks 129,217 129,217 —<br />
(2) Accounts receivable—trade 226,907 226,907 —<br />
(3) Lease investment assets 89,978 90,522 544<br />
(4) Investment securities<br />
Other securities 78,738 78,738 —<br />
(5) Accounts payable—trade (129,002) (129,002) —<br />
(6) Short-term loans payable (6,834) (6,834) —<br />
(7) Long-term loans payable (249,794) (251,282) (1,488)<br />
(8) Derivatives (*2)<br />
1) To which hedge accounting is not applied (42) (42) —<br />
2) To which hedge accounting is applied 21 21 —<br />
(*1) Figures in parentheses indicate negative values.<br />
(*2) Receivables and payables incurred as a result of derivatives are presented on a net basis.<br />
(Note 1) Computation method of fair values of fi nancial instruments and other matters concerning securities and derivatives<br />
(1) Cash and cash in banks and (2) accounts receivable—trade:<br />
Due to their short maturities, these assets are recorded using book values because fair values approximate carrying values.<br />
(3) Lease investment assets:<br />
Fair values of lease investment assets are computed by discounting the aggregate values of the principal and interest using<br />
an interest rate assumed if the same lease agreement were entered.<br />
(4) Investment securities:<br />
Fair values of equity securities are determined by the quoted price of the stock exchange.<br />
(5) Accounts payable—trade and (6) short-term loans payable:<br />
Due to their short maturities, these payables are recorded using book values because fair values approximate carrying<br />
values. Short-term loans payable are stated excluding the current portion of long-term loans payable.<br />
(7) Long-term loans payable:<br />
Fair values of long-term loans payable are computed by discounting the aggregate values of the principal and interest of<br />
long-term loans payable classifi ed by certain period using an interest rate assumed if the same loan were made. Long-term<br />
loans payable is stated including the current portion of long-term loans payable.<br />
(8) Derivatives:<br />
Information on the fair value of derivatives is included in Note “Derivatives.”<br />
(Note 2) Unlisted equity securities whose carrying amount is ¥25,847 million are not included in (4) investment securities—other<br />
securities, since there is no quoted market price and it is very diffi cult to identify fair values by estimating future cash fl ows.<br />
(Note 3) The redemption schedule for monetary receivables and other securities with contractual maturities after the consolidated<br />
closing date<br />
Millions of yen<br />
Due in one year or less<br />
Due after one year<br />
through fi ve years<br />
Due after fi ve years<br />
through ten years<br />
Cash and cash in banks 129,217 — —<br />
Accounts receivable—trade 226,907 — —<br />
Lease investment assets 30,661 57,704 1,611<br />
Investment securities<br />
Other securities with contractual maturities — — —<br />
(Note 4) Repayment schedule for bonds, long-term loans payable, lease obligation, and other interest bearing liabilities after the<br />
consolidated closing date<br />
Millions of yen<br />
Due in one year or less<br />
Due after one year<br />
through fi ve years*<br />
Due after fi ve years<br />
Short-term loans payable 6,834 — —<br />
Commercial paper 7,000 — —<br />
Bonds — 15,000 35,000<br />
Long-term loans payable 104,667 128,334 16,792<br />
Lease obligation 842 1,961 1,775<br />
Liabilities on transfer of long-term receivables 675 54 —<br />
* For scheduled repayment amount per year of bonds, long-term loans payable, lease obligation, and other interest bearing liabilities due after one<br />
year through fi ve years, please refer to “Schedule of bonds” and “Schedule of loans” in the Supplementary schedule.<br />
45
<strong>2011</strong> (From April 1, 2010 to March 31, <strong>2011</strong>)<br />
1. Financial instruments and related disclosures<br />
1) Group policy for financial instruments<br />
The Group raises necessary funds for capital investments<br />
mainly by bank loans and issuance of bonds. Short-term<br />
working funds are raised mainly by bank loans. Derivatives are<br />
used only for hedging purposes to manage the exposure of<br />
assets and liabilities to the market fl uctuation risk and mainly<br />
forward foreign currency contracts are utilized to avoid foreign<br />
exchange risk on receivables and payables denominated in<br />
foreign currencies as described below. The Group does not<br />
enter into derivatives for speculative or trading purposes.<br />
2) Nature and risk of financial instruments and risk<br />
management system<br />
Trade receivables such as trade notes and trade accounts are<br />
exposed to customer credit risk. The Group manages its<br />
customer credit risk by managing payment terms and balances<br />
by monitoring periodically the fi nancial positions of customers in<br />
accordance with the internal guidelines. Although foreign<br />
currency trade receivables are exposed to foreign currency<br />
fl uctuation risk, they are partially hedged by forward foreign<br />
currency contracts. Investment securities mainly consisting of<br />
the equities of customers or suppliers owned for business or<br />
capital alliance purposes are exposed to the risk of market<br />
price fl uctuations and their holding status is continuously<br />
reviewed by monitoring the market value and fi nancial position<br />
of the issuers on a regular basis and considering relationships<br />
with the counterparties.<br />
The payment terms of trade payables are almost all less<br />
than one year. Although some of them are denominated in<br />
foreign currencies and exposed to foreign currency fl uctuation<br />
risk, they are partially hedged using forward foreign currency<br />
contracts. Short-term loans payable are mainly used for<br />
operations and the main objective of long-term loans and<br />
bonds is to raise necessary funds for capital investments.<br />
Maturities of bonds are within eight years after the balance<br />
sheet date and interest expenses of long-term loans are fi xed<br />
by the fi xed interest rate.<br />
Derivatives mainly include forward foreign currency<br />
contracts, which are used to hedge foreign exchange risk on<br />
trade receivables and payables denominated in foreign<br />
currencies. The effectiveness of hedging is assessed using<br />
internal effectiveness management data.<br />
Derivative transactions are controlled by the Control<br />
Department based on the application from each trading<br />
section, and the Internal Audit Department periodically<br />
examines the execution and controls on the derivative<br />
transactions. In using derivatives, the Group enters into the<br />
contracts with the high credit rating banks and believes that<br />
credit risk arising from default is quite limited.<br />
With respect to liquidity risk related to fund raising, the<br />
Group manages its liquidity risk by controlling the funds of the<br />
Group as a whole on a timely basis, diversifying the funding<br />
instruments, obtaining commitment lines from fi nancial<br />
institutions and making adjustments for the short-term and<br />
long-term fund considering market environments.<br />
3) Supplementary explanation about the fair values of<br />
financial instruments<br />
The fair values of fi nancial instruments comprise the quoted<br />
market price and other rationally computed values, if market<br />
price is not available. Since various variable factors are<br />
considered in computing the values, such values may vary<br />
depending on the assumptions to be adopted. The contract<br />
amounts of derivatives described in Note “Derivatives” do not<br />
indicate the amount of exposure to the market risk related to<br />
the derivatives.<br />
2. Fair value of financial instruments<br />
Carrying amount, fair value and related unrealized gain (loss) on fi nancial instruments at March 31, <strong>2011</strong> are as follows:<br />
Millions of yen<br />
Carrying amount (*1) Fair value (*1) Unrealized gain (loss)<br />
(1) Cash and cash in banks 113,149 113,149 —<br />
(2) Accounts receivable—trade 221,814 221,814 —<br />
(3) Lease investment assets 87,989 89,009 1,019<br />
(4) Investment securities<br />
Other securities 67,263 67,263 —<br />
(5) Accounts payable—trade (119,899) (119,899) —<br />
(6) Short-term loans payable (3,375) (3,375) —<br />
(7) Long-term loans payable (246,044) (246,438) (394)<br />
(8) Derivatives (*2)<br />
1) To which hedge accounting is not applied (31) (31) —<br />
2) To which hedge accounting is applied 6 6 —<br />
46
Thousands of U.S. dollars<br />
Carrying amount (*1) Fair value (*1) Unrealized gain (loss)<br />
(1) Cash and cash in banks 1,360,789 1,360,789 —<br />
(2) Accounts receivable—trade 2,667,648 2,667,648 —<br />
(3) Lease investment assets 1,058,204 1,070,469 12,265<br />
(4) Investment securities<br />
Other securities 808,937 808,937 —<br />
(5) Accounts payable—trade (1,441,966) (1,441,966) —<br />
(6) Short-term loans payable (40,590) (40,590) —<br />
(7) Long-term loans payable (2,959,045) (2,963,787) (4,741)<br />
(8) Derivatives (*2)<br />
1) To which hedge accounting is not applied (377) (377) —<br />
2) To which hedge accounting is applied 72 72 —<br />
(*1) Figures in parentheses indicate negative values.<br />
(*2) Receivables and payables incurred as a result of derivatives are presented on a net basis.<br />
(Note 1) Computation method of fair values of fi nancial instruments and other matters concerning securities and derivatives<br />
(1) Cash and cash in banks and (2) accounts receivable—trade:<br />
Due to their short maturities, these assets are recorded using book values because fair values approximate carrying values.<br />
(3) Lease investment assets:<br />
Fair values of lease investment assets are computed by discounting the aggregate values of the principal and interest using<br />
an interest rate assumed if the same lease agreement were entered.<br />
(4) Investment securities:<br />
Fair values of equity securities are determined by the quoted price of the stock exchange.<br />
(5) Accounts payable—trade and (6) short-term loans payable:<br />
Due to their short maturities, these payables are recorded using book values because fair values approximate carrying<br />
values. Short-term loans payable are stated excluding the current portion of long-term loans payable.<br />
(7) Long-term loans payable:<br />
Fair values of long-term loans payable are computed by discounting the aggregate values of the principal and interest of<br />
long-term loans payable classifi ed by certain period using an interest rate assumed if the same loan were made. Long-term<br />
loans payable is stated including the current portion of long-term loans payable.<br />
(8) Derivatives:<br />
Information on the fair value of derivatives is included in Note “Derivatives.”<br />
(Note 2) Unlisted equity securities whose carrying amount is ¥10,602 million (US$127,516 thousand) are not included in (4)<br />
investment securities—other securities, since there is no quoted market price and it is very diffi cult to identify fair values by<br />
estimating future cash fl ows.<br />
(Note 3) The redemption schedule for monetary receivables and other securities with contractual maturities after the consolidated<br />
closing date<br />
Millions of yen<br />
Thousands of U.S. dollars<br />
Due in one year<br />
or less<br />
Due after one year<br />
through fi ve years<br />
Due after fi ve years<br />
through ten years<br />
Due in one year<br />
or less<br />
Due after one year<br />
through fi ve years<br />
Due after fi ve years<br />
through ten years<br />
Cash and cash in banks 113,149 — — 1,360,789 — —<br />
Accounts receivable—trade 221,814 — — 2,667,648 — —<br />
Lease investment assets 29,580 53,562 4,846 355,754 644,169 58,280<br />
(Note 4) Repayment schedule for short-term loans payable and long-term loans payable after the consolidated closing date<br />
Due in one year<br />
or less<br />
Millions of yen<br />
Due after one year<br />
through fi ve years*<br />
Due after fi ve years<br />
Due in one year<br />
or less<br />
Thousands of U.S. dollars<br />
Due after one year<br />
through fi ve years*<br />
Due after fi ve years<br />
Short-term loans payable 3,375 — — 40,590 — —<br />
Long-term loans payable 46,550 154,530 44,963 559,835 1,858,459 540,750<br />
* For scheduled repayment amount per year of short-term loans payable and long-term loans payable due after one year through fi ve years,<br />
please refer to “Schedule of loans” in the supplementary schedule for the consolidated fi nancial statements.<br />
47
13. Securities<br />
2010 (March 31, 2010)<br />
1. Other securities<br />
Millions of yen<br />
Category Carrying value Cost Unrealized gain (loss)<br />
Carrying value exceeds cost:<br />
1) Equity securities 77,028 20,512 56,516<br />
2) Other — — —<br />
Sub-total 77,028 20,512 56,516<br />
Cost exceeds carrying value:<br />
1) Equity securities 1,709 1,921 (212)<br />
2) Other — — —<br />
Sub-total 1,709 1,921 (212)<br />
Total 78,738 22,433 56,304<br />
(Note) The above costs are stated after deducting impairment loss. Impairment loss on other securities with fair value amounted to ¥68 million for the<br />
year ended March 31, 2010.<br />
The Company recognizes impairment loss when the fair value declines more than 50% of its acquisition cost and determines if it is necessary<br />
to recognize impairment loss after considering the movements of the individual fair value when the fair value declines to between 30% and 50%<br />
of the acquisition cost.<br />
2. Other securities sold during 2010 (From April 1, 2009 to March 31, 2010)<br />
Millions of yen<br />
Category Carrying value Total gains on sales Total losses on sales<br />
1) Equity securities 726 20 1,761<br />
2) Other — — —<br />
Total 726 20 1,761<br />
<strong>2011</strong> (March 31, <strong>2011</strong>)<br />
1. Other securities<br />
Millions of yen<br />
Category Carrying value Cost<br />
Unrealized<br />
gain (loss)<br />
Carrying value<br />
Thousands of U.S. dollars<br />
Cost<br />
Unrealized<br />
gain (loss)<br />
Carrying value exceeds cost:<br />
1) Equity securities 65,273 20,185 45,087 785,005 242,758 542,246<br />
2) Other — — — — — —<br />
Sub-total 65,273 20,185 45,087 785,005 242,758 542,246<br />
Cost exceeds carrying value:<br />
1) Equity securities 1,989 2,386 (396) 23,932 28,701 (4,768)<br />
2) Other — — — — — —<br />
Sub-total 1,989 2,386 (396) 23,932 28,701 (4,768)<br />
Total 67,263 22,571 44,691 808,937 271,459 537,478<br />
(Note) The above costs are stated after deducting impairment loss. Impairment loss on other securities with fair value amounted to ¥80 million<br />
(US$973 thousand) for the year ended March 31, <strong>2011</strong>.<br />
The Company recognizes impairment loss when the fair value declines more than 50% of its acquisition cost and determines if it is necessary<br />
to recognize impairment loss after considering the movements of the individual fair value when the fair value declines to between 30% and 50%<br />
of the acquisition cost.<br />
2. Other securities sold during <strong>2011</strong> (From April 1, 2010 to March 31, <strong>2011</strong>)<br />
Millions of yen<br />
Category<br />
Carrying value<br />
Total gains<br />
on sales<br />
Total losses<br />
on sales<br />
Carrying value<br />
Thousands of U.S. dollars<br />
Total gains<br />
on sales<br />
Total losses<br />
on sales<br />
1) Equity securities 308 46 47 3,711 553 576<br />
2) Other — — — — — —<br />
Total 308 46 47 3,711 553 576<br />
48
14. Derivatives<br />
2010 (March 31, 2010)<br />
1. Derivative transactions to which hedge accounting is not applied at March 31, 2010<br />
(1) Currency-related derivatives<br />
Millions of yen<br />
Category Type of derivatives Contract amount<br />
Transactions other than<br />
market transactions<br />
Currency swap contracts:<br />
U.S. $ receipt, JPY payment<br />
(*1) Fair value is based on the amount obtained from the fi nancial institution.<br />
Contract amount<br />
due after one year<br />
Fair value (*1)<br />
Unrealized gain (loss)<br />
315 135 (42) (42)<br />
2. Derivative transactions to which hedge accounting is applied at March 31, 2010<br />
(1) Currency-related derivatives<br />
Millions of yen<br />
Hedge accounting<br />
method<br />
Normal method<br />
Hedged items<br />
translated using<br />
contract rates<br />
Type of derivatives Major hedged items Contract amount<br />
Forward foreign currency contracts:<br />
Buying US$, etc.<br />
Forward foreign currency contracts:<br />
Selling US$, etc.<br />
Forward foreign currency contracts:<br />
Buying US$, etc.<br />
Forecasted<br />
transaction on<br />
payables in<br />
foreign currencies<br />
Accounts<br />
receivable—trade<br />
Accounts<br />
payable—trade<br />
Contract amount<br />
due after one year<br />
Fair value (*1)<br />
1,280 — 21<br />
59 —<br />
1,450 —<br />
(*1) Fair value is based on the amount obtained from the fi nancial institution.<br />
(*2) Fair values of derivatives are included in the fair values of the related accounts receivable—trade and accounts payable—trade, since they are<br />
accounted for in translating the hedged items.<br />
(*2)<br />
<strong>2011</strong> (March 31, <strong>2011</strong>)<br />
1. Derivative transactions to which hedge accounting is not applied at March 31, <strong>2011</strong><br />
(1) Currency-related derivatives<br />
Millions of yen<br />
Category<br />
Transactions other than<br />
market transactions<br />
Type of derivatives<br />
Currency swap contracts:<br />
U.S. $ receipt, JPY payment<br />
Contract<br />
amount<br />
Contract<br />
amount<br />
due after<br />
one year<br />
(*1) Fair value is based on the amount obtained from the fi nancial institution.<br />
Fair value<br />
(*1)<br />
Unrealized<br />
gain (loss)<br />
2. Derivative transactions to which hedge accounting is applied at March 31, <strong>2011</strong><br />
(1) Currency-related derivatives<br />
Millions of yen<br />
Hedge<br />
accounting<br />
method<br />
Normal method<br />
Hedged items<br />
translated using<br />
contract rates<br />
Type of derivatives<br />
Forward foreign currency contracts:<br />
Selling US$, etc.<br />
Forward foreign currency contracts:<br />
Buying US$, etc.<br />
Forward foreign currency contracts:<br />
Selling US$, etc.<br />
Forward foreign currency contracts:<br />
Buying US$, etc.<br />
Contract<br />
amount<br />
Thousands of U.S. dollars<br />
Contract<br />
amount<br />
due after<br />
one year<br />
Fair value<br />
(*1)<br />
Unrealized<br />
gain (loss)<br />
135 — (31) (31) 1,623 — (377) (377)<br />
Major hedged items<br />
Forecasted<br />
transaction on<br />
receivables and<br />
payables in<br />
foreign currencies<br />
Accounts<br />
receivable—trade<br />
Accounts<br />
payable—trade<br />
Contract<br />
amount<br />
Contract<br />
amount<br />
due after<br />
one year<br />
Fair value<br />
(*1)<br />
Contract<br />
amount<br />
Thousands of U.S. dollars<br />
Contract<br />
amount<br />
due after<br />
one year<br />
Fair value<br />
(*1)<br />
2,375 — (0) 28,571 — (10)<br />
1,238 — 6 14,894 — 82<br />
302 —<br />
3,632 —<br />
(*2)<br />
805 — 9,692 —<br />
(*1) Fair value is based on the amount obtained from the fi nancial institution.<br />
(*2) Fair values of derivatives are included in the fair values of the related accounts receivable—trade and accounts payable—trade, since they are<br />
accounted for in translating the hedged items.<br />
(*2)<br />
49
15. Retirement benefits obligation and pension plan<br />
1. Overview of retirement benefit plans<br />
The Company and domestic consolidated subsidiaries have two<br />
types of defi ned-benefi ts retirement plans: retirement lump sum<br />
payment plan and qualifi ed corporate pension plan. Moreover, the<br />
Company and some domestic consolidated subsidiaries adopt<br />
defi ned contribution pension plans while some overseas<br />
consolidated subsidiaries have defi ned benefi t pension plans.<br />
There are also cases when an employee is given a severance<br />
pay premium on leaving the company. Further, the Company<br />
adopts a retirement allowance trust.<br />
2. Retirement benefits obligation<br />
Millions of yen<br />
Thousands of U.S. dollars<br />
2010<br />
(As of March 31, 2010)<br />
<strong>2011</strong><br />
(As of March 31, <strong>2011</strong>)<br />
<strong>2011</strong><br />
(As of March 31, <strong>2011</strong>)<br />
A. Projected benefi ts obligation (169,239) (166,427) (2,001,528)<br />
B. Plan assets at fair market value 46,300 42,940 516,425<br />
C. Unfunded retirement benefi ts obligation (A+B) (122,939) (123,486) (1,485,102)<br />
D. Unrecognized actuarial net loss 85,874 87,598 1,053,494<br />
E. Unrecognized prior service cost (2,202) (1,652) (19,875)<br />
F. Retirement benefi ts obligation at end of year (C+D+E) (39,268) (37,540) (451,484)<br />
G. Provision for retirement benefi ts (F) (39,268) (37,540) (451,484)<br />
(Note) Some consolidated subsidiaries use the simplifi ed method for calculating retirement benefi ts obligation.<br />
3. Pension expense<br />
2010<br />
From April 1, 2009<br />
( to March 31, 2010 )<br />
Millions of yen<br />
<strong>2011</strong><br />
From April 1, 2010<br />
( to March 31, <strong>2011</strong> )<br />
Thousands of U.S. dollars<br />
<strong>2011</strong><br />
From April 1, 2010<br />
( to March 31, <strong>2011</strong> )<br />
A. Service cost 5,947 7,369 88,634<br />
B. Interest cost on projected benefi ts obligation 3,501 3,227 38,814<br />
C. Expected return on plan assets (467) (504) (6,063)<br />
D. Amortization of unrecognized actuarial net loss 5,880 7,760 93,330<br />
E. Prior service cost recognized (548) (549) (6,608)<br />
F. Net periodic pension cost (A+B+C+D+E) 14,312 17,304 208,106<br />
G. Other 6,802 6,929 83,337<br />
Total 21,115 24,233 291,444<br />
(Note) Net periodic pension cost of consolidated subsidiaries using the simplifi ed method are added up in “A. Service cost.” “G. Other” is premium paid to<br />
a defi ned contribution pension plan.<br />
4. Actuarial assumptions used to determine costs and obligations for retirement benefits<br />
2010<br />
(From April 1, 2009 to March 31, 2010)<br />
<strong>2011</strong><br />
(From April 1, 2010 to March 31, <strong>2011</strong>)<br />
A. Allocation of projected benefi ts obligation Straight-line method Same as left<br />
B. Discount rate Mainly 1.9% Mainly 1.75%<br />
C. Expected rate of return on plan assets Mainly 2.5% Same as left<br />
D. Recognition period of prior service cost 15 years (Past service obligations have<br />
been recognized evenly over the fi fteen<br />
years (a period not exceeding the<br />
expected average remaining working<br />
lives of the employee) from the time of<br />
occurrence).<br />
Same as left<br />
E. Amortization period of actuarial net loss<br />
(gain)<br />
12–15 years (Actuarial losses have<br />
been recognized evenly over the twelve<br />
to fi fteen years (a period not exceeding<br />
the expected average remaining<br />
working lives of the employees)<br />
following the respective fi scal years<br />
when such losses are identifi ed).<br />
Same as left<br />
50
16. Income taxes<br />
2010<br />
(As of March 31, 2010)<br />
1. The signifi cant components of the Company’s deferred tax<br />
assets and liabilities<br />
Millions<br />
of yen<br />
Deferred tax assets:<br />
(Current)<br />
Allowance for doubtful accounts 140<br />
Accrued bonuses 7,538<br />
Enterprise tax payable 663<br />
Lease transaction 1,096<br />
Other 9,860<br />
Total 19,298<br />
(Non-current)<br />
Allowance for doubtful accounts 600<br />
Retirement benefi ts 42,941<br />
Unrealized gain 2,005<br />
Impairment loss 3,389<br />
Other 7,355<br />
Total 56,291<br />
Sub-total 75,590<br />
Valuation allowance (9,475)<br />
Total deferred tax assets 66,115<br />
Deferred tax liabilities:<br />
(Current)<br />
Reserve for deferred gains on fi xed assets (836)<br />
Other (2,650)<br />
Total (3,486)<br />
(Non-current)<br />
Reserve for deferred gains on fi xed assets (17,294)<br />
Gain on securities contribution to employees’<br />
retirement benefi ts trust<br />
(20,960)<br />
Unrealized gain on securities (22,915)<br />
Other (2,031)<br />
Total (63,202)<br />
Total deferred tax liabilities (66,688)<br />
Total net deferred tax assets and liabilities:<br />
Total net deferred tax assets—current 15,234<br />
Total net deferred tax liabilities—non-current (15,808)<br />
Total (573)<br />
2. Breakdown of items which caused the difference between<br />
the statutory tax rate and the effective tax rate after adoption<br />
of tax effect accounting<br />
Statutory rate 40.7%<br />
(Adjustment)<br />
Non-deductible items 3.8%<br />
Non-taxable items (4.8)%<br />
Inhabitants’ minimum taxes 5.2%<br />
Loss on investments under equity method 12.4%<br />
Profi t on a change in interest in an affi liate (3.9)%<br />
Adjustment due to sales of shares in an affi liate (6.8)%<br />
Other, net 1.6%<br />
Effective tax rate 48.2%<br />
<strong>2011</strong><br />
(As of March 31, <strong>2011</strong>)<br />
1. The signifi cant components of the Company’s deferred tax<br />
assets and liabilities<br />
Millions<br />
of yen<br />
Thousands of<br />
U.S. dollars<br />
Deferred tax assets:<br />
(Current)<br />
Allowance for doubtful accounts 185 2,233<br />
Accrued bonuses 7,508 90,306<br />
Enterprise tax payable 460 5,532<br />
Lease transaction 658 7,919<br />
Other 8,397 100,988<br />
Total 17,210 206,980<br />
(Non-current)<br />
Allowance for doubtful accounts 619 7,454<br />
Retirement benefi ts 42,625 512,636<br />
Unrealized gain 3,308 39,784<br />
Impairment loss 3,390 40,773<br />
Asset retirement obligations 3,294 39,625<br />
Other 9,291 111,742<br />
Total 62,530 752,018<br />
Sub-total 79,740 958,999<br />
Valuation allowance (14,582) (175,376)<br />
Total deferred tax assets 65,158 783,622<br />
Deferred tax liabilities:<br />
(Current)<br />
Reserve for deferred gains on fi xed assets (1,063) (12,793)<br />
Other (2,759) (33,191)<br />
Total (3,823) (45,984)<br />
(Non-current)<br />
Reserve for deferred gains on fi xed assets (18,852) (226,727)<br />
Gain on securities contribution to<br />
employees’ retirement benefi ts trust<br />
(20,960) (252,080)<br />
Unrealized gain on securities (18,189) (218,753)<br />
Other (2,879) (34,631)<br />
Total (60,881) (732,193)<br />
Total deferred tax liabilities (64,705) (778,178)<br />
Total net deferred tax assets—current 12,863 154,700<br />
Total net deferred tax liabilities—current (32) (396)<br />
Total net deferred tax assets—non-current 5,132 61,726<br />
Total net deferred tax liabilities—non-current (17,510) (210,585)<br />
2. Breakdown of items which caused the difference between<br />
the statutory tax rate and the effective tax rate after adoption<br />
of tax effect accounting<br />
Statutory rate 40.7%<br />
(Adjustment)<br />
Non-deductible items 4.7%<br />
Non-taxable items (5.2)%<br />
Inhabitants’ minimum taxes 5.0%<br />
Changes in valuation allowance 22.2%<br />
Difference in tax rate applicable to foreign<br />
subsidiaries (3.6)%<br />
Other, net (5.6)%<br />
Effective tax rate 58.2%<br />
51
17. Business combination<br />
2010 (From April 1, 2009 to March 31, 2010)<br />
(Business divestiture)<br />
1. Name of the company to which the business was transferred, the content of the transferred business, major reason for the business<br />
split and outline of the transaction, including the date of the business split and legal form of the split<br />
(1) Name of the company to which the business was transferred and the content of the transferred business<br />
Name of the company: JPExpress Co., Ltd.<br />
Business:<br />
Small-package delivery business<br />
Content of the business: The whole small-package delivery business<br />
(all the necessary operations from acceptance through delivery)<br />
(2) Major reason for the business split<br />
This company split was conducted in order to develop competitive products and services and provide customers with them by<br />
making best use of the brands, customer base, network, know-how and others which had been developed between the<br />
Company and Japan Post Service Co., Ltd.<br />
(3) Date of the business split<br />
April 1, 2009<br />
(4) Outline of the transaction, including the legal form of the split<br />
Absorption-type company split with the Company being the splitting company and JPExpress Co., Ltd. being the succeeding<br />
company<br />
2. Summary of accounting treatment<br />
(1) Retained earnings transferred<br />
¥2,478 million<br />
* Including earnings from the change in interest resulting from the capital increase by third party allotments conducted<br />
simultaneously with the split.<br />
(2) Adequate book values of the assets and liabilities of the business transferred, along with their details<br />
Millions of yen<br />
Current assets 192<br />
Tangible fi xed assets 10,773<br />
Intangible fi xed assets 1,736<br />
Investments and other assets 536<br />
Non-current assets 13,047<br />
Total assets 13,239<br />
Current liabilities 0<br />
Long-term liabilities 0<br />
Total liabilities 0<br />
<strong>2011</strong> (From April 1, 2010 to March 31, <strong>2011</strong>)<br />
Not applicable<br />
18. Asset retirement obligations<br />
End of <strong>2011</strong> (March 31, <strong>2011</strong>)<br />
Asset retirement obligations that are stated in consolidated balance sheets<br />
(1) Description of the asset retirement obligations<br />
Asset retirement obligations are stated in respect of the Company’s obligations to restore the premises it occupies to their original<br />
conditions under the property lease contracts for warehouses and the fi xed term land lease contracts for lease properties. Asset<br />
retirement obligations are also stated for the Company’s obligations to eliminate hazardous substances from the warehouses in<br />
which such substances are used.<br />
(2) Method for calculating the asset retirement obligations<br />
The asset retirement obligations are calculated using 0.160%–2.315% discount rate over the two to fi fty years duration of use in<br />
most cases, and estimated based on the depreciation period.<br />
52
(3) Changes in total asset retirement obligations during <strong>2011</strong><br />
Millions of yen<br />
Thousands of U.S. dollars<br />
Balance at beginning of the year (Note) 11,177 134,430<br />
Increase due to acquisition of property and equipment 172 2,070<br />
Adjustment due to passage of time 169 2,032<br />
Decrease due to performance of asset retirement<br />
obligations<br />
(179) (2,161)<br />
Other (7) (96)<br />
Balance at end of the year 11,331 136,276<br />
(Note) This balance at beginning of the year was result of the adoption of ASBJ Statement No. 18 “Accounting Standard for Asset Retirement<br />
Obligations” issued on March 31, 2008 and ASBJ Guidance No. 21 “Guidance on Accounting Standard for Asset Retirement Obligations”<br />
issued on March 31, 2008.<br />
19. Investment and rental property<br />
2010 (From April 1, 2009 to March 31, 2010)<br />
(Additional information)<br />
On November 28, 2008, the ASBJ issued ASBJ Statement No. 20 “Accounting Standard for Disclosures about Fair Value of Investment<br />
and Rental Property” and issued ASBJ Guidance No. 23 “Guidance on Accounting Standard for Disclosures about Fair Value of<br />
Investment and Rental Property.” The Company and consolidated subsidiaries (the “Group”) applied the new accounting standard and<br />
guidance effective the year ended March 31, 2010.<br />
The Company and certain consolidated subsidiaries hold some rental properties such as offi ce buildings, parking lots and land<br />
throughout the nation. Net rental profi t (rental income included in net sales less rental expenses included in cost of sales) and other<br />
losses (included in loss on disposal of noncurrent assets) on investment and rental property for the year ended March 31, 2010<br />
were ¥5,475 million and negative ¥595 million, respectively.<br />
The carrying amounts, changes in balances and market prices of such properties are as follows:<br />
Millions of yen<br />
Carrying amount<br />
March 31, 2009 Increase (Decrease) March 31, 2010<br />
Fair value<br />
as of March 31, 2010<br />
34,996 (900) 34,095 101,591<br />
(Notes) 1. Carrying amount recognized in the balance sheet is stated at acquisition cost less accumulated depreciation.<br />
2. Decrease during the year ended March 31, 2010 primarily consists of depreciation and disposal of properties.<br />
3. Fair value of properties as of March 31, 2010 is measured by the real estate appraisal reports from the real estate appraisers for signifi cant<br />
properties.<br />
<strong>2011</strong> (From April 1, 2010 to March 31, <strong>2011</strong>)<br />
The Company and certain consolidated subsidiaries hold some rental properties such as offi ce buildings, parking lots and land<br />
throughout the nation. Net rental profi t (rental income included in net sales less rental expenses included in cost of sales) and other<br />
losses (included in loss on disposal of noncurrent assets) on investment and rental property for the year ended March 31, <strong>2011</strong><br />
were ¥5,556 million (US$66,826 thousand) and ¥134 million (US$1,617 thousand), respectively.<br />
The carrying amounts, changes in balances and market prices of such properties are as follows:<br />
Millions of yen<br />
Carrying amount<br />
Fair value<br />
March 31, 2010 Increase (Decrease) March 31, <strong>2011</strong><br />
as of March 31, <strong>2011</strong><br />
34,095 8,354 42,450 112,901<br />
Thousands of U.S. dollars<br />
Carrying amount<br />
March 31, 2010 Increase (Decrease) March 31, <strong>2011</strong><br />
Fair value<br />
as of March 31, <strong>2011</strong><br />
410,044 100,480 510,524 1,357,804<br />
(Notes) 1. Carrying amount recognized in the balance sheet is stated at acquisition cost less accumulated depreciation.<br />
2. Increase during the year ended March 31, <strong>2011</strong> primarily consists of increased properties.<br />
3. Fair value of properties as of March 31, <strong>2011</strong> is measured by the real estate appraisal reports from the real estate appraisers for signifi cant<br />
properties.<br />
53
20. Segment information<br />
Industry segment information<br />
Distribution &<br />
Transportation<br />
Millions of yen<br />
2010 (From April 1, 2009 to March 31, 2010)<br />
Goods Sales Other Sub-total<br />
Adjustment &<br />
eliminations<br />
I Revenues & operating income<br />
Revenues<br />
(1) Revenues from external<br />
customers<br />
1,284,772 266,211 18,649 1,569,633 — 1,569,633<br />
(2) Intersegment revenues<br />
or money transfers<br />
3,600 60,126 15,270 78,996 (78,996) —<br />
Total 1,288,373 326,337 33,919 1,648,630 (78,996) 1,569,633<br />
Operating expenses 1,256,001 320,446 32,500 1,608,949 (76,851) 1,532,098<br />
Operating income 32,371 5,890 1,418 39,680 (2,145) 37,535<br />
II Identifi able assets, depreciation & amortization,<br />
loss on impairment and capital expenditure<br />
Identifi able assets<br />
999,776 232,881 43,743 1,276,401 (74,599) 1,201,801<br />
Depreciation & amortization 45,880 6,366 764 53,011 (565) 52,446<br />
Loss on impairment 96 207 160 464 — 464<br />
Capital expenditure 47,522 6,827 1,995 56,346 (66) 56,279<br />
(Notes) 1. Method of segmentation and names of main lines of business and goods.<br />
(1) Method of segmentation: Three segments including “Distribution and Transportation,” “Goods Sales,” and “Other.”<br />
(2) Names of main lines of business and goods<br />
Business segment<br />
Main lines of business<br />
Distribution and Railway forwarding, motor transportation, marine transportation, harbor transportation, air freight forwarding,<br />
Transportation warehousing, heavy haulage and construction, in-factory work and other transport operations<br />
Sales and leasing of distribution equipment, wrapping and packing materials, vehicles, petroleum and LP gas, etc.,<br />
Goods Sales<br />
vehicle maintenance services and insurance sales<br />
Mediation, planning and designing, and management of real estate, investigation and research, money lending,<br />
Other<br />
automobile operation instruction and employee dispatching<br />
2. Corporate operating expenses included in the “Adjustment & eliminations” account totaled ¥1,526 million. The most signifi cant portion of this<br />
expense relates to the corporate image advertising and the Company’s administration of group companies.<br />
3. Corporate assets included in the “Adjustment & eliminations” account totaled ¥748 million. Corporate assets mainly represent assets held by<br />
the corporate division of the Company.<br />
Geographic segment information<br />
Japan The Americas Europe<br />
Millions of yen<br />
2010 (From April 1, 2009 to March 31, 2010)<br />
Asia &<br />
Oceania<br />
Sub-total<br />
Adjustment &<br />
eliminations<br />
I Revenues & operating income<br />
Revenues<br />
(1) Revenues from external<br />
customers<br />
1,412,630 29,794 40,006 87,201 1,569,633 — 1,569,633<br />
(2) Intersegment revenues<br />
or money transfers<br />
6,248 7,922 4,717 6,629 25,517 (25,517) —<br />
Total 1,418,878 37,717 44,724 93,830 1,595,150 (25,517) 1,569,633<br />
Operating expenses 1,384,102 37,501 44,284 90,754 1,556,644 (24,546) 1,532,098<br />
Operating income 34,775 215 439 3,075 38,506 (971) 37,535<br />
II Assets 1,114,396 26,934 34,502 56,251 1,232,085 (30,283) 1,201,801<br />
(Notes) 1. Countries and regions are categorized on the basis of geographic proximity.<br />
2. Main countries and regions in segments other than Japan are as follows:<br />
(1) The Americas ...........U.S.A., Canada, South and Central America<br />
(2) Europe .....................United Kingdom, the Netherlands, Germany, and other European nations<br />
(3) Asia & Oceania .........China, Singapore, Australia, and other Asian and Oceanian nations<br />
3. Corporate operating expenses included in the “Adjustment & eliminations” account are the same as in Note 2 of the “Industry segment<br />
information.”<br />
4. Corporate assets included in the “Adjustment & eliminations” account are the same as in Note 3 of the “Industry segment information.”<br />
Total<br />
Total<br />
54
Foreign operations<br />
Millions of yen<br />
2010 (From April 1, 2009 to March 31, 2010)<br />
The Americas Europe Asia & Oceania Total<br />
I Revenue from foreign operations 63,815 65,097 153,005 281,918<br />
II Total revenue 1,569,633<br />
III Ratio to total revenue (%) 4.1 4.1 9.8 18.0<br />
(Notes) 1. Revenues from foreign operations are revenues achieved outside Japan by the Company and its consolidated subsidiaries.<br />
2. Countries and regions are categorized on the basis of geographic proximity.<br />
3. Main countries and regions in each segment are as follows:<br />
(1) The Americas ...........U.S.A., Canada, South and Central America<br />
(2) Europe .....................United Kingdom, the Netherlands, Germany and other European nations, and Africa<br />
(3) Asia & Oceania .........China, Singapore, Australia and other Asian and Oceanian nations<br />
Segment information<br />
1. Outline of the reportable segments<br />
<strong>Report</strong>able segments of the Company are its organizational units<br />
whose individual fi nancial results can be identifi ed separately, and<br />
serve as the basis and subject of regular review by the Board of<br />
Directors, for the purpose of allocating management resources<br />
and evaluating business performance.<br />
The Company’s head offi ce comprises functional<br />
headquarters including Domestic Business Headquarters,<br />
International Business Headquarters, and Sales Promotion<br />
Headquarters. Each headquarters is responsible for developing<br />
comprehensive strategies for its products and services both in<br />
Japan and abroad, and engages in business activities based on<br />
such strategies. Under each headquarters, regional general<br />
managers are appointed to cover specifi c geographic regions as<br />
well as business divisions specializing in specifi c products and<br />
services, providing a structure that allows regional management<br />
and/or concerned fi eld offi ces to make optimum business<br />
decisions on their own.<br />
Under this principle, the Company has developed a segment<br />
structure in the form of matrix comprising segments by<br />
geographical region along with segments by products and<br />
services as classifi ed based on mode of transportation such as air<br />
or marine, in which domestic Distribution and Transportation<br />
business comprises fi ve reportable segments including Combined<br />
Business, Security Transportation, Heavy Haulage and<br />
Construction, Air Freight Forwarding and Travel, and Marine and<br />
Harbor Transportation, while overseas Distribution and<br />
Transportation operations comprises four reportable segments<br />
including the Americas, Europe, East Asia, and South Asia and<br />
Oceania, besides the two reportable segments outside<br />
Distribution and Transportation operations that are Goods Sales<br />
and Other.<br />
Combined Business segment (Distribution & Transportation,<br />
domestic companies) happens to deploy subsidiaries/affi liates<br />
and branches in each geographical regions (areas), which<br />
however are still presented as one reportable segment because<br />
of their similarity in the nature of business as well as fi nancial<br />
characteristics.<br />
Also, Combined Business segment (Distribution &<br />
Transportation, domestic companies) is presented on a combined<br />
basis with Fine Arts business segment because of the similarity in<br />
the nature of business. Likewise, in Air Freight Forwarding and<br />
Travel (Distribution & Transportation, domestic companies), Air<br />
Freight Forwarding business segment is presented on<br />
a combined basis with Travel business segment. In each of<br />
the above case however, impact of the presentation on a<br />
combined basis is minimal.<br />
55
Main products and services as well as main lines of business in each reportable segment are as follows.<br />
<strong>Report</strong>able segment Main products and services Main lines of business<br />
Combined Business (Distribution &<br />
Transportation, domestic companies)<br />
Security Transportation (Distribution &<br />
Transportation, domestic companies)<br />
Heavy Haulage & Construction<br />
(Distribution & Transportation, domestic<br />
companies)<br />
Air Freight Forwarding & Travel<br />
(Distribution & Transportation, domestic<br />
companies)<br />
Marine & Harbor Transportation<br />
(Distribution & Transportation, domestic<br />
companies)<br />
The Americas (Distribution &<br />
Transportation, overseas companies)<br />
Europe (Distribution & Transportation,<br />
overseas companies)<br />
East Asia (Distribution & Transportation,<br />
overseas companies)<br />
South Asia, Oceania<br />
(Distribution & Transportation, overseas<br />
companies)<br />
Goods Sales<br />
Other<br />
Railway utilization transportation, chartered<br />
truck services, combined delivery services,<br />
moving & relocation, warehousing &<br />
distribution processing, in-factory work, real<br />
estate rental, marine & harbor transportation,<br />
fi ne arts transportation, security transportation<br />
and heavy haulage & construction<br />
Security transportation<br />
Heavy haulage & construction<br />
Air freight forwarding and travel<br />
Marine & harbor transportation, warehousing<br />
& distribution processing and moving &<br />
relocation<br />
Air freight forwarding, marine & harbor<br />
transportation, warehousing & distribution<br />
processing, moving & relocation, motor<br />
transportation and travel<br />
Air freight forwarding, marine & harbor<br />
transportation, warehousing & distribution<br />
processing, moving & relocation, motor<br />
transportation and travel<br />
Air freight forwarding, marine & harbor<br />
transportation, warehousing & distribution<br />
processing, moving & relocation, motor<br />
transportation and travel<br />
Air freight forwarding, marine & harbor<br />
transportation, warehousing & distribution<br />
processing, moving & relocation, heavy<br />
haulage & construction and travel<br />
Lease, sale of petroleum and others<br />
Other<br />
Railway forwarding, motor cargo<br />
transportation, warehousing and in-factory<br />
work<br />
Security guard business, motor cargo<br />
transportation<br />
Heavy haulage and construction<br />
Air freight forwarding and travel<br />
Marine transportation, harbor<br />
transportation and warehousing<br />
Air freight forwarding, harbor<br />
transportation, warehousing, motor cargo<br />
transportation and travel<br />
Sales and leasing of distribution equipment,<br />
wrapping and packing materials, vehicles,<br />
petroleum and LP gas, etc., vehicle<br />
maintenance services and insurance sales<br />
Mediation, planning and designing and<br />
management of real estate, investigation<br />
and research, money lending, automobile<br />
operation instruction and employee<br />
dispatching<br />
2. Method for calculating the amounts of revenues, income or loss, assets, liabilities and other items by reportable<br />
segment<br />
Accounting principle for the business segments reported is the same as stated in “Signifi cant matters serving as a basis for the<br />
presentation of consolidated fi nancial statements.”<br />
Income in each reportable segment is stated on the basis of operating income. Intersegment revenues and money transfers are<br />
based on current market price.<br />
56
3. Revenues, income (loss), assets, liabilities and other items by reportable segment<br />
2010 (From April 1, 2009 to March 31, 2010)<br />
Combined<br />
Business<br />
Security<br />
Transportation<br />
Millions of yen<br />
Distribution & Transportation<br />
Domestic companies<br />
Heavy Haulage<br />
& Construction<br />
Air Freight<br />
Forwarding &<br />
Travel<br />
Marine &<br />
Harbor<br />
Transportation<br />
Overseas companies<br />
The Americas<br />
Revenues<br />
Revenues from external customers 745,058 60,849 38,872 182,763 103,959 29,794 40,006<br />
Intersegment revenues or money<br />
transfers 5,945 26 422 1,096 6,758 7,922 4,717<br />
Total 751,004 60,875 39,294 183,860 110,717 37,717 44,724<br />
Segment income 14,735 3,654 4,242 2,640 3,345 215 439<br />
Segment assets 473,929 79,192 12,681 99,978 87,663 26,934 34,502<br />
Other items<br />
Depreciation and amortization 26,314 3,133 1,635 3,237 4,461 969 1,037<br />
Amortization of goodwill — — — — — — —<br />
Investment in associates accounted<br />
for by the equity method<br />
4,789 — — 1,000 1,015 — —<br />
Increase in property and equipment<br />
and intangible assets 26,435 5,664 544 4,516 3,641 1,596 631<br />
Europe<br />
Distribution &<br />
Transportation<br />
Overseas<br />
companies<br />
Asia & Oceania<br />
(Note 1)<br />
Millions of yen<br />
Goods Sales Other Sub-total<br />
Adjustment<br />
(Note 2)<br />
Total<br />
(Note 3)<br />
Revenues<br />
Revenues from external customers 87,201 263,066 18,061 1,569,633 — 1,569,633<br />
Intersegment revenues or money<br />
transfers 6,629 59,632 14,285 107,437 (107,437) —<br />
Total 93,830 322,699 32,347 1,677,070 (107,437) 1,569,633<br />
Segment income 3,067 5,836 1,447 39,624 (2,089) 37,535<br />
Segment assets 58,626 229,918 43,012 1,146,441 55,360 1,201,801<br />
Other items<br />
Depreciation and amortization 994 5,864 731 48,379 3,314 51,693<br />
Amortization of goodwill 632 412 13 1,057 (304) 752<br />
Investment in associates accounted<br />
for by the equity method<br />
2,643 — 2 9,452 — 9,452<br />
Increase in property and equipment<br />
and intangible assets 689 6,761 1,971 52,453 3,825 56,279<br />
(Notes) 1. Although Asia & Oceania (Distribution & Transportation, overseas companies) has been divided into East Asia (Distribution & Transportation,<br />
overseas companies) and South Asia & Oceania (Distribution & Transportation, overseas companies), due to an organization change in the year<br />
ended March 31, <strong>2011</strong>, fi gures for the previous fi scal year were undividable, and thus stated on the basis of the previous classifi cation.<br />
2. Detail of the adjustment is as follows.<br />
(1) Negative ¥2,089 million adjustment in Segment income includes negative ¥974 million elimination of intersegment income and negative<br />
¥1,526 million corporate expenses not allocated to each reportable segment. The most signifi cant portion of corporate expenses relates to<br />
the corporate image advertising and the Company’s administration of group companies.<br />
(2) ¥55,360 million adjustment in Segment assets includes negative ¥102,944 million elimination of intersegment income and ¥160,733 million<br />
corporate assets not allocated to each reportable segment. Corporate assets mainly represent cash and cash in banks, securities and<br />
noncurrent assets held by head offi ce not attributable to each reportable segment.<br />
(3) Adjustment in Depreciation and amortization represents the depreciation and amortization at head offi ce not attributable to each reportable<br />
segment.<br />
(4) Adjustment in Increase in property and equipment and intangible assets represents primarily the capital expenditures at head offi ce not<br />
attributable to each reportable segment.<br />
3. Segment income has been reconciled with operating income in consolidated fi nancial statements.<br />
57
<strong>2011</strong> (From April 1, 2010 to March 31, <strong>2011</strong>)<br />
Combined<br />
Business<br />
Security<br />
Transportation<br />
Millions of yen<br />
Distribution & Transportation<br />
Domestic companies<br />
Heavy Haulage<br />
& Construction<br />
Air Freight<br />
Forwarding &<br />
Travel<br />
Marine &<br />
Harbor<br />
Transportation<br />
Overseas companies<br />
The Americas<br />
Revenues<br />
Revenues from external customers 711,308 59,515 33,744 202,099 116,059 32,898 40,309<br />
Intersegment revenues or money<br />
transfers 6,130 26 612 1,308 8,156 9,907 4,760<br />
Total 717,439 59,542 34,356 203,408 124,216 42,806 45,069<br />
Segment income 8,381 1,806 2,685 952 5,439 1,584 1,784<br />
Segment assets 474,630 52,833 10,210 94,118 91,465 26,401 30,871<br />
Other items<br />
Depreciation and amortization 25,929 3,236 1,036 4,362 4,621 852 837<br />
Amortization of goodwill — — — — — — —<br />
Investment in associates accounted<br />
for by the equity method<br />
4,935 — — 1,005 1,082 — —<br />
Increase in property and equipment<br />
and intangible assets 28,157 2,580 536 3,476 6,323 1,264 640<br />
Europe<br />
Distribution & Transportation<br />
Overseas companies<br />
East Asia<br />
South Asia &<br />
Oceania<br />
Millions of yen<br />
Goods Sales Other Sub-total<br />
Adjustment<br />
(Note 1)<br />
Total<br />
(Note 2)<br />
Revenues<br />
Revenues from external customers 70,879 42,878 287,929 19,561 1,617,185 — 1,617,185<br />
Intersegment revenues or money<br />
transfers 6,075 2,686 64,578 16,418 120,662 (120,662) —<br />
Total 76,955 45,564 352,507 35,980 1,737,847 (120,662) 1,617,185<br />
Segment income 2,098 1,391 7,053 1,509 34,687 (3,057) 31,629<br />
Segment assets 35,836 24,782 229,119 47,715 1,117,985 29,554 1,147,539<br />
Other items<br />
Depreciation and amortization 442 589 5,415 723 48,048 3,515 51,563<br />
Amortization of goodwill 278 342 285 — 906 — 906<br />
Investment in associates accounted<br />
for by the equity method<br />
1,277 1,407 — 2 9,711 — 9,711<br />
Increase in property and equipment<br />
and intangible assets 408 1,885 8,447 1,361 55,082 1,650 56,733<br />
58
Combined<br />
Business<br />
Security<br />
Transportation<br />
Thousands of U.S. dollars<br />
Distribution & Transportation<br />
Domestic companies<br />
Heavy Haulage<br />
& Construction<br />
Air Freight<br />
Forwarding &<br />
Travel<br />
Marine &<br />
Harbor<br />
Transportation<br />
Overseas companies<br />
The Americas<br />
Revenues<br />
Revenues from external customers 8,554,526 715,761 405,825 2,430,544 1,395,790 395,656 484,780<br />
Intersegment revenues or money<br />
transfers<br />
73,732 323 7,361 15,733 98,090 119,150 57,251<br />
Total 8,628,259 716,085 413,186 2,446,278 1,493,880 514,806 542,032<br />
Segment income 100,793 21,726 32,298 11,456 65,419 19,058 21,463<br />
Segment assets 5,708,119 635,395 122,790 1,131,913 1,100,002 317,515 371,279<br />
Other items<br />
Depreciation and amortization 311,841 38,921 12,466 52,466 55,586 10,249 10,076<br />
Amortization of goodwill — — — — — — —<br />
Investment in associates accounted<br />
for by the equity method<br />
59,358 — — 12,091 13,021 — —<br />
Increase in property and equipment<br />
and intangible assets<br />
338,630 31,040 6,456 41,809 76,050 15,211 7,706<br />
Europe<br />
Distribution & Transportation<br />
Overseas companies<br />
East Asia<br />
South Asia &<br />
Oceania<br />
Thousands of U.S. dollars<br />
Goods Sales Other Sub-total<br />
Adjustment<br />
(Note 1)<br />
Total<br />
(Note 2)<br />
Revenues<br />
Revenues from external customers 852,434 515,674 3,462,767 235,251 19,449,013 — 19,449,013<br />
Intersegment revenues or money<br />
transfers<br />
73,072 32,307 776,652 197,462 1,451,139 (1,451,139) —<br />
Total 925,507 547,981 4,239,419 432,713 20,900,152 (1,451,139) 19,449,013<br />
Segment income 25,232 16,736 84,825 18,153 417,165 (36,774) 380,391<br />
Segment assets 430,984 298,051 2,755,498 573,853 13,445,404 355,430 13,800,834<br />
Other items<br />
Depreciation and amortization 5,321 7,089 65,131 8,706 577,856 42,273 620,129<br />
Amortization of goodwill 3,347 4,124 3,433 — 10,904 — 10,904<br />
Investment in associates accounted<br />
for by the equity method<br />
15,361 16,930 — 32 116,795 — 116,795<br />
Increase in property and equipment<br />
and intangible assets<br />
4,909 22,671 101,592 16,369 662,447 19,853 682,301<br />
(Notes) 1. Detail of the adjustment is as follows.<br />
(1) Negative ¥3,057 million (negative US$36,774 thousand) adjustment in Segment income includes negative ¥1,627 million (negative<br />
US$19,574 thousand) elimination of intersegment income, and negative ¥1,532 million (negative US$18,429 thousand) corporate expenses<br />
not allocated to each reportable segment. The most signifi cant portion of corporate expenses relates to the corporate image advertising and<br />
the Company’s administration of group companies.<br />
(2) ¥29,554 million (US$355,430 thousand) adjustment in Segment assets includes negative ¥105,513 million (negative US$1,268,949<br />
thousand) elimination of intersegment income, and ¥137,631 million (US$1,655,225 thousand) corporate assets not allocated to each<br />
reportable segment. Corporate assets mainly represent cash and cash in banks, securities and noncurrent assets held by head offi ce not<br />
attributable to each reportable segment.<br />
(3) Adjustment in Depreciation and amortization represents the depreciation and amortization at head offi ce not attributable to each reportable<br />
segment.<br />
(4) Adjustment in Increase in property and equipment and intangible assets represents primarily the capital expenditures at head offi ce not<br />
attributable to each reportable segment.<br />
2. Segment income has been reconciled with operating income in consolidated fi nancial statements.<br />
(Additional information)<br />
On March 27, 2009, the ASBJ revised ASBJ Statement No. 17 “Accounting Standard for Disclosures about Segments of an Enterprise<br />
and Related information” and on March 21, 2008 the ASBJ issued ASBJ Guidance No. 20 “Guidance on the Accounting Standard for<br />
Disclosures about Segments of an Enterprise and Related information.” Effective the year ended March 31, <strong>2011</strong>, the Company<br />
adopted the revised accounting standard and guidance.<br />
59
Related information<br />
<strong>2011</strong> (From April 1, 2010 to March 31, <strong>2011</strong>)<br />
1. Information regarding products and services<br />
Railway<br />
utilization<br />
transportation<br />
Combined<br />
delivery<br />
services<br />
Chartered<br />
truck<br />
services<br />
Moving &<br />
relocation<br />
Warehousing &<br />
distribution<br />
processing<br />
Millions of yen<br />
In-factory work<br />
Real estate<br />
rental<br />
Air freight<br />
forwarding<br />
Travel<br />
Marine &<br />
harbor<br />
transportation<br />
Revenues from external customers 79,185 69,078 228,825 61,010 154,473 45,558 14,414 287,179 6,402 184,343<br />
Fine arts<br />
transportation<br />
Security<br />
transportation<br />
Heavy haulage<br />
& construction<br />
Other<br />
distribution &<br />
transportation<br />
Millions of yen<br />
Lease<br />
Sales of<br />
petroleum,<br />
etc.<br />
Sales of others Other Total<br />
Revenues from external customers 3,137 76,127 45,866 50,084 46,835 164,291 80,065 20,305 1,617,185<br />
Railway<br />
utilization<br />
transportation<br />
Combined<br />
delivery<br />
services<br />
Chartered<br />
truck<br />
services<br />
Moving &<br />
relocation<br />
Thousands of U.S. dollars<br />
Warehousing &<br />
distribution<br />
processing<br />
In-factory work<br />
Real estate<br />
rental<br />
Air freight<br />
forwarding<br />
Travel<br />
Marine &<br />
harbor<br />
transportation<br />
Revenues from external customers 952,319 830,770 2,751,963 733,738 1,857,763 547,902 173,353 3,453,747 77,001 2,217,000<br />
Fine arts<br />
transportation<br />
Security<br />
transportation<br />
Heavy haulage<br />
& construction<br />
Other<br />
distribution &<br />
transportation<br />
Thousands of U.S. dollars<br />
Lease<br />
Sales of<br />
petroleum,<br />
etc.<br />
Sales of others Other Total<br />
Revenues from external customers 37,737 915,546 551,607 602,344 563,264 1,975,844 962,907 244,198 19,449,013<br />
2. Information by region<br />
(1) Revenues<br />
Millions of yen<br />
Japan The Americas Europe Asia & Oceania Total<br />
1,267,542 81,801 71,758 196,082 1,617,185<br />
Thousands of U.S. dollars<br />
Japan The Americas Europe Asia & Oceania Total<br />
15,244,052 983,779 863,000 2,358,180 19,449,013<br />
(Notes) 1. The above amounts represent revenues achieved by the Company and its consolidated subsidiaries in the countries and regions where they are<br />
located.<br />
2. Countries and regions are categorized on the basis of geographic proximity.<br />
3. Main countries and regions in each segment are as follows:<br />
(1) The Americas ...........U.S.A., Canada, South and Central America<br />
(2) Europe .....................United Kingdom, the Netherlands, Germany and other European nations, and Africa<br />
(3) Asia & Oceania .........China, Singapore, Australia and other Asian and Oceanian nations<br />
(2) Property and equipment<br />
Description is omitted because the proportion of property and equipment held in Japan exceeds 90% of the balance of property and<br />
equipment stated on the consolidated balance sheets.<br />
3. Information about major customers<br />
Description is omitted because there is no particular customer, revenue from which exceeds 10% of revenues stated on the<br />
consolidated statements of operations.<br />
Information about impairment loss of non-current assets by each reportable segment<br />
<strong>2011</strong> (From April 1, 2010 to March 31, <strong>2011</strong>)<br />
Not applicable.<br />
Information about amortization and unamortized balance of goodwill by each reportable segment<br />
<strong>2011</strong> (From April 1, 2010 to March 31, <strong>2011</strong>)<br />
Balance at end of<br />
the year<br />
Combined<br />
Business<br />
Security<br />
Transportation<br />
Domestic companies<br />
Heavy<br />
Haulage &<br />
Construction<br />
Millions of yen<br />
Distribution & Transportation<br />
Air Freight<br />
Forwarding<br />
& Travel<br />
Marine &<br />
Harbor<br />
Transportation<br />
The<br />
Americas<br />
Overseas companies<br />
Europe<br />
East Asia<br />
South Asia<br />
& Oceania<br />
— — — — — — — 513 437 367 — 1,318<br />
Goods<br />
Sales<br />
Other<br />
Total<br />
60
Balance at end of<br />
the year<br />
Combined<br />
Business<br />
Security<br />
Transportation<br />
Domestic companies<br />
Heavy<br />
Haulage &<br />
Construction<br />
Thousands of U.S. dollars<br />
Distribution & Transportation<br />
Air Freight<br />
Forwarding<br />
& Travel<br />
Marine &<br />
Harbor<br />
Transportation<br />
The<br />
Americas<br />
Overseas companies<br />
Europe<br />
East Asia<br />
South Asia<br />
& Oceania<br />
— — — — — — — 6,170 5,266 4,424 — 15,861<br />
(Note) For the amortization of goodwill, please refer to “Segment information 3. Revenues, income (loss), assets, liabilities and other items by reportable<br />
segment.”<br />
Information about gain on negative goodwill by each reportable segment<br />
<strong>2011</strong> (From April 1, 2010 to March 31, <strong>2011</strong>)<br />
Description is omitted because the amount is immaterial.<br />
Goods<br />
Sales<br />
Other<br />
Total<br />
21. Related party information<br />
2010 (From April 1, 2009 to March 31, 2010)<br />
1. Related party transactions<br />
(1) Transactions between the Company and related parties<br />
(A) Unconsolidated subsidiaries and affi liates<br />
Type Name Location<br />
Affi liate<br />
(Note 1)<br />
JPExpress<br />
Co., Ltd.<br />
Minato-ku,<br />
Tokyo<br />
Capital<br />
(Millions of<br />
yen)<br />
25,000<br />
Main line of<br />
business or<br />
occupation<br />
Small-package<br />
delivery business<br />
and its related<br />
services<br />
Ownership of<br />
voting rights<br />
14% directly<br />
owned (Note 1)<br />
Relationship<br />
—<br />
Nature of<br />
transactions<br />
Transfer of<br />
business<br />
(Note 2)<br />
Amounts of<br />
transactions<br />
(Millions of yen)<br />
Total assets<br />
transferred<br />
13,239<br />
Total liabilities<br />
transferred<br />
0<br />
Consideration<br />
13,238<br />
Earnings from a<br />
change in interest<br />
2,478<br />
Item<br />
Balance at end<br />
of the year<br />
(Millions of yen)<br />
— —<br />
(Terms and conditions of the transaction and its policies)<br />
(Notes) 1. The company is not considered to be a related party at March 31, 2010 because certain shares were transferred on October 23, 2009. The<br />
ownership at March 31, 2010 is presented above.<br />
2. This transaction was conducted in accordance with the absorption-type company split agreement on the small-package delivery business and<br />
determined based on the appraisal value and book value of the business.<br />
2. Notes to parent company or significant affiliate<br />
(1) Summary of fi nancial information of signifi cant affi liate<br />
The signifi cant affi liate of the year ended March 31, 2010 is JPExpress Co., Ltd. whose fi nancial information is as follows:<br />
Millions of yen<br />
*JPExpress Co., Ltd.<br />
Total current assets 32,347<br />
Total non-current assets 29,064<br />
Total current liabilities 33,814<br />
Total non-current liabilities 3,420<br />
Total net assets 24,176<br />
Net sales 57,114<br />
Loss before income taxes (24,417)<br />
Net loss (24,609)<br />
Because certain shares were sold on October 23, 2009 and accordingly, the company was excluded from the scope of affi liates in the third quarter<br />
of the year ended March 31, 2010, above information is based on the fi nancial data at September 30, 2009<br />
<strong>2011</strong> (From April 1, 2010 to March 31, <strong>2011</strong>)<br />
Not applicable.<br />
61
22. Per share information<br />
2010<br />
From April 1, 2009<br />
( to March 31, 2010 )<br />
Yen<br />
<strong>2011</strong><br />
From April 1, 2010<br />
( to March 31, <strong>2011</strong> )<br />
U.S. cents<br />
<strong>2011</strong><br />
From April 1, 2010<br />
( to March 31, <strong>2011</strong> )<br />
Net assets per share 464.38 448.29 539.13<br />
Net income per share 12.05 8.19 9.84<br />
(Notes) 1. Diluted net income per share is not stated because there were no residual securities.<br />
2. Basis for calculation of net assets per share is as follows:<br />
Millions of yen<br />
Thousands of U.S. dollars<br />
2010<br />
(March 31, 2010)<br />
<strong>2011</strong><br />
(March 31, <strong>2011</strong>)<br />
<strong>2011</strong><br />
(March 31, <strong>2011</strong>)<br />
Total net assets on consolidated balance sheets 495,883 479,898 5,771,475<br />
Net assets related to common stock 484,253 467,451 5,621,784<br />
Breakdown of difference:<br />
Minority interests 11,629 12,446 149,690<br />
Number of common stock issued<br />
(1,000 shares)<br />
1,062,299 1,062,299 —<br />
Treasury stock of common stock<br />
(1,000 shares)<br />
19,500 19,559 —<br />
Number of common stock used to calculate<br />
net assets per share (1,000 shares)<br />
1,042,798 1,042,740 —<br />
3. Basis for calculation of net income per share is as follows:<br />
Millions of yen<br />
Thousands of U.S. dollars<br />
2010<br />
From April 1, 2009<br />
( to March 31, 2010 )<br />
<strong>2011</strong><br />
From April 1, 2010<br />
( to March 31, <strong>2011</strong> )<br />
<strong>2011</strong><br />
From April 1, 2010<br />
( to March 31, <strong>2011</strong> )<br />
Net income per share<br />
Net Income 12,566 8,541 102,723<br />
Net income related to common stock 12,566 8,541 102,723<br />
Weighted average number of common stock<br />
during the year (1,000 shares)<br />
1,042,827 1,042,770 —<br />
23. Significant subsequent events<br />
2010 (From April 1, 2009 to March 31, 2010)<br />
Not applicable.<br />
<strong>2011</strong> (From April 1, 2010 to March 31, <strong>2011</strong>)<br />
Not applicable.<br />
24. Supplementary schedule<br />
Schedule of bonds<br />
Issuer Name of bond Issuance date<br />
Balance as of<br />
March 31, 2010<br />
Millions of yen<br />
Balance as of<br />
March 31, <strong>2011</strong><br />
Thousands of<br />
U.S. dollars<br />
Balance as of<br />
March 31, <strong>2011</strong><br />
Interest rate<br />
(%)<br />
Collateral<br />
NIPPON 3rd Unsecured January 30,<br />
January 30,<br />
20,000 20,000 240,529 1.59 Unsecured<br />
EXPRESS Straight Bonds 2008<br />
2018<br />
CO., LTD. 4th Unsecured<br />
Straight Bonds<br />
June 1, 2009 15,000 15,000 180,396 1.12 Unsecured May 30, 2014<br />
5th Unsecured<br />
Straight Bonds<br />
June 1, 2009 15,000 15,000 180,396 1.82 Unsecured May 31, 2019<br />
Total — — 50,000 50,000 601,322 — — —<br />
(Note) The repayment schedule of bonds for fi ve years subsequent to March 31, <strong>2011</strong>, is summarized as follows:<br />
Millions of yen<br />
Thousands of U.S. dollars<br />
Due in one year<br />
or less<br />
Due after one<br />
year through<br />
two years<br />
Due after two<br />
years through<br />
three years<br />
Due after three<br />
years through<br />
four years<br />
Due after four<br />
years through<br />
fi ve years<br />
Due in one year<br />
or less<br />
Due after one<br />
year through<br />
two years<br />
Due after two<br />
years through<br />
three years<br />
Due after three<br />
years through<br />
four years<br />
Maturity<br />
Due after four<br />
years through<br />
fi ve years<br />
— — — 15,000 — — — — 180,396 —<br />
62
Schedule of loans<br />
Category<br />
Balance as of March<br />
31, 2010<br />
(Millions of yen)<br />
Balance as of March<br />
31, <strong>2011</strong><br />
(Millions of yen)<br />
Balance as of<br />
March 31, <strong>2011</strong><br />
(Thousands of U.S. dollars)<br />
Average<br />
interest rate<br />
(%)<br />
Due date<br />
Short-term loans payable 6,834 3,375 40,590 1.1 —<br />
Current portion of long-term loans payable 104,667 46,550 559,835 1.2 —<br />
Current portion of lease obligation 842 730 8,781 — —<br />
Long-term loans payable<br />
Final due date:<br />
145,127 199,494 2,399,210 1.1<br />
(excluding current portion)<br />
September 17, 2029<br />
Lease obligation<br />
Final due date:<br />
3,737 3,116 37,479 —<br />
(excluding current portion)<br />
August 2, 2029<br />
Other interest-bearing debt<br />
Commercial paper (current portion) 7,000 — — — —<br />
In-house savings deposits by employees 29,932 29,670 356,833 0.6 —<br />
Current portion of liabilities on transfer of<br />
long-term receivables<br />
675 54 650 1.2 —<br />
Liabilities on transfer of long-term<br />
receivables (excluding current portion)<br />
54 — — — —<br />
Total 298,871 282,991 3,403,380 — —<br />
(Notes) 1. Average interest rates are stated at weighted average interest rates on the average balance of borrowings for the year. However, average<br />
interest rates are not stated for either current portion of lease obligation or lease obligation (excluding current portion), since the interest portion<br />
in the total lease payment has been allocated to each fi scal year by the straight line method.<br />
2. The repayment schedule of long-term loans payable and lease obligation (excluding current portion) for fi ve years subsequent to March 31,<br />
<strong>2011</strong>, is summarized as follows:<br />
Millions of yen<br />
Thousands of U.S. dollars<br />
Due after one<br />
year through<br />
two years<br />
Due after two<br />
years through<br />
three years<br />
Due after three<br />
years through<br />
four years<br />
Due after four<br />
years through<br />
fi ve years<br />
Due after one<br />
year through<br />
two years<br />
Due after two<br />
years through<br />
three years<br />
Due after three<br />
years through<br />
four years<br />
Due after four<br />
years through<br />
fi ve years<br />
Long-term loans payable 70,546 41,641 10,567 31,775 848,426 500,795 127,095 382,141<br />
Lease obligation 604 472 370 854 7,271 5,676 4,450 10,277<br />
3. Deposits in the in-house savings deposits by employees are recorded as Deposits from employees in the consolidated balance sheets.<br />
4. Current portion of liabilities on transfer of long-term receivables is included in “Other” under current liabilities in the consolidated balance sheets.<br />
Schedule of asset retirement obligations<br />
Description is omitted because the amounts of asset retirement obligations at the end of the year ended March 31, <strong>2011</strong> and the year<br />
immediately preceding the year ended March 31, <strong>2011</strong> are both less than one hundredth of the total of liabilities and net assets of the<br />
respective fi scal years.<br />
(2) Other<br />
Quarterly information on revenues, etc. in <strong>2011</strong><br />
Millions of yen<br />
1Q 2Q 3Q 4Q<br />
From July 1, 2010 to From October 1, 2010<br />
September 30, 2010 to December 31, 2010<br />
From April 1, 2010 to<br />
June 30, 2010<br />
From January 1, <strong>2011</strong><br />
to March 31, <strong>2011</strong><br />
Revenues 398,552 405,811 409,103 403,717<br />
Income (loss) before income taxes and<br />
minority interests<br />
(4,499) 13,393 10,900 3,197<br />
Net income (loss) (2,089) 6,357 5,834 (1,561)<br />
Net income (loss) per share (yen) (2.00) 6.10 5.60 (1.50)<br />
Thousands of U.S. dollars<br />
1Q 2Q 3Q 4Q<br />
From July 1, 2010 to From October 1, 2010<br />
September 30, 2010 to December 31, 2010<br />
From April 1, 2010 to<br />
June 30, 2010<br />
From January 1, <strong>2011</strong><br />
to March 31, <strong>2011</strong><br />
Revenues 4,793,176 4,880,474 4,920,067 4,855,294<br />
Income (loss) before income taxes and<br />
minority interests<br />
(54,116) 161,075 131,090 38,456<br />
Net income (loss) (25,129) 76,454 70,174 (18,775)<br />
Net income (loss) per share (U.S. dollars) (0.02) 0.07 0.07 (0.02)<br />
63
64<br />
<strong>Report</strong> of Independent Auditors
Global Network<br />
The Americas<br />
NIPPON EXPRESS U.S.A., INC.<br />
590 Madison Avenue, 24th Floor<br />
New York, NY 10022, U.S.A.<br />
NEX TRANSPORT, INC.<br />
13900 State Route 287<br />
East Liberty, OH 43319, U.S.A.<br />
NIPPON EXPRESS TRAVEL USA, INC.<br />
8 California Street, 8th Floor<br />
San Francisco, CA 94111, U.S.A.<br />
NIPPON EXPRESS CANADA, LTD.<br />
6250 Edwards Boulevard, Mississauga<br />
Ontario L5T 2X3, Canada<br />
NITTSU DO BRASIL COMERCIAL, LTDA.<br />
Rua Fortaleza 53, Bela Vista<br />
São Paulo, SP, CEP 01325-010, Brazil<br />
NIPPON EXPRESS DE MEXICO, S.A. DE C.V.<br />
Avenida Michoacan No. 20, Col. Renovacion<br />
Del. Iztapalapa Parque Industrial FINSA Nave #5<br />
Mexico D.F., C.P. 09209, Mexico<br />
NEX GLOBAL LOGISTICS DE MEXICO, S.A. DE C.V.<br />
Blvd. Bellas Artes #20240 B & C<br />
Ciudad Industrial<br />
Delegación Mesa de Otay, Tijuana<br />
Baja California, C.P. 22444, Mexico<br />
NIPPON EXPRESS DO BRASIL<br />
Rua Fortaleza 53, Bela Vista<br />
São Paulo, SP, CEP 01325-010, Brazil<br />
Europe<br />
NIPPON EXPRESS (DEUTSCHLAND) GMBH<br />
Marie-Bernays-Ring 23, 41199 Möenchengladbach<br />
F.R. Germany<br />
NIPPON EXPRESS (RUSSIA) LIMITED LIABILITY COMPANY<br />
2nd Hutorskaya st. 38A, Bldg. No. 23<br />
Moscow 127287, Russia<br />
NEX LOGISTICS EUROPE GMBH<br />
Marie-Bernays-Ring 23, 41199 Möenchengladbach<br />
F. R. Germany<br />
NIPPON EXPRESS (U.K.) LTD.<br />
Heathrow 360<br />
2 Millington Road, Hayes, Middlesex UB3 4AZ, U.K.<br />
NIPPON EXPRESS (IRELAND) LTD.<br />
Unit 6, Plato Business Park, Damastown<br />
Mulhuddart, Dublin 15, Ireland<br />
NIPPON EXPRESS (NEDERLAND) B.V.<br />
Cessnalaan 24, 1119 NL Schiphol-Rijk, The Netherlands<br />
NIPPON EXPRESS EURO CARGO B.V.<br />
Cessnalaan 24, 1119 NL Schiphol-Rijk, The Netherlands<br />
NIPPON EXPRESS (BELGIUM) N.V./S.A.<br />
Brucargo Bldg. 723, 1931 Zaventem, Belgium<br />
NIPPON EXPRESS FRANCE, S.A.<br />
1, Rue Du Chapelier, B.P. 18177<br />
95702 Roissy Aeroport Charles De Gaulle, France<br />
NIPPON EXPRESS (ITALIA) S.R.L.<br />
Via Londra 12, 20090 Segrate (MI), Italy<br />
NIPPON EXPRESS (SCHWEIZ) AG<br />
Grindel Strasse 19, 8303 Bassersdorf, Switzerland<br />
NIPPON EXPRESS DE ESPAÑA, S.A.<br />
Centro de Carga Aerea, Aeropuerto de Barajas<br />
Parcela 2.1, Nave 2, 28042 Madrid, Spain<br />
NIPPON EXPRESS PORTUGAL S.A.<br />
Aeroporto De Lisboa, Edifi cio 125, Piso 3<br />
Gab 6, 1700 Lisbon, Portugal<br />
NIPPON EXPRESS (MIDDLE EAST) L.L.C.<br />
c/o Airlink Jebel Ali Logistics Centre, P.O. Box 17341<br />
Jebel Ali, Dubai, United Arab Emirates<br />
NIPPON EXPRESS (ISTANBUL) GLOBAL LOGISTICS A.S.<br />
Istanbul Dunya Ticaret Merkezi A2 Block Kat. 3<br />
No : 162, 34149 Sevketiye Mh.<br />
Bakirkoy, Istanbul, Turkey<br />
65
East Asia<br />
NIPPON EXPRESS (H.K.) CO., LTD.<br />
1101 Chinachem Golden Plaza<br />
77 Mody Road, Tsim Sha Tsui East<br />
Kowloon, Hong Kong<br />
NIPPON EXPRESS (SHENZHEN) CO., LTD.<br />
B 105-36 Futian Free Trade Zone, Shenzhen P.R.C.<br />
NIPPON EXPRESS (ZHUHAI) CO., LTD.<br />
No.1 Ping Dong 5 Road<br />
Nan Pin High-Technology Industry Area<br />
Zhuhai, Guangdong 519060, P.R.C.<br />
NIPPON EXPRESS (SOUTH CHINA) CO., LTD.<br />
Room1312, Hongchang Plaza, Shennan East Road<br />
Luohu, Shenzhen 518002, P.R.C<br />
NIPPON EXPRESS (CHINA) CO., LTD.<br />
Room E508-513, ACLP International Building<br />
No. 566 Shunping Road, Shunyi District<br />
Beijing 101300, P.R.C.<br />
NIPPON EXPRESS CARGO SERVICE (SHENZHEN) CO., LTD.<br />
2F, West Side, Nippon Express Warehouse<br />
Yantain Port Free Trade Zone<br />
Shenzhen 518083, P.R.C.<br />
SHANGHAI e-TECHNOLOGY CO., LTD.<br />
3F, 126 Jiangchang No. 3 Road, Shanghai 200436, P.R.C.<br />
NITTSU SINOTRANS LOGISTIC DALIAN LTD.<br />
No. 6 Haitian Road<br />
Free Trade Zone of Dalian<br />
Dalian, 116600, P.R.C.<br />
NIPPON EXPRESS (SHANGHAI) CO., LTD.<br />
C-12-11F, Shanghai Mart No. 2299<br />
Yan-an Road West<br />
Shanghai 200336, P.R.C.<br />
NEX GLOBAL LOGISTICS KOREA CO., LTD.<br />
11F Kyobo Securities B/D<br />
26-4 Yeouido-Dong<br />
Yeoungdeungpo-Gu, Seoul<br />
150-737, Republic of Korea<br />
NIPPON EXPRESS (TAIWAN) CO., LTD.<br />
14 Fl., No. 285, Sec. 4, Chung Hsiao E. Road, Da-an District<br />
Taipei City 10692, Taiwan, R.O.C.<br />
NIPPON EXPRESS GLOBAL LOGISTICS<br />
(SHANGHAI) CO., LTD.<br />
11, De Bao Lu, Wai Gao Qiao Free Trade Zone<br />
Shanghai 200131, P.R.C.<br />
NIPPON EXPRESS (XIAMEN) CO., LTD.<br />
No. 23-1B, Xiangxing 1Road, Xiangyu Free Trade Zone<br />
Xiamen 361006, P.R.C.<br />
NIPPON EXPRESS (JIAXING) CO., LTD.<br />
Rm, 415, BoYuang Bldg, No. 6 Dong Fang Road<br />
ZhaPu Development Zone,<br />
Jiaxing, Zhejiang, 314201, P.R.C.<br />
SHANGHAI NITTSU PULING LOGISTICS CO., LTD.<br />
No. 333 Ke Yuan Road, Pudong New Area<br />
Shanghai 201203 P.R.C.<br />
NIPPON EXPRESS (SUZHOU) CO., LTD<br />
No. 622 Changjiang Road<br />
Suzhou New District, Suzhou<br />
Jiangsu Province 215011, P.R.C.<br />
66
South Asia & Oceania<br />
NIPPON EXPRESS (SINGAPORE) PTE., LTD.<br />
40 Alps Avenue, Singapore 498781<br />
NIPPON EXPRESS (AUSTRALIA) PTY., LTD.<br />
Airgate Business Park, 291 Coward Street<br />
Mascot, N.S.W. 2020, Australia<br />
NIPPON EXPRESS (NEW ZEALAND) LTD.<br />
37 Andrew Baxter Drive, Airport Oaks, Mangere<br />
(P.O. Box 73035, Auckland Int’l Airport) New Zealand<br />
NIPPON EXPRESS (MALAYSIA) SDN, BHD.<br />
10th Floor, West Tower, Wisma Consplant 1, No. 2<br />
Jalan SS16/4 47500 Subang Jaya<br />
Selangor Darul Ehsan, Malaysia<br />
NITTSU TRANSPORT SERVICE (M) SDN, BHD.<br />
Lot 4286, Batu 12, Jalan Balakong, 43300 Sri Kembangan<br />
Selangor Darul Ehsan, Malaysia<br />
NIPPON EXPRESS (PHILIPPINES) CORPORATION<br />
No. 8 Johann St., Bgry. Ibayo, Pascor Drive, Paranaque City<br />
Metro Manila, Philippines<br />
NEP LOGISTICS, INC.<br />
Unit 1 Lot 10 Phase 4, East Science Ave.<br />
Laguna Technopark, Inc. Binan<br />
Laguna, Philippines<br />
HI-TECH NITTSU (THAILAND) CO., LTD.<br />
Lake Rajada Offi ce Complex,193/88<br />
21st Fl., Rachadapisek Road, Klong-Toey, Bangkok, 10110<br />
Thailand<br />
NIPPON EXPRESS (THAILAND) CO., LTD.<br />
3195/16 11th Floor, Vibulthani Tower 1, Rama 4 Road<br />
Klong Ton, Klong Toey Bangkok, 10110, Thailand<br />
NIPPON EXPRESS ENGINEERING (THAILAND) CO., LTD.<br />
3195/16 11th Floor, Vibulthani Tower 1, Rama 4 Road<br />
Klong Ton, Klong Toey Bangkok, 10110, Thailand<br />
TBSC LOGISTICS CO., LTD<br />
14/3 Phaholyothin Road, Tambol Klongnung, Amphur Klongluang<br />
Pathumthani 12120, Thailand<br />
PT. NIPPON EXPRESS INDONESIA<br />
Soewarna Business Park Block J lot 12<br />
Bandara International Soekarno-Hatta<br />
Jakarta, 19110, Republic of Indonesia<br />
P.T. NITTSU LEMO INDONESIA LOGISTIK<br />
Jl. Raya Cakung Cilincing Kav. 14<br />
Cakung-Timur, Cakung, Jakarta<br />
13910, Republic of Indonesia<br />
NIPPON EXPRESS (INDIA) PRIVATE LIMITED<br />
‘Logistics Park’, Plot No. 7, Road No. 10<br />
Export Promotion Indl. Park<br />
Whitefi eld, Bangalore-560066, Republic of India<br />
NIPPON EXPRESS (VIETNAM) CO., LTD.<br />
R.5.3 E-TOWN, 364 Cong Hoa Street, Tan Binh District<br />
Ho Chi Minh City,<br />
Socialist Republic of Vietnam<br />
Representative Offices<br />
Moscow Representative Office<br />
2nd Hutorskaya St. 38A, Bldg. No. 23<br />
Moscow 127287, Russia<br />
Johannesburg Representative Office<br />
11 Pomona Road, Cnr. Hawthone Road<br />
Kempton Park 1619, South Africa<br />
Seoul Representative Office<br />
c/o The Korea Express Co., Ltd.<br />
58-12, Seosomun-Dong, Chung-Ku, Seoul, 100-814, Republic of Korea<br />
Pusan Representative Office<br />
Korea Express Bldg., Room No. 909<br />
1211-1, Choryang-Dong, Dong-Ku, Pusan, 601-714, Republic of Korea<br />
Dhaka Representative Office<br />
SPL Western Tower, 502, Plot No. 186<br />
Gulshan-Tejgaon Link Road, Tejgaon Industrial Area<br />
Dhaka-1208, Bangladesh<br />
67
Company Information<br />
(As of March 31, <strong>2011</strong>)<br />
Name<br />
Headquarters<br />
Nippon Express Co., Ltd.<br />
1-9-3, Higashi Shimbashi, Minato-ku,<br />
Tokyo 105-8322, Japan<br />
Tel: +81 (3) 6251-1111<br />
Formal establishment October 1, 1937<br />
Paid-in capital<br />
¥70,175 million<br />
Employees 36,746<br />
URL<br />
(Japanese) http://www.nittsu.co.jp/<br />
(English) http://www.nipponexpress.com/<br />
Areas of operation<br />
1 Rail transportation business<br />
2 Motor transportation business<br />
3 Motor transportation business using<br />
third-party resources<br />
4 Marine transportation business<br />
5 Coastal shipping business<br />
6 Harbor transportation business<br />
7 Marine transportation business using<br />
third-party resources<br />
8 Air freight forwarding business<br />
9 Other transportation businesses and those<br />
using third-party resources other than the above<br />
10 Cargo transportation agency business<br />
11 Warehousing business<br />
12 Construction business<br />
13 Customs brokerage business<br />
14 Express clearing business<br />
15 Air transportation agency business<br />
16 Damage insurance agency business<br />
17 Packing and packaging business<br />
18 Packing, presentation and storage business for<br />
pharmaceuticals, quasi-pharmaceuticals, cosmetics<br />
and medical equipment<br />
19 Travel business<br />
20 Transportation, erection and installation of heavy<br />
cargoes, and any incidental business thereto<br />
21 Sales and purchases, leasing and letting of<br />
immovables, and any incidental business thereto<br />
22 Security services business<br />
23 General worker dispatching business<br />
24 Industrial waste disposal service<br />
25 Special correspondence delivery service<br />
26 Collection and processing of information about the<br />
logistics industry, and any incidental business thereto<br />
27 Business incidental to each and every item mentioned<br />
above<br />
28 Investments in and loans for each and every item<br />
mentioned above<br />
68
Share Information<br />
(As of March 31, <strong>2011</strong>)<br />
Stock listing<br />
Tokyo, Osaka<br />
Number of shares Total number of shares authorized 3,988,000,000<br />
Total number of shares issued 1,062,299,281<br />
Number of shareholders 85,765<br />
Stock transfer agent<br />
Mitsubishi UFJ Trust and Banking Corporation<br />
Distribution of shares<br />
By type of shareholder<br />
Proportion of shares held<br />
Individuals, others 97.7%<br />
Financial institutions 46.7%<br />
Other corporate 1.5%<br />
Overseas corporate 22.7%<br />
85,765<br />
shareholders<br />
Overseas corporate 0.5%<br />
Financial institutions 0.2%<br />
1,062,299<br />
thousands of shares<br />
Individuals, others 21.4%<br />
Other corporate 6.0%<br />
Financial instruments<br />
and exchange dealers 0.1%<br />
Treasury stock 0.0%<br />
Treasury stock 1.8%<br />
Financial instruments<br />
and exchange dealers 1.4%<br />
Major shareholders<br />
Number of shares held<br />
(Thousands of shares)<br />
Investment ratio<br />
(%)<br />
The Master Trust Bank of Japan, Ltd. (Account in Trust) 99,936 9.6<br />
Asahi Mutual Life Insurance Company 65,464 6.3<br />
Japan Trustee Services Bank, Ltd. (Account in Trust) 52,682 5.1<br />
Nipponkoa Insurance Co., Ltd. 50,294 4.8<br />
Mizuho Corporate Bank, Ltd. 41,477 4.0<br />
Nippon Express Employees’ Shareholding Association 32,434 3.1<br />
Japan Trustee Services Bank, Ltd. (Account in Trust No. 4) 22,897 2.2<br />
The Bank of Tokyo-Mitsubishi UFJ, Ltd. 20,554 2.0<br />
SSBT OD05 OMNIBUS ACCOUNT - TREATY CLIENTS 18,012 1.7<br />
Japan Trustee Services Bank, Ltd. (Account in Trust No. 9) 17,031 1.6<br />
Stock price movement<br />
(Yen)<br />
700<br />
600<br />
500<br />
400<br />
300<br />
200<br />
100<br />
0<br />
(Thousands<br />
of shares)<br />
150,000<br />
120,000<br />
90,000<br />
60,000<br />
30,000<br />
2008<br />
4<br />
2009<br />
4<br />
2010<br />
4<br />
<strong>2011</strong><br />
3<br />
0<br />
69
1-9-3, Higashi-Shimbashi, Minato-ku, Tokyo 105-8322, Japan<br />
Phone: +81 (3) 6251-1111<br />
URL: (Japanese) http://www.nittsu.co.jp/<br />
(English) http://www.nipponexpress.com/<br />
Printed in Japan<br />
September <strong>2011</strong>


![Business Report for the 102nd Term [PDF 718KB] - Nippon Express](https://img.yumpu.com/46285896/1/184x260/business-report-for-the-102nd-term-pdf-718kb-nippon-express.jpg?quality=85)
![CSR Report 2010 [PDF 5764KB] - Nippon Express](https://img.yumpu.com/45662405/1/184x260/csr-report-2010-pdf-5764kb-nippon-express.jpg?quality=85)