Voltage Sag Mitigation - University of Wollongong
Voltage Sag Mitigation - University of Wollongong
Voltage Sag Mitigation - University of Wollongong

You also want an ePaper? Increase the reach of your titles
YUMPU automatically turns print PDFs into web optimized ePapers that Google loves.
e n d e a v o u r e n e r g y<br />
power quality & reliability centre<br />
Endeavour Energy Power Quality & Reliability Centre<br />
<strong>Voltage</strong> <strong>Sag</strong><br />
<strong>Mitigation</strong><br />
Technical Note 11<br />
August 2012
Table <strong>of</strong> Contents<br />
1. Executive Summary 4<br />
2. Introduction 4<br />
2.1. What is a <strong>Voltage</strong> <strong>Sag</strong>? 4<br />
2.2 Measurement & Characterisation <strong>of</strong> <strong>Voltage</strong> <strong>Sag</strong>s 4<br />
3. Impact and Cost <strong>of</strong> <strong>Voltage</strong> <strong>Sag</strong>s 5<br />
4. Characteristic <strong>of</strong> <strong>Voltage</strong> <strong>Sag</strong>s in Australia 6<br />
5. <strong>Voltage</strong> <strong>Sag</strong> <strong>Mitigation</strong> Technologies 7<br />
5.1. Coil Hold-In Devices 7<br />
5.2. Ferroresonant Transformer 7<br />
5.3. Uninterruptible Power Supply (UPS) 7<br />
5.4. Flywheel and Motor-Generator (MG) 8<br />
5.5. Dynamic <strong>Voltage</strong> Restorer (DVR) 9<br />
5.6. Static Var Compensator (SVC) 10<br />
5.7. <strong>Sag</strong> Pro<strong>of</strong>ing Transformers 10<br />
5.8. Static Transfer Switch (STS) 11<br />
6. Energy Storage Technologies 11<br />
6.1. Flywheels 11<br />
6.2. Batteries 11<br />
6.3. Capacitors 11<br />
6.4. Superconducting Magnetic Energy Storage (SMES) 12<br />
7. Cost <strong>of</strong> <strong>Sag</strong> <strong>Mitigation</strong> Technologies 12<br />
7.1. Cost <strong>of</strong> <strong>Mitigation</strong> Technologies 12<br />
7.2. Comparison <strong>of</strong> Costs <strong>of</strong> Storage Technologies 12<br />
8. Conclusion 13<br />
9. References 13<br />
Page 3
1. Executive Summary<br />
This technical note discusses voltage sags including characterisation, causes, measurement and financial<br />
impact. Techniques which may be utilised to mitigate voltage sags are described and the advantages and<br />
disadvantages <strong>of</strong> each technology are discussed. It should be noted that the voltage sag mitigation techniques<br />
examined are limited to solutions involving the use <strong>of</strong> equipment designed for this task at the plant/equipment<br />
level. Other mitigation strategies such as network improvement along with improving equipment immunity have<br />
not been considered. Finally a comparison <strong>of</strong> the costs <strong>of</strong> each voltage sag mitigation technology is given.<br />
2. Introduction<br />
2.1. What is a <strong>Voltage</strong> <strong>Sag</strong>?<br />
A voltage sag, sometimes known as a voltage dip, is a short term reduction in the rms voltage. The IEC<br />
electrotechnical vocabulary, IEC 60050 [1], defines a voltage sag as any “sudden reduction <strong>of</strong> the voltage at a point in<br />
the electrical system, followed by voltage recovery after a short period <strong>of</strong> time, from half a cycle to a few seconds”.<br />
<strong>Voltage</strong> sags are characterised by their duration and depth. Duration is the length <strong>of</strong> time for which the voltage<br />
remains below a threshold. The concept <strong>of</strong> depth is somewhat a misnomer as a sag is characterised by the<br />
retained voltage, that is the voltage which persists during the sag, as opposed to the voltage decrease or ‘lost’<br />
voltage. While the IEC definition does not give a set <strong>of</strong> definitive durations or level <strong>of</strong> retained voltage that must<br />
be observed for a disturbance to be classified as a voltage sag, IEEE Std 1159 [2] defines a voltage sag as a<br />
variation in the rms voltage <strong>of</strong> duration greater than ½ a cycle and less than 1 minute with a retained voltage <strong>of</strong><br />
between 10 % and 90 % <strong>of</strong> nominal. This is the generally accepted definition <strong>of</strong> a voltage sag. Any disturbance<br />
that persists for less than ½ cycle is considered transient phenomena while voltage variations or disturbances <strong>of</strong><br />
duration greater than 1 minute with retained voltages <strong>of</strong> less than 90 % <strong>of</strong> nominal may be considered as either<br />
sustained undervoltages or interruptions. <strong>Voltage</strong> sags are caused by large currents interacting with network<br />
impedances. The two main causes <strong>of</strong> voltage sags are network faults and the starting <strong>of</strong> equipment which draw<br />
large currents, particularly direct-on-line motors.<br />
2.2. Measurement & Characterisation <strong>of</strong> <strong>Voltage</strong> <strong>Sag</strong>s<br />
<strong>Voltage</strong> sags are measured using specialised power quality monitoring instrumentation. The instrumentation<br />
must be configured with a sag threshold voltage. That is, a voltage level that will trigger a sag capture when<br />
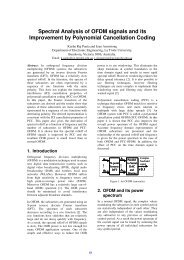
the rms voltage falls below it. <strong>Voltage</strong> sags are<br />
characterised by reporting the duration for which<br />
the voltage variation persisted below the sag<br />
threshold combined with the maximum reduction<br />
in rms voltage, also known as depth. The depth is<br />
reported as the retained voltage. Figure 1 shows a<br />
graphical representation <strong>of</strong> a voltage sag including<br />
the sag threshold and the parameters (duration,<br />
retained voltage) used to report the sag. Note the<br />
Figure 1: Example <strong>of</strong> a <strong>Voltage</strong> <strong>Sag</strong><br />
Page 4
use <strong>of</strong> a hysteresis value in Figure 1; this value is used to prevent voltage levels which are close to the sag threshold<br />
crossing the threshold multiple times and triggering multiple sags which are basically due to the same event.<br />
The theory <strong>of</strong> measurement, characterisation and reporting <strong>of</strong> voltage sags is considerably more complex than<br />
the basic overview given in this technical note. A detailed examination <strong>of</strong> this topic is beyond the scope <strong>of</strong> this<br />
technical note and readers are referred to [3] and [4] for further information.<br />
3. Impact & Cost <strong>of</strong> <strong>Voltage</strong> <strong>Sag</strong>s<br />
There is a strong argument that can be made to claim that voltage sags are the most costly <strong>of</strong> all power quality<br />
disturbances. While perhaps not as costly as interruptions, voltage sags are much more prevalent and in some<br />
cases may have the same impact as a supply interruption. Relatively shallow voltage sags can lead to the<br />
disruption <strong>of</strong> manufacturing processes due to equipment being unable to operate correctly at the reduced voltage<br />
levels. Industrial equipment such as variable speed drives and some control systems are particularly sensitive to<br />
voltage sags. In many manufacturing processes, loss <strong>of</strong> only a few vital pieces <strong>of</strong> equipment may lead to a full<br />
shut down <strong>of</strong> production leading to significant financial losses. For some processes which are thermally sensitive a<br />
significant loss <strong>of</strong> material as well as the time taken to clean up and restart the process must also be considered.<br />
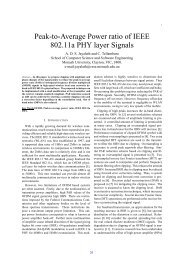
There have been many studies which aim to quantify the cost <strong>of</strong> voltage sags. The results <strong>of</strong> these studies range<br />
from relatively modest cost associated with voltage sags through to very high costs generally at high technology<br />
industrial plants (such as semi-conductor manufacturing). Table 1 below reproduced from [5] show the costs<br />
associated with voltage sags from a range <strong>of</strong> industries.<br />
Industry Typical Financial Loss per Event ( )<br />
Semiconductor Production 3 800 000<br />
Financial Trading<br />
6 000 000 per hour<br />
Computer Centre 750 000<br />
Telecommunications<br />
30 000 per minute<br />
Steel Works 350 000<br />
Glass Industry 250 000<br />
Table 1: Typical Financial Loss for <strong>Voltage</strong> <strong>Sag</strong>s based on Industry [5]<br />
Table 2 reproduced from [6] shows another summary <strong>of</strong> the impact <strong>of</strong> voltage sags on various industries from<br />
the US. The data presented agrees reasonably well with the data given in Table 1. It is stated in [6] that the cost<br />
to industry in the United States due to voltage disturbances is over $20 billion annually.<br />
Industry<br />
Loss per <strong>Voltage</strong> <strong>Sag</strong> ($US)<br />
Paper Manufacturing 30 000<br />
Chemical Industry 50 000<br />
Automobile Industry 75 000<br />
Equipment Manufacturing 100 000<br />
Credit Card Processing 250 000<br />
Semiconductor Industry 2 500 000<br />
Table 2: Impact <strong>of</strong> <strong>Voltage</strong> <strong>Sag</strong>s on Industry [6]<br />
Page 5
4. Characteristic <strong>of</strong> <strong>Voltage</strong> <strong>Sag</strong>s in Australia<br />
Data collected as part <strong>of</strong> the Long Term National Power Quality Survey (LTNPQS) project [7] has been<br />
used to develop characteristics <strong>of</strong> voltage sags in Australia. Using data collected from medium voltage<br />
sites (11 kV – 132 kV), Figure 2 shows a histogram <strong>of</strong> retained voltages while Figure 3 shows a histogram<br />
<strong>of</strong> voltage sag durations.<br />
Figure 2: Histogram <strong>of</strong> <strong>Voltage</strong> <strong>Sag</strong> Retained <strong>Voltage</strong><br />
Figure 3: Histogram <strong>of</strong> <strong>Voltage</strong> <strong>Sag</strong> Duration<br />
Using the data shown in Figure 2 and Figure 3 it is possible to develop voltage sag mitigation strategies<br />
based on a good understanding <strong>of</strong> the performance <strong>of</strong> the electricity distribution network. The data in Figure<br />
2 shows that the vast majority <strong>of</strong> voltage sags have a retained voltage <strong>of</strong> greater than 80 %. In fact, 82 %<br />
<strong>of</strong> voltage sags are have retained voltage <strong>of</strong> 50 % or greater. This means that mitigation equipment capable<br />
<strong>of</strong> mitigating voltage sags with depth down to 50 % retained voltage will be effective in the vast majority <strong>of</strong><br />
cases. Examination <strong>of</strong> sag durations, as shown in Figure 3, indicates that 68 % <strong>of</strong> voltage sags are <strong>of</strong> duration<br />
<strong>of</strong> 1 second or less. This figure gives an indication <strong>of</strong> the hold-up time required by mitigation devices if they<br />
are to be effective for most voltage sags. If the duration is extended to 2 seconds, 97 % <strong>of</strong> voltage sags fall<br />
within this duration.<br />
Page 6
5. <strong>Voltage</strong> <strong>Sag</strong> <strong>Mitigation</strong> Technologies<br />
The large costs associated with voltage sags detailed in Section 3 can justify the use <strong>of</strong> sag mitigation<br />
strategies. This section <strong>of</strong> the technical note describes some <strong>of</strong> the most common methods <strong>of</strong> voltage sag<br />
mitigation including theory <strong>of</strong> operation as well as advantages and disadvantages.<br />
5.1. Coil Hold-In Devices<br />
Contactor coils are devices which have traditionally been susceptible to voltage sags. In some cases, the loss <strong>of</strong> a<br />
single contactor can lead to the loss <strong>of</strong> a whole production line even if all <strong>of</strong> the other equipment is immune to the<br />
voltage sag. A change to the contractor circuit or type can be a very simple and cost effective method <strong>of</strong> voltage<br />
sag mitigation. Coil hold-in devices are one such mitigation method. These devices are connected between the AC<br />
supply and the contactor and can generally allow a contactor to remain energised for voltage sags down to 25 %<br />
retained voltage.<br />
5.2. Ferroresonant Transformer<br />
A ferroresonant transformer, also known as a constant<br />
voltage transformer (CVT), is a transformer that operates<br />
in the saturation region <strong>of</strong> the transformer B-H curve.<br />
<strong>Voltage</strong> sags down to 30 % retained voltage can be<br />
mitigated through the use <strong>of</strong> ferroresonant transformers.<br />
Figure 4 shows a schematic <strong>of</strong> a ferroresonant<br />
transformer. The effect <strong>of</strong> operating the transformer<br />
in this region is that changes in input voltage only have<br />
a small impact on the output voltage (see Figure 5).<br />
Ferroresonant transformers are simple and relatively<br />
maintenance free devices which can be very effective<br />
for small loads. Ferroresonant transformers are available<br />
in sizes up to around 25 kVA. On the down side, the<br />
transformer introduces extra losses into the circuit and<br />
is highly inefficient when lightly loaded. In some cases<br />
they may also introduce distorted voltages. In addition,<br />
unless greatly oversized, ferroresonant transformers are<br />
generally not suitable for loads with high inrush currents<br />
such as direct-on-line motors.<br />
Figure 4: Schematic <strong>of</strong> a Ferroresonant Transformer [8]<br />
Figure 5: Ferroresonant Transformer Theory <strong>of</strong> Operation [9]<br />
5.3. Uninterruptible Power Supply (UPS)<br />
Uninterruptible power supplies (UPS) mitigate voltage sags by supplying the load using stored energy. Upon<br />
detection <strong>of</strong> a voltage sag, the load is transferred from the mains supply to the UPS. Obviously, the capacity <strong>of</strong><br />
load that can be supplied is directly proportional to the amount <strong>of</strong> energy storage available. UPS systems have<br />
the advantage that they can mitigate all voltage sags including outages for significant periods <strong>of</strong> time (depending<br />
on the size <strong>of</strong> the UPS).<br />
Page 7
There are 2 topologies <strong>of</strong> UPS available; on-line and <strong>of</strong>f-line. Figure 6 shows a schematic <strong>of</strong> an <strong>of</strong>f-line UPS while<br />
Figure 7 shows a schematic <strong>of</strong> an on-line UPS. Comparison <strong>of</strong> the figures shows that the difference between<br />
the two systems is that for an on-line UPS the load is always supplied by the UPS, while for <strong>of</strong>f-line systems, the<br />
load is transferred from the mains supply to the UPS by a static changeover switch upon detection <strong>of</strong> a voltage<br />
sag. The lack <strong>of</strong> a changeover switch renders the on-line system more reliable as any failure <strong>of</strong> the changeover<br />
switch will result in the <strong>of</strong>f-line UPS being ineffective. UPS systems have disadvantages related to energy<br />
storage components (mostly batteries) which must be maintained and replaced periodically. Small UPS systems<br />
are relatively simple and cheap. However, large units are complex and highly expensive due to the need for large<br />
energy storage capacities.<br />
Figure 6: Block Diagram <strong>of</strong> an <strong>of</strong>f-line UPS<br />
Figure 7: Block Diagram <strong>of</strong> an on-line UPS<br />
5.4. Flywheel and Motor-Generator (MG)<br />
Flywheel systems use the energy stored in the inertia <strong>of</strong><br />
a rotating flywheel to mitigate voltage sags. In the most<br />
basic system, a flywheel is coupled in series with a motor<br />
Flywheel<br />
and a generator which in turn is connected in series with<br />
the load. The flywheel is accelerated to a very high speed<br />
and when a voltage sag occurs, the rotational energy <strong>of</strong><br />
Power<br />
System<br />
Motor<br />
Generator<br />
Sensitive<br />
Load<br />
the decelerating flywheel is utilised to supply the load.<br />
Flywheel storage systems are effective for mitigation <strong>of</strong> all<br />
voltage sags including interruptions and can supply the<br />
load for a significant period <strong>of</strong> time (up to several seconds<br />
depending on the size <strong>of</strong> the flywheel). Figure 8 shows<br />
the basic principle <strong>of</strong> the flywheel and motor-generator.<br />
Figure 8: Basic Flywheel<br />
Motor-Generator Configuration [3]<br />
Flywheels have maintenance and reliability advantages over other energy storage systems such as batteries.<br />
However, if large energy storage capacities are required, flywheels must be large and are heavy. Further, the<br />
configuration shown in Figure 8 will have high losses during normal operation [3]. A number <strong>of</strong> solutions have<br />
been proposed to overcome this issue and most involve the inclusion <strong>of</strong> power electronics into the system.<br />
Such a solution is presented in Figure 9. In this configuration, the motor which drives the flywheel is connected<br />
through a variable speed drive. This connection arrangement results in better starting characteristics for the<br />
flywheel and efficiency gains for the motor. Connection <strong>of</strong> the AC generator to a voltage source converter as<br />
shown increases the amount <strong>of</strong> energy that can be extracted from the flywheel due to the fact that the converter<br />
is able to produce a constant DC voltage, which may then be used directly or converted back to AC voltage,<br />
over a wide speed range.<br />
Page 8
Adjustable-speed<br />
drive ac motor ac generator<br />
Power<br />
System<br />
ac<br />
dc<br />
Figure 9: Impact <strong>of</strong> Sun Incidence Angle on Solar Cell Output [8]<br />
5.5. Dynamic <strong>Voltage</strong> Restorer (DVR)<br />
Dynamic <strong>Voltage</strong> Restorers (DVR) are complicated static devices which work by adding the ‘missing’ voltage<br />
during a voltage sag. Basically this means that the device injects voltage into the system in order to bring the<br />
voltage back up to the level required by the load. Injection <strong>of</strong> voltage is achieved by a switching system coupled<br />
with a transformer which is connected in series with the load. There are two types <strong>of</strong> DVRs available; those<br />
with and without energy storage. Devices without energy storage are able to correct the voltage waveform by<br />
drawing additional current from the supply. Devices with energy storage use the stored energy to correct the<br />
voltage waveform. The difference between a DVR with storage and a UPS is that the DVR only supplies the<br />
part <strong>of</strong> the waveform that has been reduced due to the voltage sag, not the whole waveform. In addition, DVRs<br />
generally cannot operate during interruptions. Figure 10 shows a schematic <strong>of</strong> a DVR. As can be seen the basic<br />
DVR consists <strong>of</strong> an injection/booster transformer, a harmonic filter, a voltage source converter (VSC) and a<br />
control system. For readers who are interested in further knowledge <strong>of</strong> DVR systems, the article in [10] gives a<br />
thorough description <strong>of</strong> the design and operation <strong>of</strong> DVRs.<br />
DVR systems have the advantage that they are highly efficient and fast acting. It is claimed in [10] that the<br />
DVR is the best economic solution for mitigating voltage sags based on its size and capabilities. In the case<br />
<strong>of</strong> systems without storage, none <strong>of</strong> the inherent issues with storage are relevant. Another advantage <strong>of</strong> DVR<br />
systems is that they can be used for purposes other than just voltage sag mitigation. These added features<br />
including harmonic mitigation, fault current limiting, power factor correction and reduction <strong>of</strong> transients.<br />
V DVR<br />
V L<br />
Supply<br />
V S<br />
Filter<br />
Control<br />
System<br />
VSC<br />
DVR<br />
Figure 10: Block Diagram <strong>of</strong> a DVR [10]<br />
Page 9
5.6. Static Var Compensator (SVC)<br />
A SVC is a shunt connected power electronics based device which works by injecting reactive current into<br />
the load, thereby supporting the voltage and mitigating the voltage sag. SVCs may or may not include energy<br />
storage, with those systems which include storage being capable <strong>of</strong> mitigating deeper and longer voltage sags.<br />
Figure 11 shows a block diagram <strong>of</strong> a SVC.<br />
Supply<br />
Load<br />
Transformer<br />
DC to AC<br />
Convertor<br />
with optional<br />
energy storage<br />
Figure 11: Block Diagram <strong>of</strong> a SVC<br />
5.7. <strong>Sag</strong> Pro<strong>of</strong>ing Transformers<br />
<strong>Sag</strong> pro<strong>of</strong>ing transformers, also known as voltage sag compensators, are basically a multi-winding transformer<br />
connected in series with the load. These devices use static switches to change the transformer turns ratio to<br />
compensate for the voltage sag. <strong>Sag</strong> pro<strong>of</strong>ing transformers are effective for voltage sags to approximately 40 %<br />
retained voltage. Figure 12 shows a block diagram <strong>of</strong> a sag pro<strong>of</strong>ing transformer.<br />
<strong>Sag</strong> pro<strong>of</strong>ing transformers have the advantage <strong>of</strong> being basically maintenance free and do not have the problems<br />
associated with energy storage components. A disadvantage is that at this stage, sag pro<strong>of</strong>ing transformers are<br />
only available for relatively small loads <strong>of</strong> up to approximately 5 kVA. With the transformer connected in series, the<br />
system also adds to losses and any failure <strong>of</strong> the transformer will lead to an immediate loss <strong>of</strong> supply.<br />
Figure 12: Block Diagram <strong>of</strong> a <strong>Sag</strong> Pro<strong>of</strong>ing Transformer [11]<br />
Page 10
5.8. Static Transfer Switch (STS)<br />
For facilities with a dual supply, one possible method <strong>of</strong> voltage sag mitigation is through the use <strong>of</strong> a static<br />
transfer switch. Upon detection <strong>of</strong> a voltage sag, these devices can transfer the load from the normal supply<br />
feeder to the alternative supply feeder within half a cycle. The effectiveness <strong>of</strong> this switching operation is highly<br />
dependent on how independent <strong>of</strong> each other the 2 supply feeders are and the location <strong>of</strong> the event leading<br />
to the voltage sag. Ideally, with a dual feeder supply, the 2 feeders should be supplied by different substations.<br />
Obviously, there are significant costs associated with dual supplies even if they are available.<br />
6. Energy Storage Technologies<br />
Although not sag mitigations device by themselves, energy storage systems are essential to many <strong>of</strong> the above<br />
sag mitigation technologies. As such, a short description <strong>of</strong> energy storage technologies is relevant to this<br />
technical note. In cases <strong>of</strong> devices such as the DVR and SVC, the device is compatible for use with a number<br />
<strong>of</strong> different energy storage technologies. The choice <strong>of</strong> technology generally depends on the application,<br />
maintenance requirements and cost. At present there are four main energy storage technologies that may be<br />
applied to sag mitigation technologies. These are flywheel, batteries, superconducting magnetic energy storage<br />
(SMES) and capacitors.<br />
6.1. Flywheels<br />
Flywheel energy storage systems are one <strong>of</strong> the oldest storage technologies with examples dating back to<br />
the 11th century [12]. Modern flywheel systems incorporate advanced materials such as carbon fibre, have<br />
magnetic bearings and may spin in a vacuum to reduce losses.<br />
Flywheels have the advantage that they are simple and low maintenance. They also have a long lifespan. Generally<br />
flywheels do not contain materials which are particularly dangerous to the environment. On the downside, they<br />
introduce losses into the system and may not charge as fast as other devices such as capacitors.<br />
6.2. Batteries<br />
Battery energy storage is another systems have been in existence for a considerable period <strong>of</strong> time. Although an<br />
area <strong>of</strong> continual research, battery technologies are well developed and well understood. Batteries are relatively<br />
cheap and when maintained correctly provide excellent performance. In addition, batteries have the highest<br />
energy density <strong>of</strong> all the considered energy storage technologies. The main disadvantage <strong>of</strong> batteries is that they<br />
have a finite number <strong>of</strong> charge cycles and hence a limited lifespan. They also contain materials which may be<br />
hazardous to the environment.<br />
6.3. Capacitors<br />
Capacitors and the modern super or ultra-capacitors are becoming a more popular choice for energy storage.<br />
Capacitors are simple and have very fast charge times. They do not have the charge cycle limitations <strong>of</strong><br />
batteries and hence may have a longer lifespan if not subject to overvoltage stress. Cost for capacitors varies<br />
on the application but is higher than the cost <strong>of</strong> batteries. Disadvantages <strong>of</strong> capacitors include relatively higher<br />
costs compared to batteries and relatively lower energy density levels compared to batteries.<br />
Page 11
6.4. Superconducting Magnetic Energy Storage (SMES)<br />
SMES systems are a developing technology which utilise the properties <strong>of</strong> superconducting material to store<br />
energy in magnetic fields. SMES systems have very fast charge and discharge times which make them an<br />
attractive energy storage system for sag mitigation. Another advantage <strong>of</strong> SMES systems is the very low losses<br />
due to the superconducting characteristics. The main disadvantage <strong>of</strong> SMES over batteries at present is the<br />
cost. SMES systems also have all <strong>of</strong> the disadvantages associated with superconducting technology, not least<br />
<strong>of</strong> which is the need for liquid nitrogen to maintain the cryogenic temperatures required for superconductivity.<br />
7. Cost <strong>of</strong> <strong>Sag</strong> <strong>Mitigation</strong> Technologies<br />
7.1. Cost <strong>of</strong> <strong>Mitigation</strong> Technologies<br />
This section <strong>of</strong> the technical note attempts to quantify and compare the costs <strong>of</strong> the various mitigation devices<br />
discussed above. For all technologies, there will be two costs involved. The first is the initial purchase price <strong>of</strong><br />
the equipment while the second is the maintenance costs associated with the selected equipment. There are a<br />
number <strong>of</strong> studies which give the costs <strong>of</strong> mitigation technologies and not all agree well with each other. Table<br />
3 shows a range <strong>of</strong> costs for a number <strong>of</strong> the mitigation technologies discussed above. It can be seen that the<br />
DVR is the cheapest mitigation technology on a cost per kVA basis. However, DVR systems are usually only<br />
used for large loads and the costing is based on this fact. UPS systems or ferroresonant transformers are the<br />
only viable mitigation strategies for small load.<br />
<strong>Mitigation</strong> Technology Initial Cost ($) Operation Cost<br />
(% <strong>of</strong> Initial Cost per Year)<br />
Coil Hold-In Devices 100 – 150 each [13] N/A<br />
Ferroresonant Transformer (CVT) 1000/kVA [14] 1 [14]<br />
UPS 500/kVA [14] - 1000/KVA [13] 1.5 - 2.5 [14] 10 [15]<br />
Flywheel 500/kVA [14] 0.7 [14]<br />
DVR (50 % voltage boost) 250/kVA [14] 0.5 [14]<br />
Statcom 400/kVA [15] 5 [15]<br />
Static Switch (10 MVA) 600 000 [14] 0.5 [14]<br />
Table 3: Cost <strong>of</strong> <strong>Voltage</strong> <strong>Sag</strong> <strong>Mitigation</strong> Technologies<br />
7.2. Comparison <strong>of</strong> Costs <strong>of</strong> Storage Technologies<br />
Table 4 on the following page, reproduced from [3], gives a comparison <strong>of</strong> the cost <strong>of</strong> energy storage<br />
technologies depending on the application. It can be seen that for all applications, battery energy<br />
storage systems (BESS) remain the cheapest solution while, depending on the application, capacitors or<br />
superconducting magnetic energy storage (SMES) may be the next cheapest.<br />
Page 12
Power<br />
Ride-through<br />
Time<br />
Costs <strong>of</strong> Energy Storage ($)<br />
SMES BESS Capacitors<br />
300 kW 1 s 183 000 6300 56 000<br />
60 s 389 000 6300 3 350 000<br />
3 MW 1 s 411 000 63 000 558 000<br />
60 s 1 064 000 63 000 33 500 000<br />
8. Conclusion<br />
Table 4: Cost <strong>of</strong> Storage Technologies<br />
This technical note described voltage sags including their characteristics, causes, measurement and<br />
financial impact. A number <strong>of</strong> techniques which may be utilised to mitigate voltage sags have been<br />
described along with the advantages and disadvantages <strong>of</strong> each. Finally a comparison <strong>of</strong> the costs <strong>of</strong><br />
each voltage sag mitigation technology has been given.<br />
9. References<br />
[1] IEC60050-604, International Electrotechnical Vocabulary. Chapter 604: Generation, transmission and<br />
distribution <strong>of</strong> electricity - Operation, IEC, 1998.<br />
[2] IEEE Std 1159-2009, IEEE Recommended Practice for Monitoring Power Quality, IEEE, 2009.<br />
[3] Math H. J. Bollen, Understanding Power Quality Problems - <strong>Voltage</strong> <strong>Sag</strong>s and Interruptions, 2000,<br />
New Jersey, John Wiley & Sons.<br />
[4] V.J. Gosbell, D. Robinson, S. Perera, The Analysis <strong>of</strong> Utility <strong>Voltage</strong> <strong>Sag</strong> Data, International Power<br />
Quality Conference, Singapore, October 2002.<br />
[5] David Chapman, Power Quality Application Guide - The Cost <strong>of</strong> Poor Power Quality, Copper<br />
Development Association, 2001.<br />
[6] B. H. Chowdhury, Power Quality, in IEEE Potentials, Vol 20, No 2, 2001.<br />
[7] S. Elphick, V. Gosbell, V. Smith, R. Barr, The Australian Long Term Power Quality Survey Project<br />
Update, 14th International Conference on Harmonics and Quality <strong>of</strong> Power, ICHQP’10, Bergamo,<br />
Italy, 26 - 29 September 2010.<br />
[8] All About Circuits, <strong>Voltage</strong> Regulation, Available from: http://www.allaboutcircuits.com/vol_2/chpt_<br />
9/6.html, Last Accessed 3rd February 2012.<br />
[9] The Automatic <strong>Voltage</strong> Regulator – AVR: Guide and Comparison, Available from: http://www.<br />
ustpower.com/Support/<strong>Voltage</strong>_Regulator_Comparison/Ferroresonant_Transformer_CVT/Constant_<br />
<strong>Voltage</strong>_Transformer_Operation.aspx, Last Accessed 3rd February 2012.<br />
[10] Chellali Benachaiba, Brahim Ferdi, <strong>Voltage</strong> Quality Improvement Using DVR, Electrical Power Quality<br />
and Utilisation Journal, Vol. XIV, No. 1, 2008, p. 39 - 45.<br />
Page 13
[11] <strong>Sag</strong> Pro<strong>of</strong>ing Technologies Inc, Installation and Service Manual - <strong>Voltage</strong>-<strong>Sag</strong> Compensators, 2005.<br />
[12] Wikipedia, Flywheel, Available from: http://en.wikipedia.org/wiki/Flywheel#History, Last Accessed 8th<br />
February 2012.<br />
[13] Pacific Gas and Electric Company, <strong>Voltage</strong> <strong>Sag</strong> Ride-Through <strong>Mitigation</strong> in Sequence by Increasing<br />
Cost, 1999.<br />
[14] Tosak Thasanutariya, Somchai Chatratana, Mark McGranaghan, Economic Evaluation <strong>of</strong> Solution<br />
Alternatives for <strong>Voltage</strong> <strong>Sag</strong>s and Momentary Interruptions, in Electrical Power Quality and Utilisation<br />
Magazine, Vol 1, No 2, 2005.<br />
[15] M. Didden, R. Belmans, W. D’Haeseleer, Cost-Benefit Analysis <strong>of</strong> <strong>Voltage</strong> <strong>Sag</strong> <strong>Mitigation</strong> Methods in<br />
Fiber Extrusion Plants, in ETEP, Vol 13, No 2, 2003.<br />
Page 14
For more information please contact:<br />
Dr Vic Smith<br />
Endeavour Energy Power Quality & Reliability Centre<br />
<strong>University</strong> <strong>of</strong> <strong>Wollongong</strong><br />
Northfields Avenue<br />
<strong>Wollongong</strong> NSW 2522<br />
Australia<br />
Phone: +61 2 42214737<br />
Fax: +61 2 42213236<br />
Email: vic@uow.edu.au<br />
Web: www.elec.uow.edu.au/eepqrc