Active Pharmaceutical Ingredients (API) Market - Global Industry Analysis, Size, Share, Growth, Trends and Forecast 2014 – 2020
Active Pharmaceutical Ingredients (API) Market: (Branded/Generic/Over-the-counter, Chemical/Biological, Captive/Contract Manufactured, by Geography, and by Therapeutic Area) - Global Industry Analysis, Size, Share, Growth, Trends and Forecast 2014 – 2020
Active Pharmaceutical Ingredients (API) Market: (Branded/Generic/Over-the-counter, Chemical/Biological, Captive/Contract Manufactured, by Geography, and by Therapeutic Area) - Global Industry Analysis, Size, Share, Growth, Trends and Forecast 2014 – 2020
Create successful ePaper yourself
Turn your PDF publications into a flip-book with our unique Google optimized e-Paper software.
<strong>Active</strong> <strong>Pharmaceutical</strong> <strong>Ingredients</strong><br />
(<strong>API</strong>) <strong>Market</strong><br />
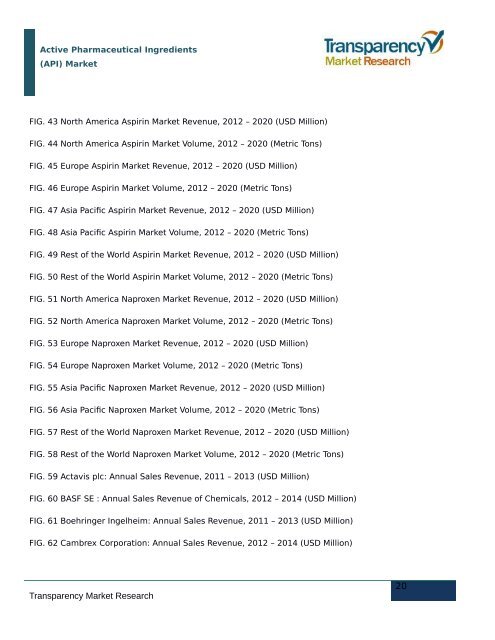
FIG. 43 North America Aspirin <strong>Market</strong> Revenue, 2012 <strong>–</strong> <strong>2020</strong> (USD Million)<br />
FIG. 44 North America Aspirin <strong>Market</strong> Volume, 2012 <strong>–</strong> <strong>2020</strong> (Metric Tons)<br />
FIG. 45 Europe Aspirin <strong>Market</strong> Revenue, 2012 <strong>–</strong> <strong>2020</strong> (USD Million)<br />
FIG. 46 Europe Aspirin <strong>Market</strong> Volume, 2012 <strong>–</strong> <strong>2020</strong> (Metric Tons)<br />
FIG. 47 Asia Pacific Aspirin <strong>Market</strong> Revenue, 2012 <strong>–</strong> <strong>2020</strong> (USD Million)<br />
FIG. 48 Asia Pacific Aspirin <strong>Market</strong> Volume, 2012 <strong>–</strong> <strong>2020</strong> (Metric Tons)<br />
FIG. 49 Rest of the World Aspirin <strong>Market</strong> Revenue, 2012 <strong>–</strong> <strong>2020</strong> (USD Million)<br />
FIG. 50 Rest of the World Aspirin <strong>Market</strong> Volume, 2012 <strong>–</strong> <strong>2020</strong> (Metric Tons)<br />
FIG. 51 North America Naproxen <strong>Market</strong> Revenue, 2012 <strong>–</strong> <strong>2020</strong> (USD Million)<br />
FIG. 52 North America Naproxen <strong>Market</strong> Volume, 2012 <strong>–</strong> <strong>2020</strong> (Metric Tons)<br />
FIG. 53 Europe Naproxen <strong>Market</strong> Revenue, 2012 <strong>–</strong> <strong>2020</strong> (USD Million)<br />
FIG. 54 Europe Naproxen <strong>Market</strong> Volume, 2012 <strong>–</strong> <strong>2020</strong> (Metric Tons)<br />
FIG. 55 Asia Pacific Naproxen <strong>Market</strong> Revenue, 2012 <strong>–</strong> <strong>2020</strong> (USD Million)<br />
FIG. 56 Asia Pacific Naproxen <strong>Market</strong> Volume, 2012 <strong>–</strong> <strong>2020</strong> (Metric Tons)<br />
FIG. 57 Rest of the World Naproxen <strong>Market</strong> Revenue, 2012 <strong>–</strong> <strong>2020</strong> (USD Million)<br />
FIG. 58 Rest of the World Naproxen <strong>Market</strong> Volume, 2012 <strong>–</strong> <strong>2020</strong> (Metric Tons)<br />
FIG. 59 Actavis plc: Annual Sales Revenue, 2011 <strong>–</strong> 2013 (USD Million)<br />
FIG. 60 BASF SE : Annual Sales Revenue of Chemicals, 2012 <strong>–</strong> <strong>2014</strong> (USD Million)<br />
FIG. 61 Boehringer Ingelheim: Annual Sales Revenue, 2011 <strong>–</strong> 2013 (USD Million)<br />
FIG. 62 Cambrex Corporation: Annual Sales Revenue, 2012 <strong>–</strong> <strong>2014</strong> (USD Million)<br />
Transparency <strong>Market</strong> Research<br />
20


