TRB Paper Manuscript #11-0368 An Algorithm to ... - Lexciestuff.net
TRB Paper Manuscript #11-0368 An Algorithm to ... - Lexciestuff.net
TRB Paper Manuscript #11-0368 An Algorithm to ... - Lexciestuff.net

Create successful ePaper yourself
Turn your PDF publications into a flip-book with our unique Google optimized e-Paper software.
Alex Lu, Alla Reddy Page 1 of 26<br />
<strong>TRB</strong> <strong>Paper</strong> <strong>Manuscript</strong> <strong>#11</strong>-<strong>0368</strong><br />
<strong>An</strong> <strong>Algorithm</strong> <strong>to</strong> Measure Daily Bus Passenger Miles Using Electronic Farebox Data<br />
for National Transit Database (NTD) Section 15 Reporting<br />
Alex Lu, Alla Reddy*<br />
* Corresponding author<br />
Alex Lu<br />
Principal Transportation Planner<br />
New York City Transit<br />
2 Broadway, Cubicle A17.111, New York, N.Y. 10004-2208<br />
Tel: (646) 252-5664<br />
Email: Alex.Lu@nyct.com<br />
Alla Reddy<br />
Senior Direc<strong>to</strong>r, System Data & Research (SDR), Operations Planning<br />
New York City Transit<br />
2 Broadway, Office A17.92, New York, N.Y. 10004-2208<br />
Tel: (646) 252-5662<br />
Email: Alla.Reddy@nyct.com<br />
Word Count: 232 (Abstract) + 5,656 (Text) + 6 * 250 (Figures) = 7,388 Words<br />
ABSTRACT<br />
New York City Transit (NYCT) implemented an au<strong>to</strong>mated algorithm <strong>to</strong> estimate daily bus<br />
unlinked trips, infer passenger-miles, and compute average trip lengths by route using transaction<br />
data from an entry-only Au<strong>to</strong>mated Fare Collection (AFC) system. Total onboard miles are<br />
inferred by taking advantage of symmetries in bus passengers’ daily activity patterns. NYCT’s<br />
algorithm utilizes rigourously-tested engineering assumptions <strong>to</strong> detect common data errors from<br />
mechanical failures, imperfect driver-farebox interactions, and operational reality, applying<br />
statistically measured adjustment fac<strong>to</strong>rs <strong>to</strong> correct or interpolate for missing passengers from<br />
non-AFC boardings and malfunctions. Surveys revealed that under typical operating conditions,<br />
non-AFC passengers and farebox data transmission errors accounted for 12% and 5½% of<br />
missing ridership, respectively. The fault-<strong>to</strong>lerant algorithm uses non-geographic transaction<br />
data from an AFC system without Au<strong>to</strong>mated Vehicle Loca<strong>to</strong>r (AVL) functionality, directly<br />
computing aggregate passenger-miles by inferring origin locations from transaction timestamps<br />
using scheduled average speed assumptions, and without assigning each passenger’s precise<br />
destination. NYCT focused on fully au<strong>to</strong>matic, production-ready algorithms by rejecting<br />
alternatives requiring excessive coding effort, processor time, difficult-<strong>to</strong>-obtain data, or manual<br />
intervention in favour of logical inference, statistical estimation, and symmetry. Meticulous<br />
parallel testing demonstrated that resulting average trip lengths are stable across days and<br />
correlate well with manually collected s<strong>to</strong>p-by-s<strong>to</strong>p ridership data. <strong>An</strong>nual passenger-miles are<br />
within –1% <strong>to</strong> 4% of the National Transit Database (NTD) ±10% sample data and were approved<br />
by Federal Transit Administration (FTA) for NTD Section 15 submission.<br />
11-<strong>0368</strong>_afc_mileage_paper_038.doc (11/16/2010; 788k) NOVEMBER DRAFT – November 16, 2010
Alex Lu, Alla Reddy Page 2 of 26<br />
1<br />
2<br />
3<br />
4<br />
5<br />
6<br />
7<br />
8<br />
9<br />
10<br />
11<br />
12<br />
13<br />
14<br />
15<br />
16<br />
17<br />
18<br />
19<br />
20<br />
21<br />
22<br />
23<br />
24<br />
25<br />
26<br />
27<br />
28<br />
29<br />
30<br />
31<br />
32<br />
33<br />
34<br />
35<br />
36<br />
37<br />
38<br />
39<br />
40<br />
41<br />
42<br />
43<br />
44<br />
45<br />
INTRODUCTION<br />
This paper presents New York City Transit’s (NYCT) algorithm <strong>to</strong> directly estimate route-level<br />
daily bus passenger-miles and average trip lengths for National Transit Database (NTD) Section<br />
15 reporting from transaction data streams generated by entry-swipe fareboxes not equipped with<br />
Au<strong>to</strong>matic Vehicle Loca<strong>to</strong>r (AVL) systems. At this algorithm’s core are engineering<br />
assumptions designed <strong>to</strong> simplify data processing and minimize manual exception-handling<br />
requirements, permitting a high degree of au<strong>to</strong>mation while <strong>to</strong>lerating common data errors from<br />
mechanical failures, imperfect passenger-farebox or driver-farebox interactions, and operational<br />
reality.<br />
The algorithm’s program implementation reads daily Au<strong>to</strong>mated Fare Collection (AFC) system<br />
transaction data and outputs route-level unlinked trips and passenger-miles. Bus trips are<br />
inferred from transaction data by observing sequence of headsign changes in each vehicle’s data.<br />
Passenger boarding locations en-route is determined using transaction timestamps relative <strong>to</strong><br />
times when bus trips started (converting time <strong>to</strong> distance using route-specific time-of-daydependent<br />
scheduled running time profiles). Aggregate passenger-miles travelled are estimated<br />
by taking advantage of statistical symmetry between opposing-direction boarding and alighting<br />
activities within a 24-hour period, without inferring each passenger’s precise destination.<br />
Correction fac<strong>to</strong>rs developed from one-time surveys plus routine reports adjust for “missing”<br />
passengers – for reasons ranging from fare evasion <strong>to</strong> AFC equipment malfunction.<br />
The resulting annual passenger mile estimate is comparable <strong>to</strong> or better than traditional Federal<br />
Transit Administration (FTA) prescribed 700 trips-per-year (1) stratified ridecheck sample<br />
method (95% ±10% error margin) and was approved by FTA for NTD reporting in lieu of<br />
sampling.<br />
Relationship <strong>to</strong> Prior Work<br />
Transportation planners routinely use mag<strong>net</strong>ic and contactless farecard data for off-line<br />
planning and modelling purposes in cities varied as Chicago (2,3), New York (4,5), Bos<strong>to</strong>n (6),<br />
Minneapolis (7), London (8,9,10), Taipei (11), Hong Kong (12), China (14), and elsewhere<br />
(15,16,17), and farebox receipts on an aggregate basis have long been used <strong>to</strong> moni<strong>to</strong>r ridership<br />
trends and adjust service levels (18,19). However, most analysis methods are complex and often<br />
required analysts <strong>to</strong> “massage” raw AFC data, reducing their effectiveness for routine daily<br />
reporting.<br />
Early-generation AFCs (like one Scotland’s Lothian Buses used in the 1990s) required drivers <strong>to</strong><br />
punch at every timepoint, for verification of zone fares, potentially allowing construction of<br />
origin-destination (OD) matrices. In Taipei, route-by-route OD matrices have been estimated<br />
from the non-AVL Taipei Youyoka (EasyCard) data using transaction time differential and<br />
average travel speed methods, using transactions on the same farecard over multiple days <strong>to</strong><br />
estimate running times (11). Extensions taking advantage of transferring passengers’ farecard<br />
traces (providing more accurate localizations by estimating when specific buses served transfer<br />
points) were proposed (20), but these approaches are <strong>to</strong>o complex for fully-au<strong>to</strong>mated production<br />
environments where zero manual intervention is a goal.<br />
11-<strong>0368</strong>_afc_mileage_paper_038.doc (11/16/2010; 788k) NOVEMBER DRAFT – November 16, 2010
Alex Lu, Alla Reddy Page 3 of 26<br />
1<br />
2<br />
3<br />
4<br />
5<br />
6<br />
7<br />
8<br />
9<br />
10<br />
11<br />
12<br />
13<br />
14<br />
15<br />
16<br />
17<br />
18<br />
19<br />
20<br />
21<br />
22<br />
23<br />
24<br />
25<br />
26<br />
27<br />
28<br />
29<br />
30<br />
31<br />
32<br />
33<br />
34<br />
35<br />
36<br />
37<br />
38<br />
39<br />
40<br />
41<br />
42<br />
43<br />
44<br />
45<br />
Many smartcard systems now use physical location (although generally not AVL data) <strong>to</strong> charge<br />
zone fares. In rural Formosa, the TaiwanTong (Taiwan Easy Go) smartcard uses AVL-equipped<br />
fareboxes and a tap-on, tap-off system <strong>to</strong> charge mileage-based fares on intercity local buses on a<br />
production basis since 2007 (21). NJ Transit uses a Global Positioning System (GPS) based<br />
system for reporting boarding s<strong>to</strong>ps, but not zone fare computation (22). However, the authors<br />
are not aware of any bus opera<strong>to</strong>rs inferring geographic information on a systemwide routine<br />
daily basis from non-AVL fareboxes.<br />
Although NYCT developed this algorithm independently, subsequent literature review revealed a<br />
key symmetry assumption was previously demonstrated on two Pittsburgh light rail lines (23),<br />
five Los <strong>An</strong>geles bus routes using “location-stamped” farebox data, and verified by comparison<br />
with APC (24). This work’s contribution is, therefore: (a) an additional sixteen-route New York<br />
dataset generally supporting the symmetry assumption, but also demonstrates circumstances<br />
where it may not hold; (b) although not immediately transferable <strong>to</strong> other AFC systems with<br />
different error patterns, assumptions devised <strong>to</strong> handle faulty farebox data is helpful as a case<br />
study; (c) methods and simplifying assumptions allowing fully au<strong>to</strong>mated data analysis without<br />
manual intervention, required for 100% data reporting at large agencies; (d) <strong>to</strong>gether with classic<br />
code-optimization approaches, simple geometric transformations allowing sequential processing<br />
of each bus’s farebox data without explicitly enumerating centroids or route load profile<br />
his<strong>to</strong>grams, producing reasonable execution times (~2.5 million daily transactions in ~3<br />
minutes), another production deployment prerequisite.<br />
<strong>An</strong>other contribution is the large-scale and thorough surveys and electronic data analyses<br />
conducted in a fairly comprehensive estimation of fac<strong>to</strong>rs describing numerous reasons for AFC<br />
data losses under NYCT’s typical operating conditions. Although these fac<strong>to</strong>rs are not directly<br />
applicable <strong>to</strong> other metropolitan areas, it likely provides the first published survey in several<br />
years that examines the fraction of bus ridership that isn’t captured by fare collection systems –<br />
the “AFC unaccountable” riders.<br />
Brief His<strong>to</strong>ry of Au<strong>to</strong>mated Fare Collection<br />
First faregates in United States were installed experimentally in 1964 at Forest Hills and Kew<br />
Gardens Long Island Rail Road stations in Queens (25); first systemwide installation was on<br />
Illinois Central Railroad (IC) in 1965 for its busy Chicago commuter service (<strong>to</strong>day’s Metra<br />
Electric.) Financed entirely from private funds, AFC was expected <strong>to</strong> reduce operating costs by<br />
decreasing on-board crew sizes and eliminating station agents at all but busiest stations. Cubic’s<br />
IC system featured entry-exit swipes (NX) <strong>to</strong> enforce zonal fare structures, checks against fraud,<br />
used ticket collection, and ridership/revenue data collection capabilities (26). It served as<br />
pro<strong>to</strong>type for the San Francisco Bay Area Rapid Transit (BART) (27), Washing<strong>to</strong>n Metropolitan<br />
Area Transit Authority (WMATA) (28), and Philadelphia’s Port Authority Transit Corporation<br />
(PATCO) Lindenwold Line NX-zonal AFC systems (29). These railroad-style systems required<br />
complex computer data processing on faregates or remotely on a central computer, and thus<br />
weren’t suitable for buses. Similar systems are still in use on Japan’s and Taiwan’s commuter<br />
railroads, and London Underground (30).<br />
11-<strong>0368</strong>_afc_mileage_paper_038.doc (11/16/2010; 788k) NOVEMBER DRAFT – November 16, 2010
Alex Lu, Alla Reddy Page 4 of 26<br />
1<br />
2<br />
3<br />
4<br />
5<br />
6<br />
7<br />
8<br />
9<br />
10<br />
11<br />
12<br />
13<br />
14<br />
15<br />
16<br />
17<br />
18<br />
19<br />
20<br />
21<br />
22<br />
23<br />
24<br />
25<br />
26<br />
27<br />
28<br />
29<br />
30<br />
31<br />
32<br />
33<br />
34<br />
35<br />
36<br />
37<br />
38<br />
39<br />
40<br />
41<br />
42<br />
43<br />
44<br />
45<br />
46<br />
Metropolitan Atlanta Rapid Transit Authority (MARTA)’s desire for simpler AFC systems<br />
resulted in Duncan (traditionally a parking meter vendor) developing turnstile machines for<br />
entry-only subway fare collection. Chicago Transit Authority (CTA)’s ChicagoCard, Bos<strong>to</strong>n<br />
Massachusetts Bay Transportation Authority (MBTA)’s previous generation “T-Pass”, and<br />
NYCT’s MetroCard systems could all be considered MARTA’s 1977 system’s conceptual<br />
descendents.<br />
Bus fareboxes had hither<strong>to</strong> been much simpler devices, mechanically registering coins deposited<br />
on accumulating registration counters. Duncan’s 1973 “Faretronic” farebox was first <strong>to</strong><br />
electronically count coins and collect revenue/ridership data by fare class. Keene quickly<br />
followed suit, introducing a design meeting Urban Mass Transit Administration (UMTA) Section<br />
15 reporting requirements, also collecting fuel consumption and bus mileage data (31). In New<br />
York, mechanical fareboxes were preferred for ease of maintenance until widespread deployment<br />
of Cubic’s MetroCard for buses in 1997. Venerable GFI fareboxes featuring mag<strong>net</strong>ic pass<br />
readers requiring cash single fares lasted in Bos<strong>to</strong>n until Scheidt-Bachmann’s CharlieCard was<br />
introduced in 2006.<br />
Purpose and Need<br />
Prior <strong>to</strong> development of GPS, Au<strong>to</strong>mated Passenger Counters (APC), and AVL systems,<br />
fareboxes could be instrumented <strong>to</strong> record revenue trips, bus mileage, fuel consumption, and<br />
even engine maintenance related data, but geographical information couldn’t be recorded.<br />
However, Section 15 has required revenue passenger-miles data since at least 1978 (32). FTA’s<br />
reporting manual advises transit agencies without APC/AVL <strong>to</strong> use ridecheck sampling (1) –<br />
assigning surveyors <strong>to</strong> ride buses from origins <strong>to</strong> destinations, a time-consuming process.<br />
More recently, FTA recommended conversion <strong>to</strong> 100% electronic data reporting. With FTA<br />
support, NYCT developed this algorithm <strong>to</strong> leverage daily AFC data streams, uniquely tailored<br />
<strong>to</strong> MetroCard system’s data recording methods. While NYCT’s primary motivation was <strong>to</strong><br />
simplify auditing, improve data quality, obtain reliable monthly data unavailable from annual<br />
sampling, and avoid manual data collection pitfalls, this implementation produced savings in<br />
both survey and analytical resources, although one-time investment in algorithm development<br />
and programming was required.<br />
Issues with Surveyor Data Collection<br />
Several issues are inherently problematic with surveyor data collection: high costs, difficulty of<br />
processing large passenger volumes, missed assignments, data interpretation issues, data entry<br />
and analysis costs, and potential data collection inconsistencies (5). Specifically for NTD bus<br />
passenger-miles data, several other considerations make sample methodologies challenging:<br />
1. NTD requires monthly ridership “safety module” reporting, but sample design calls for<br />
95% ±10% error margin annually. Monthly results therefore vary widely (implied error<br />
margin is about ±30%), making results difficult <strong>to</strong> explain and practically useless.<br />
2. Missed assignments are particularly problematic for NTD data, because specific bus trips<br />
are randomly scheduled per NTD methodology requirements. If surveyors miss that trip<br />
for any reason (e.g. travel delay), substitutions by subsequent trips are unacceptable.<br />
Extra random samples must be taken, increasing survey costs.<br />
11-<strong>0368</strong>_afc_mileage_paper_038.doc (11/16/2010; 788k) NOVEMBER DRAFT – November 16, 2010
Alex Lu, Alla Reddy Page 5 of 26<br />
1<br />
2<br />
3<br />
4<br />
5<br />
6<br />
7<br />
8<br />
9<br />
10<br />
11<br />
12<br />
13<br />
14<br />
15<br />
16<br />
17<br />
18<br />
19<br />
20<br />
21<br />
22<br />
23<br />
24<br />
25<br />
26<br />
27<br />
28<br />
29<br />
30<br />
31<br />
32<br />
33<br />
34<br />
35<br />
36<br />
37<br />
38<br />
39<br />
40<br />
41<br />
42<br />
43<br />
44<br />
3. Unlike NYCT’s other surveys, NTD ridechecks are conducted for entire span of service –<br />
24 hours daily, 7 days per week. Data collection resource costs during “off-hours”<br />
cannot be shared with routine surveys, requiring dedicated overnight and weekend<br />
surveyors.<br />
ELECTRONIC FARE MEDIA DATA<br />
NYCT’s farebox data is captured in two files, Transaction (EU65) file and Trip file. EU65 is<br />
generated daily and contains one record for each MetroCard point-of-entry (POE) transaction<br />
(subway/bus). Each record (Figure 1(a)) contains farecard ID, date, time, transaction type, fare<br />
media class, bus number, carrier, farebox number, value deducted, and POE “location” code.<br />
Subway POEs identify turnstile location, but bus codes identify only route/direction (from<br />
destination rollsign). Without AVL, boarding locations cannot be known exactly. Transaction<br />
time is rounded <strong>to</strong> nearest one-tenth hours (i.e. six minutes).<br />
Each Trip file record contains information about partial trips. New records are generated when:<br />
1. New driver logs on (at mid-route relief points);<br />
2. Destination rollsign is changed (including mid-route, when authorized <strong>to</strong> bypass s<strong>to</strong>ps<br />
with ‘Next Bus Please’ sign);<br />
3. When predetermined times are reached (e.g. 09:00, 09:30, 15:30 – when tariff changes<br />
for certain fares).<br />
Separate records must be combined <strong>to</strong> determine trip-level information. Trip data mostly relates<br />
<strong>to</strong> drivers (Run No., Employee No., etc.) and fareboxes’ cash register functions (cash received by<br />
fare class, reduced fares paid, paper transfers issued, etc.)<br />
Designed for farebox and fare media auditing, both Transaction and Trip file data models are not<br />
completely normalized, and not ideal for data mining. Available computer technology at<br />
reasonable costs during MetroCard’s design phase (early 1990s) influenced these decisions.<br />
Transaction data was constrained by available s<strong>to</strong>rage on MetroCard’s mag<strong>net</strong>ic stripes (16 bytes<br />
per transaction). Farebox “probing” time (downloading daily data during farebox emptying) was<br />
likely also considered.<br />
Select Bus Service (SBS) MetroCard Fare Collec<strong>to</strong>rs (MFCs)<br />
NYC Department of Transportation (NYCDOT)’s Bus Rapid Transit (BRT) service is branded<br />
and utilizes off-board fare collection with Proof-of-Payment (POP). MFC<br />
fare validation machines and Parkeon’s Coin Fare Collec<strong>to</strong>r (CFC) meters are installed at each<br />
s<strong>to</strong>p. Riders pay prior <strong>to</strong> boarding using either MetroCards or cash. Each transaction generates a<br />
receipt, which may be examined by inspec<strong>to</strong>rs any time while travelling (33). Receipt-issuing<br />
transactions are logged. NYCT’s Office of Management and Budget (OMB) analyzes numerous<br />
data streams manually <strong>to</strong> produce monthly summary revenue reports by fare media, location, and<br />
direction.<br />
11-<strong>0368</strong>_afc_mileage_paper_038.doc (11/16/2010; 788k) NOVEMBER DRAFT – November 16, 2010
Alex Lu, Alla Reddy Page 6 of 26<br />
1<br />
2<br />
3<br />
4<br />
5<br />
6<br />
7<br />
8<br />
9<br />
10<br />
11<br />
12<br />
13<br />
14<br />
15<br />
16<br />
17<br />
18<br />
19<br />
20<br />
21<br />
22<br />
23<br />
24<br />
25<br />
26<br />
27<br />
28<br />
29<br />
30<br />
31<br />
32<br />
33<br />
34<br />
35<br />
36<br />
37<br />
38<br />
39<br />
40<br />
41<br />
42<br />
43<br />
44<br />
45<br />
46<br />
Common Farebox Data Errors and Problems in Interpretation<br />
AFC has built-in validation features <strong>to</strong> ensure internal consistency. Problems in interpretation<br />
arise because of operating procedures and practices that AFC wasn’t designed <strong>to</strong> capture,<br />
resulting in missing data or data that incorrectly describe field operations (19). Difficulties fall<br />
within four broad categories:<br />
1. Drivers Don’t Correctly Change Headsigns: AFC relies on destination sign<br />
information <strong>to</strong> determine route/direction. Headsign units occasionally malfunction and<br />
show garbled destinations; some drivers then don’t properly enter signcodes. Fareboxes<br />
thus encode entire day’s transactions <strong>to</strong> one direction.<br />
2. Farebox Doesn’t Correctly Register Cash Fares: Cash transactions are recorded as<br />
segment <strong>to</strong>tals by fare class, in Trip file. Ordinary fare is $2.25, but special passengers<br />
pay half fare ($1.10). Normally, concessionary passengers show appropriate<br />
identification <strong>to</strong> drivers, who push a but<strong>to</strong>n <strong>to</strong> register half-fares. However, many don’t<br />
wait for drivers <strong>to</strong> setup fareboxes, often resulting in incorrectly registered half-fares, like<br />
two half-fares becoming a full fare. Totals thus couldn’t be used <strong>to</strong> ascertain transaction<br />
counts.<br />
3. Passengers Fail <strong>to</strong> Pay Correct Fares: From AFC’s perspective, passengers not paying<br />
fares shouldn’t exist in transaction files. While fareboxes provide an “evader” but<strong>to</strong>n<br />
(Key 5), this isn’t consistently utilized by opera<strong>to</strong>rs. For passenger counting purposes,<br />
evaders occupy seats and therefore are passengers. Thus, transaction counts don’t<br />
necessarily translate directly in<strong>to</strong> passengers. Furthermore, some passengers pay partial<br />
fares (‘short drop’), using coins, partially-loaded farecards, or combinations of both. The<br />
not-quite-one-<strong>to</strong>-one relationship means that special care is required when interpreting<br />
transactions.<br />
4. Actual Trips Operated Don’t Match Published Schedules: Fareboxes record data<br />
about field operations, including actual Run No. and departure time. Matching AFC data<br />
<strong>to</strong> scheduled trips is very difficult, because of dispatchers’ ad-hoc changes in response <strong>to</strong><br />
traffic conditions. No electronic record is generally kept of these adjustments. <strong>Paper</strong><br />
forms are voluminous and s<strong>to</strong>red separately at 19 bus depots, making them difficult <strong>to</strong><br />
corral and key. Au<strong>to</strong>mated matching using departure time, Bus No., and Run No.<br />
produced approximately 70%~80% matches. Essentially, AFC data cannot be matched<br />
<strong>to</strong> schedules for extensive daily analyses.<br />
[Figure 1 shown next page]<br />
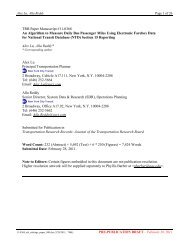
FIGURE 1 Transaction file layout and theoretical analysis of algorithm assumptions: (a)<br />
NYCT’s MetroCard AFC farebox EU65 transaction file rounds the transaction time <strong>to</strong> the<br />
nearest 6 minutes; (b) Errors in transaction time rounding cancels out in aggregate when the<br />
difference between embarkation and disembarkation time (i.e. onboard travel time) is computed;<br />
(c) Potential passenger-mile estimation impacts of the constant average speed assumption on a<br />
typical local route; (d) Potential underestimation on an inbound suburb-<strong>to</strong>-city express commuter<br />
bus.<br />
11-<strong>0368</strong>_afc_mileage_paper_038.doc (11/16/2010; 788k) NOVEMBER DRAFT – November 16, 2010
Alex Lu, Alla Reddy Page 7 of 26<br />
(a) 73 bytes per record × about 8,000,000 bus and subway records per weekday =<br />
approximately 550 megabytes per weekday (3:00 am <strong>to</strong> 2:59 am next day)<br />
Sample (not actual) data with bus-only records shown:<br />
....x....1....x....2....x....3....x....4....x....5....x....6....x....7.<br />
2653058017 20080416 55400 157 027 F02569 1 R482 0 362<br />
2653058017 20080416 63000 157 027 F0027F 1 R480 0 494<br />
2653058017 20080416 73600 157 027 F01E70 2 R494 0 153<br />
2653058017 20080416 160000 157 027 F01E72 2 R494 0 152<br />
2653058017 20080416 161800 157 027 F00214 1 R480 0 494<br />
2653058017 20080416 163600 157 027 F00129 1 R480 0 495<br />
2653058017 20080416 184800 157 027 F020B0 3 R515 0 645<br />
Fare Media Class (Unlimited, Pay-per-Ride)<br />
Transcation Code (Value Deduct, Transfer)<br />
Transaction Date and Time (Nearest Six Minutes)<br />
MetroCard ID (Serial Number)<br />
Bus Number in Hex (Subtract 0xF00000)<br />
Carrier (1 = TA, 2 = OA, 3 = MTABC)<br />
Value Deducted (0 for Unlimited Pass)<br />
Location Code (Bus Route and Direction)<br />
(c)<br />
Typical Local Bus<br />
(b)<br />
Boarding<br />
Disembarkation<br />
1 2 3 4 5 6 1 2 3 4 5 6<br />
No errors:<br />
6 cases<br />
+1 minute:<br />
5 cases<br />
Distance<br />
Mileages underestimated<br />
for psgrs boarding here,<br />
and overestimated for<br />
those disembarking here.<br />
Mileages overestimated for psgrs<br />
boarding here, underestimated<br />
for those disembarking here.<br />
-1 minute:<br />
5 cases<br />
(d)<br />
Time<br />
Inbound Express Bus<br />
-5 minute:<br />
only 1 case<br />
+5 minute:<br />
only 1 case<br />
Suburban<br />
Boarding<br />
Express<br />
Segment<br />
Drop<br />
Off<br />
Error<br />
distribution<br />
Distance<br />
Mileage underestimation<br />
occurs<br />
for all boardings.<br />
-5 4 3 2 1 0 1 2 3 4 5+<br />
No boardings<br />
occur in express<br />
or drop-off<br />
segments.<br />
Time<br />
11-<strong>0368</strong>_afc_mileage_paper_038.doc (11/16/2010; 788k) NOVEMBER DRAFT – November 16, 2010
Alex Lu, Alla Reddy Page 8 of 26<br />
1<br />
2<br />
3<br />
4<br />
5<br />
6<br />
7<br />
8<br />
9<br />
10<br />
11<br />
12<br />
13<br />
14<br />
15<br />
16<br />
17<br />
18<br />
19<br />
20<br />
21<br />
22<br />
23<br />
24<br />
25<br />
26<br />
27<br />
28<br />
29<br />
30<br />
31<br />
32<br />
33<br />
34<br />
35<br />
36<br />
37<br />
38<br />
39<br />
40<br />
41<br />
42<br />
43<br />
44<br />
45<br />
VALIDATING NECESSARY ALGORITHM ASSUMPTIONS<br />
Limitations in farebox data streams meant engineering assumptions were necessary for<br />
passenger-miles inference. Due <strong>to</strong> difficulties in matching trips, mileage estimation uses<br />
transaction data alone, supplemented with scheduled running times.<br />
Localization Relative <strong>to</strong> Trip Origins<br />
To determine locations from transaction times, buses are assumed <strong>to</strong> enter service at route origin,<br />
and must reach final destination before changing directions or deadheading <strong>to</strong> depot. The speeddistance-time<br />
formula is assumed <strong>to</strong> convert time elapsed since trip begin (called ‘relative time’)<br />
in<strong>to</strong> approximate boarding locations along the designated route – like “dead-reckoning”<br />
navigational devices, which tracks distance from known points accurately <strong>to</strong> derive current<br />
location. Obviously, traffic conditions and schedule accuracy affect localizations.<br />
Average NYCT bus speeds of 6~12 mph and transaction times rounded <strong>to</strong> nearest six minutes<br />
imply geographical discriminating power of approximately 0.6~1.2 miles (groups of 2~4 bus<br />
s<strong>to</strong>ps). While this range seems broad for individual boardings, distance travelled can be thought<br />
of as the difference between two uniformly distributed random variables, making it an unbiased<br />
estima<strong>to</strong>r of actual distance:<br />
1. Because estimated boarding and alighting times are subject <strong>to</strong>, on average, same uniform<br />
rounding aberrations, errors can cancel each other out (Figure 1(b)).<br />
2. Distribution of rounding errors is symmetrical and triangular; passengers are equally<br />
likely <strong>to</strong> board near six-minute period beginnings (mileage underestimation) as near the<br />
ends (mileage overestimation). The expected error is zero.<br />
Thus, in aggregate, transaction time resolution doesn’t pose undue difficulty for reporting <strong>to</strong>tal<br />
passenger miles and average trip lengths, although this property makes AFC data unhelpful for<br />
accurately moni<strong>to</strong>ring individual passenger ODs.<br />
Constant Average Speed Assumption<br />
Constant average speed assumptions implicit in distance-time conversions are a little more<br />
problematic, as NYCT has routes where average speeds vary considerably over the whole route.<br />
Express Bus average speeds might be ~15 mph at the residential end, 30~45 mph in non-s<strong>to</strong>p<br />
express portions, and <br />
route average) as underestimation (checkboard pattern). Express routes have lower-than-average<br />
speeds in suburban pickup zones, leading <strong>to</strong> minor overall mileage underestimations (Figure<br />
1(d)). NYCT’s scheduling software can actually provide average speeds between timepoint<br />
11-<strong>0368</strong>_afc_mileage_paper_038.doc (11/16/2010; 788k) NOVEMBER DRAFT – November 16, 2010
Alex Lu, Alla Reddy Page 9 of 26<br />
1<br />
2<br />
3<br />
4<br />
5<br />
6<br />
7<br />
8<br />
9<br />
10<br />
11<br />
12<br />
13<br />
14<br />
15<br />
16<br />
17<br />
18<br />
19<br />
20<br />
21<br />
22<br />
23<br />
24<br />
25<br />
26<br />
27<br />
28<br />
29<br />
30<br />
31<br />
32<br />
33<br />
34<br />
35<br />
36<br />
37<br />
38<br />
39<br />
40<br />
41<br />
42<br />
43<br />
44<br />
45<br />
46<br />
locations (major enroute s<strong>to</strong>ps). With additional development work, routes could be split up in<strong>to</strong><br />
zones with different scheduled average speeds, <strong>to</strong> improve accuracy, particularly on express<br />
routes.<br />
These assumptions are difficult <strong>to</strong> validate directly. Validating inferred locations entail<br />
equipping test vehicles with AVL and comparing AVL data with inferred AFC locations over<br />
many different routes. As long as localization errors cancel out on average and without<br />
significant bias, estimated passenger miles are accurate.<br />
Symmetric Daily Activity Pattern Assumption<br />
AFC reports fare payment transactions, which occurs upon boarding on NYCT’s buses, making<br />
it impossible <strong>to</strong> ascertain alighting times or locations directly. Two assumptions allow relative<br />
times (and thus locations) of disembarkations <strong>to</strong> be inferred on an aggregate basis:<br />
1. Conservation of Passengers: One passenger boarding a bus at one location sometime<br />
during the day is balanced by another passenger deboarding another bus at that location<br />
sometime that day. Essentially, this describes bus passengers’ typical behaviours.<br />
Passengers leave their home s<strong>to</strong>p in the morning and arrive at that same s<strong>to</strong>p at the day’s<br />
end; passengers disembarking at work are picked up from the same s<strong>to</strong>p at lunch <strong>to</strong> run<br />
errands; those alighting <strong>to</strong> run errands are collected moments later from there, and so on.<br />
2. Equal and Opposite Passenger Activities in Opposing Directions: Passengers<br />
alighting for any reason boards another bus from the same location, on the same route or<br />
group of routes, in the opposite direction. Since 70% of NYCT s<strong>to</strong>ps are served by only<br />
one route, passengers arriving and leaving by bus generally don’t have options besides<br />
making return trips on an opposing number. Even where multiple routes serve one s<strong>to</strong>p,<br />
shared routes (e.g. BX40/BX42, BX1/BX2) often have equal trunk service frequencies,<br />
thus passengers arriving on one route and returning on another is compensated by<br />
passengers arriving on the latter and returning via the former. This assumption is<br />
violated when passengers switch <strong>to</strong> different modes or “triangulate” by travelling <strong>to</strong> nonorigin<br />
locations on their second trip. However, this is rare, and where it happens, effects<br />
likely occur equally in both directions, e.g. likely as many passengers alight from<br />
eastbound BX12 at Fordham Plaza <strong>to</strong> run errands then continue east – as passengers who<br />
alight from westbound BX12 and continue west.<br />
To validate these assumptions, Surface Ridecheck (SR) data, collected for schedule-making<br />
purposes, is used. SR provides intensive record of all boarding and alighting locations on all bus<br />
trips for one particular route on survey day (except for small fraction of missed trips). This data,<br />
when summarized by s<strong>to</strong>p for the whole day, demonstrates close correlation between daily<br />
boarding and alighting activities at all s<strong>to</strong>ps, and that boardings in one direction closely<br />
correlates with alightings in the other. BX55 is a north-south limited-s<strong>to</strong>p feeder that replaced<br />
Bronx’s Third Avenue el. BX55’s On-Off correlation R-squared of close <strong>to</strong> one demonstrates<br />
that opposing direction daily boardings is a good predic<strong>to</strong>r for daily alightings (Figure 2(a),(b)).<br />
However, proving that correlation holds for BX55 doesn’t mean it holds systemwide. A (nonscientific)<br />
sample of different routes types was selected and R-squared computed for cumulative<br />
11-<strong>0368</strong>_afc_mileage_paper_038.doc (11/16/2010; 788k) NOVEMBER DRAFT – November 16, 2010
Alex Lu, Alla Reddy Page 10 of 26<br />
1<br />
2<br />
3<br />
4<br />
5<br />
6<br />
7<br />
8<br />
9<br />
10<br />
11<br />
12<br />
13<br />
14<br />
15<br />
16<br />
17<br />
18<br />
19<br />
20<br />
21<br />
22<br />
23<br />
24<br />
25<br />
26<br />
27<br />
28<br />
29<br />
30<br />
31<br />
32<br />
33<br />
34<br />
35<br />
36<br />
37<br />
38<br />
39<br />
40<br />
41<br />
42<br />
43<br />
boardings (Ons) and reverse-direction alightings (Offs). Although R-squared remained high for<br />
many route types (Figure 2(e)), several low values require explanation. S60 (Grymes Hill) is a<br />
circula<strong>to</strong>r with low ridership (210 weekday riders) whose purpose is basically <strong>to</strong> drive<br />
passengers “up the hill” from Vic<strong>to</strong>ry Blvd, resulting in an asymmetrical dogbone-shaped routepath<br />
(Figure 2(c)) that serves more s<strong>to</strong>ps and is longer uphill. Low ridership also contributes<br />
insufficient riders <strong>to</strong> show symmetry. B51 (Manhattan Bridge) has an asymmetrical baseball-cap<br />
shape (Figure 2(d)) with limited pick-up s<strong>to</strong>ps outbound but makes many drop-off s<strong>to</strong>ps inbound,<br />
serving as distribu<strong>to</strong>r in Manhattan’s China<strong>to</strong>wn for bus passengers transferring from other buses<br />
in Down<strong>to</strong>wn Brooklyn, but not the reverse. Essentially, these routes have asymmetrical shapes,<br />
violating symmetry assumptions. Both “oddball” routes were eliminated in the 2010 Route<br />
Rationalizations (34).<br />
Unbalanced Route Assumption<br />
NYCT has “unbalanced” bus routes, i.e. significantly different daily inbound and outbound<br />
ridership. General reasons include: (a) different late-night travel patterns, particularly for shift<br />
workers; (b) morning rush carpooling and drop-offs when the reverse isn’t feasible in afternoons;<br />
(c) trip triangulation from different afternoon modal preferences and/or additional activities like<br />
after-work errands.<br />
Figure 2(e) actually shows several routes with substantial unbalance: M15 (1/2 Av), busier<br />
southbound (predominantly morning rush direction) because of substantial afternoon traffic<br />
congestion, diverting riders <strong>to</strong> parallel Lexing<strong>to</strong>n Av subway; B42 (Canarsie Beach), busier<br />
southbound (afternoon) because of timed outbound connections with Canarsie Line at Rockaway<br />
Parkway; B31 (Mill Basin), busier southbound (afternoon) because of substantial competition<br />
with MTA Bus’s BM4, like all express buses, is busier (and more frequent) in the morning; Q46<br />
(Union Tpk), Q83 (Liberty Av), busier eastbound (<strong>to</strong> Long Island) because of morning<br />
carpooling. Two assumptions allow unbalanced routes not <strong>to</strong> be treated differently:<br />
1. Symmetry for Unbalanced Routes: Symmetric daily activity pattern is assumed <strong>to</strong> hold,<br />
as substantiated by high R-squared on these routes.<br />
2. Small Convexity Differences: Convexity differences between true disembarkation<br />
cumulative ridership curves and opposing-direction boarding curves are small, such that<br />
algorithm’s curve-swapping implementation (Figure 4(d)) doesn’t introduce unacceptable<br />
passenger-mile estimation errors by not explicitly scaling curves <strong>to</strong> match unbalanced<br />
opposing-direction boardings.<br />
End-of-Trip Assumption<br />
If maximum trip time (plus reasonable recovery time) is reached and no changes in headsign<br />
occurred, it is assumed that driver forgot <strong>to</strong> do so. The bus is assumed <strong>to</strong> turn around and begin<br />
return trip in the opposite direction. Swipes subsequent <strong>to</strong> this point are assigned <strong>to</strong> the<br />
subsequent trip. This process is repeated until next headsign change is detected (occurs when<br />
subsequent relief drivers ‘remember’ <strong>to</strong> change it), or until bus returns <strong>to</strong> depot for the day.<br />
11-<strong>0368</strong>_afc_mileage_paper_038.doc (11/16/2010; 788k) NOVEMBER DRAFT – November 16, 2010
Alex Lu, Alla Reddy Page 11 of 26<br />
1<br />
2<br />
3<br />
4<br />
5<br />
6<br />
7<br />
8<br />
9<br />
10<br />
11<br />
12<br />
13<br />
14<br />
15<br />
16<br />
17<br />
18<br />
19<br />
20<br />
21<br />
22<br />
23<br />
24<br />
25<br />
26<br />
Correction Fac<strong>to</strong>rs Assumption<br />
Only transaction data is used in this algorithm, making correction fac<strong>to</strong>rs necessary for non-AFC<br />
cus<strong>to</strong>mers (cash, evaders, flash passes, etc.) Non-AFC passenger boarding locations and counts<br />
(due <strong>to</strong> reduced-fares, short-drops) cannot be reliably ascertained, thus no mileages can be<br />
calculated. Correction fac<strong>to</strong>rs for counts and miles implicitly assume non-AFC cus<strong>to</strong>mers (25%<br />
of ridership) have substantially similar trip patterns <strong>to</strong> AFC cus<strong>to</strong>mers – i.e. average trip length<br />
for non-AFC is same as AFC cus<strong>to</strong>mers. Available evidence suggests that cash riders are not<br />
equally distributed throughout Chicago’s subway system (3), and both cash fares and evaders are<br />
likely concentrated in lower-income areas in New York (35). Due <strong>to</strong> NYCT’s substantial<br />
interlining and split-depot bus operations, cash data isn’t available by route. With additional<br />
research and/or data collection, correction fac<strong>to</strong>rs can be calibrated at a depot or route level,<br />
potentially capturing between-neighbourhood variations.<br />
[Figure 2 shown next page]<br />
FIGURE 2 Data from NYCT’s Surface Ridecheck program is used <strong>to</strong> validate the symmetric<br />
daily activity pattern assumption: (a) BX55 activity data shows good correlation between Ons<br />
and reverse direction Offs; (b) Symmetry assumption holds on the BX55 cumulative activity<br />
curves; (c) Dogbone shaped S60 is not at all symmetrical, resulting in low R-squared; (d)<br />
Baseball-cap shaped B51 has a loop in Manhattan and is limited-s<strong>to</strong>p in one direction only, also<br />
violating symmetry assumptions; (e) Other routes show high daily On/Off correlation R-squared.<br />
11-<strong>0368</strong>_afc_mileage_paper_038.doc (11/16/2010; 788k) NOVEMBER DRAFT – November 16, 2010
Alex Lu, Alla Reddy Page 12 of 26<br />
(a)<br />
(c)<br />
Activity Level (Daily<br />
Passengers)<br />
Activity Level (Daily<br />
Passengers)<br />
3,500<br />
3,000<br />
2,500<br />
2,000<br />
1,500<br />
1,000<br />
500<br />
0<br />
3,500<br />
3,000<br />
2,500<br />
2,000<br />
1,500<br />
1,000<br />
500<br />
0<br />
Northbound Ons/Southbound Offs<br />
N/B Ons S/B Offs<br />
RSQ = 0.9256<br />
Southbound Ons/Northbound Offs<br />
S/B Ons N/B Of f s RSQ = 0.9670<br />
Willis Av-E 148 St (Subway)<br />
3 Av-E 149 St<br />
E 157 St<br />
E 163 St<br />
E 166 St<br />
E 169 St<br />
Claremont Pkwy<br />
E 174 St<br />
E Tremont Av<br />
E 180 St<br />
E 184 St<br />
S<strong>to</strong>ps<br />
3 Av-E Fordham Rd<br />
Webster Av-E Fordham Rd<br />
Bedford Pk Bl<br />
E 204 St<br />
E 205 St<br />
White Plains Rd (Subway)<br />
Bathgate Av-E 172 St<br />
(d)<br />
(b)<br />
12,000<br />
Cumulative and Reverse Cumulative/Ons and Offs<br />
(e)<br />
Total Daily Passengers<br />
10,000<br />
8,000<br />
6,000<br />
4,000<br />
2,000<br />
0<br />
S/B Reverse Cumulative Ons<br />
N/B Cumulative Ons<br />
S/B Reverse Cumulative Offs<br />
N/B Cumulative Offs<br />
1 2 3 4 5 6 7 8 9 10 11 12 13 14 15 16 17 18<br />
S<strong>to</strong>ps Sequence<br />
Route<br />
Type<br />
Boarding<br />
Direction<br />
R-squared<br />
Boarding<br />
Direction R-squared Route Type<br />
Boarding<br />
Direction<br />
R-squared<br />
Boarding<br />
Direction<br />
R-squared<br />
BX12 Cross<strong>to</strong>wn-feeder hybrid EB 0.992 WB 0.996 Q46 Suburban trunk EB 0.972 WB 0.999<br />
BX29 Double-ended feeder EB 0.983 WB 0.981 Q74 Campus feeder/circula<strong>to</strong>r NB 0.904 SB 0.962<br />
BX55 Limited s<strong>to</strong>p trunk NB 0.997 SB 0.999 Q79 Suburban cross<strong>to</strong>wn NB 0.982 SB 0.981<br />
B31 Low density feeder NB 0.992 SB 0.994 Q83 Suburban feeder EB 0.995 WB 0.996<br />
B42 Subway extension NB 0.978 SB 0.985 S4090 Suburban trunk EB 0.994 WB 0.997<br />
B51 Bridge route NB 0.833 SB 0.907 S52 Suburban feeder NB 0.973 SB 0.986<br />
M15 High volume trunk route NB 0.987 SB 0.993 S60 Neighbourhood circula<strong>to</strong>r NB 0.698 SB 0.833<br />
M18 Branch shuttle NB 0.924 SB 0.978 S79 Suburban trunk NB 0.999 SB 0.986<br />
11-<strong>0368</strong>_afc_mileage_paper_038.doc (11/16/2010; 788k) NOVEMBER DRAFT – November 16, 2010
Alex Lu, Alla Reddy Page 13 of 26<br />
1<br />
2<br />
3<br />
4<br />
5<br />
6<br />
7<br />
8<br />
9<br />
10<br />
11<br />
12<br />
13<br />
14<br />
15<br />
16<br />
17<br />
18<br />
19<br />
20<br />
21<br />
22<br />
23<br />
24<br />
25<br />
26<br />
27<br />
28<br />
29<br />
30<br />
31<br />
32<br />
33<br />
34<br />
35<br />
36<br />
37<br />
THE AFC PASSENGER MILEAGE ALGORITHM<br />
This algorithm’s input is NYCT’s daily AFC file, described above. Output is a list of partial<br />
mileage integrals (representing each six-minute period on every trip), when summarized,<br />
produces <strong>to</strong>tal passengers and passenger-miles traveled, by route, for that day. With this<br />
algorithm, passenger miles cannot be inferred for each trip or each direction because passenger<br />
disembarkations don’t generate swipe records, requiring the symmetric daily activity pattern<br />
assumption (Figure 3(a)). Average trip length is computed from passenger miles and counts.<br />
With assumptions in place, algorithm derivation essentially reduces <strong>to</strong> several fairly basic<br />
transformations on a numerical integral of cumulative On-Off (passenger) and Location (miles)<br />
curves (Figure 3(d)). To identify cumulative activity curves using AFC data:<br />
1. Filter out only bus records from bus and subway combined transaction file;<br />
2. Sort bus transactions by bus number, then date/time, <strong>to</strong> put specific vehicles’ daily<br />
activity in temporal sequence;<br />
3. Cut transaction records in<strong>to</strong> trips, using headsign (location code) changes and end-of-trip<br />
assumptions <strong>to</strong> identify new trips;<br />
4. Convert swipe date/time in<strong>to</strong> time elapsed since last headsign change (‘relative time’),<br />
translate <strong>to</strong> miles along the route using scheduled average speeds.<br />
Lookup tables (Figure 4(b)) relates location codes, day types, and time-of-day (by hour) <strong>to</strong> route,<br />
direction, route length (in miles), and running time. Because both route length and running time<br />
is time-of-day dependent, transaction time (<strong>to</strong> nearest hour) is used <strong>to</strong> lookup distance estimation<br />
(from trip origin). Once computed, cumulative On-Off curves are fed in<strong>to</strong> the algorithm’s<br />
integration stage (Figure 3(b)). As the flowchart (Figure 4(a)) demonstrate, most program<br />
control logic deals with manipulating transaction file, detecting swipes, six-minute periods, and<br />
trips. Actual numerical integral for computing passenger miles constitutes merely a few lines of<br />
code, due <strong>to</strong> efforts expended in seeking geometric transformations that simplify calculations and<br />
reduce program execution time. The production program processes one weekday in ~3 minutes<br />
on typical computer workstations.<br />
Lookup tables are updated four times a year when schedules change. Queries extract this data<br />
directly from NYCT’s computerized crew scheduling and run-cutting system.<br />
11-<strong>0368</strong>_afc_mileage_paper_038.doc (11/16/2010; 788k) NOVEMBER DRAFT – November 16, 2010
Alex Lu, Alla Reddy Page 14 of 26<br />
(a) The daily summary AFC observable Ons-by-S<strong>to</strong>p<br />
curves (in both directions) are reflected <strong>to</strong> produce the<br />
non-observable Offs-by-S<strong>to</strong>p curves, based on the<br />
symmetry assumption (right).<br />
Ons<br />
(1) Opposing direction Ons on the same route infers Offs<br />
24 hrs<br />
24 hrs<br />
EB<br />
WB<br />
Ons<br />
W<br />
S<strong>to</strong>ps<br />
E<br />
Symmetry<br />
W<br />
S<strong>to</strong>ps<br />
E<br />
EB<br />
Offs<br />
Offs<br />
(2) Intergrating Loads over S<strong>to</strong>ps equals Passenger Miles<br />
W<br />
S<strong>to</strong>ps<br />
E<br />
W<br />
S<strong>to</strong>ps<br />
E<br />
Ons<br />
W<br />
W<br />
24 hrs<br />
S<strong>to</strong>ps<br />
S<strong>to</strong>ps<br />
EB<br />
WB<br />
E<br />
E<br />
Ons<br />
Numerical<br />
Integration<br />
Cumulative Ons<br />
EB<br />
Ons<br />
S<strong>to</strong>ps<br />
(c) The cumulative values clearly show graphically the<br />
Loads at a given s<strong>to</strong>p, and the Mileage incurred by a single<br />
passenger along the route (right). The mileage incurred by<br />
all passengers is thus the sum of the area under the<br />
cumulative curve (far right).<br />
W<br />
WB Ons<br />
= EB Offs<br />
E<br />
(b) The Ons-by-S<strong>to</strong>p and Offs-by-S<strong>to</strong>p curves are then<br />
integrated (i.e. cumulative values are computed) <strong>to</strong>gether<br />
<strong>to</strong> produce the cumulative On-Off (Load) by-S<strong>to</strong>p curve<br />
(left).<br />
(d) Finally, <strong>to</strong> simplify computation of area for the irregular shape between the cumulative Ons and Offs<br />
curves, the curves are swapped in such a way that preserves the <strong>to</strong>tal area but increases the symmetry<br />
(below left). The final integral <strong>to</strong> be evaluated turns out <strong>to</strong> be the sum of all passenger miles from<br />
boarding location <strong>to</strong> the end of the<br />
(3) Swapping curves simplifies numerical calculation<br />
Psgr miles from<br />
Empty seat miles from<br />
trip, subtract all empty seat miles<br />
Area under curve is<br />
boarding location<br />
beginning of trip <strong>to</strong><br />
<strong>to</strong>tal psgr miles<br />
<strong>to</strong> end of trip<br />
boarding location<br />
from the beginning of the trip <strong>to</strong><br />
boarding location. These<br />
EB<br />
geometric transformations greatly<br />
simplify computation as the<br />
–<br />
program would need <strong>to</strong> consider<br />
only two variables: the length of a<br />
W<br />
S<strong>to</strong>ps<br />
E<br />
trip on the route, and the location<br />
+<br />
= + =<br />
+<br />
of each boarding relative <strong>to</strong> the<br />
route’s beginning and end.<br />
Cumulative Ons<br />
WB<br />
Cumulative Ons<br />
–<br />
Cumulative Ons<br />
Load at<br />
a s<strong>to</strong>p<br />
W<br />
Miles<br />
travelled<br />
by a psgr<br />
S<strong>to</strong>ps<br />
E<br />
Cumulative Ons<br />
W<br />
Area under<br />
curve is <strong>to</strong>tal<br />
psgr miles<br />
S<strong>to</strong>ps<br />
E<br />
W<br />
S<strong>to</strong>ps<br />
E<br />
The four-step integral shown above is the calculation<br />
computed in the Step 2 algorithm.<br />
FIGURE 3 Graphical illustration of NYCT’s AFC bus passenger mileage algorithm derivation.<br />
11-<strong>0368</strong>_afc_mileage_paper_038.doc (11/16/2010; 788k) NOVEMBER DRAFT – November 16, 2010
Alex Lu, Alla Reddy Page 15 of 26<br />
Start Step 2<br />
Step 1 Logfile<br />
AFC_DATE.$$$<br />
Determine service<br />
daytype (W/A/U) based<br />
on Step 1 Logfile<br />
EU65<br />
LOCMILETIME.FIL<br />
W/A/U<br />
Read the appropriate<br />
LOCMILETIME.FIL in<strong>to</strong> memory<br />
based on daytype while validating<br />
primary key uniqueness and sort<br />
Open the EU65 file previously sorted<br />
by Booth (Carrier), Turnstile No (Bus<br />
No), Farebox No, Date, Time, Location<br />
Code from Step 1B.<br />
Read in first record<br />
Swipecount = 0<br />
Decode first record <strong>to</strong> get TripKey (identifies<br />
trip), TripTimeKey (identifies trip and particular<br />
six-minute interval), MSBOD, Trip Start Time,<br />
Carrier, and LocCode<br />
No<br />
End of file?<br />
Yes<br />
End of input file<br />
or Subway region<br />
reached?<br />
No<br />
Read in next EU65 record<br />
Increment Swipecount<br />
Yes<br />
Increment Swipecount and<br />
record count; Decode and<br />
writeout last record.<br />
Close files and clean up<br />
This record = Next record<br />
(MSBOD, Carrier, and<br />
LocCode are reassigned)<br />
Decode next record <strong>to</strong> get TripKey<br />
(identifies trip), TripTimeKey (identifies<br />
trip and particular six-minute interval),<br />
MSBOD, Carrier, and LocCode<br />
End Step 2<br />
Yes<br />
(same trip and 6-minute period)<br />
This TripTimeKey =<br />
Next TripTimeKey?<br />
LOCMILETIME_W.FIL<br />
No<br />
....x....1....x....2....x....3....x....4.<br />
PRI_KEY ROUTE D LOC SIGN HR MILES SRT<br />
------- -------- - ---- ---- -- ----- ---<br />
0042W21 M15 N 0042 1150 21 08663 073<br />
0042W22 M15 N 0042 1150 22 08595 068<br />
0042W23 M15 N 0042 1150 23 08520 055<br />
0042W24 M15 N 0042 1150 24 08015 072<br />
0043W05 M15LTD S 0043 8153 05 08790 054<br />
0043W06 M15LTD S 0043 8151 06 08404 058<br />
0043W07 M15LTD S 0043 8151 07 08402 079<br />
0043W08 M15LTD S 0043 8151 08 08073 081<br />
0043W09 M15LTD S 0043 8151 09 08261 083<br />
PRI_KEY = Composite Primary Key<br />
ROUTE = Bus Route<br />
D = Direction<br />
LOC = AFC Location Code<br />
SIGN = Flipdot Headsign Code<br />
HR = Hour<br />
MILES = Route Length in 1 / 1000 Miles<br />
SRT = Scheduled Running Time in Minutes<br />
This TripTimeKey =<br />
Next TripTimeKey<br />
Lookup Route, Direction, Scheduled Trip<br />
Duration and Scheduled Trip Length in<br />
LOCMILETIME.FIL based on LocCode,<br />
Trip Start Time, and Service Day<br />
Compute passenger miles: (a) incurred by<br />
passengers between this point and end of<br />
trip; (b) incurred by empty seat between<br />
this point and beginning of the trip. See<br />
separate explanation of algorithm.<br />
Yes<br />
Writeout information associated with<br />
this TripTimeKey (i.e. this trip and 6-<br />
minute period). Swipecount = 0.<br />
Increment record count.<br />
This TripKey =<br />
Next TripKey?<br />
(Same trip?)<br />
No<br />
Trip Start Time = Next Trip Time<br />
This TripKey = Next TripKey<br />
FIGURE 4 AFC passenger mileage program flowchart and time-distance lookup file.<br />
11-<strong>0368</strong>_afc_mileage_paper_038.doc (11/16/2010; 788k) NOVEMBER DRAFT – November 16, 2010
Alex Lu, Alla Reddy Page 16 of 26<br />
1<br />
2<br />
3<br />
4<br />
5<br />
6<br />
7<br />
8<br />
9<br />
10<br />
11<br />
12<br />
13<br />
14<br />
15<br />
16<br />
17<br />
18<br />
19<br />
20<br />
21<br />
22<br />
23<br />
24<br />
25<br />
26<br />
27<br />
28<br />
29<br />
30<br />
31<br />
32<br />
33<br />
34<br />
35<br />
36<br />
37<br />
38<br />
39<br />
40<br />
41<br />
42<br />
43<br />
44<br />
45<br />
DERIVING CORRECTION FACTORS<br />
Despite widespread adoption of MetroCard for subway fare payment (>95%), AFC achieves<br />
only 75% market share amongst paid bus riders, because only 93 of the 2,265 MetroCard<br />
Vending/Express Machines (MVM/MEMs) are located at bus s<strong>to</strong>ps. The wide retail MetroCard<br />
distribu<strong>to</strong>r <strong>net</strong>work isn’t always immediately convenient <strong>to</strong> every bus patron. Bus fareboxes<br />
labour in extremely harsh conditions, subject <strong>to</strong> constant vibration, vandalism, and foreign<br />
materials introduced by wet or sticky farecards. Transactions are sometimes lost even after fares<br />
are correctly deducted from valid farecards. While New York has strong criminal laws that<br />
permit up <strong>to</strong> seven years’ imprisonment for persons assaulting public transit employees (36,37),<br />
NYCT operates in <strong>to</strong>ugh urban neighbourhoods where some cus<strong>to</strong>mers blatantly refuse <strong>to</strong> pay<br />
fare or even attack drivers (38).<br />
For all these reasons, correction fac<strong>to</strong>rs must be applied <strong>to</strong> AFC data <strong>to</strong> correct for these “AFC<br />
Unaccountable” ridership – actual trips consumed that aren’t recorded in transaction file.<br />
Generally speaking, unaccountable ridership falls within three broad categories:<br />
• Cash Passengers, whose transactions cannot be individually ascertained. NYCT’s<br />
farebox reports cash received by trip and fare class, not individual transactions.<br />
• Non-Farebox Passengers, who don’t interact with fareboxes due <strong>to</strong> reasons like broken<br />
fareboxes, fare evasion, paper tickets, and flash passes.<br />
• Farebox Data Transmission Errors result in missing transaction data even though AFC<br />
fares were paid normally.<br />
Cash Passenger Adjustment<br />
NYCT produces monthly summary actual revenue reports by route and fare media. Bus trips are<br />
broken out in<strong>to</strong> percentages by fare media. Cash revenues registered divided by full cash fare<br />
(currently $2.25 for local buses) yields an approximate (lower bound) cash passenger count.<br />
Based on the correction fac<strong>to</strong>r assumption, cash adjustment fac<strong>to</strong>r (updated monthly) is the ratio<br />
of cash passengers (non-AFC fares) <strong>to</strong> farecard transaction counts (AFC fares), before<br />
adjustments for non-farebox passengers.<br />
Non-Farebox Passenger Adjustment<br />
Non-farebox adjustment is the most complicated fac<strong>to</strong>r <strong>to</strong> estimate, requiring special surveys that<br />
measure fraction of fare evaders, pass riders, paper tickets, and fraction of trips operated with<br />
malfunctioning fareboxes (resulting in opera<strong>to</strong>r permitting passengers <strong>to</strong> board without fare).<br />
FTA requested, and NYCT conducted such a detailed and extensive study in 2008, gathering<br />
data at 10,635 bus s<strong>to</strong>p events, witnessing 22,980 boardings (Figure 5(a)). Specially trained<br />
surveyors were assigned <strong>to</strong> ride specific trips using a stratified random sample covering 24/7<br />
operations. Surveyors, seated near the bus’s front door, classified each boarding as one of 13<br />
mutually exclusive categories. 421 discrete trips were observed between May 13 and November<br />
29, 2008. Ridership where transaction data was lost (farebox malfunction and/or memory<br />
failure) was separately estimated using AFC data.<br />
11-<strong>0368</strong>_afc_mileage_paper_038.doc (11/16/2010; 788k) NOVEMBER DRAFT – November 16, 2010
Alex Lu, Alla Reddy Page 17 of 26<br />
1<br />
2<br />
3<br />
4<br />
5<br />
6<br />
7<br />
8<br />
9<br />
10<br />
11<br />
12<br />
13<br />
14<br />
15<br />
16<br />
17<br />
18<br />
19<br />
20<br />
21<br />
22<br />
23<br />
24<br />
25<br />
26<br />
27<br />
28<br />
29<br />
30<br />
31<br />
32<br />
33<br />
34<br />
35<br />
36<br />
37<br />
38<br />
39<br />
Non-farebox passengers are expressed as a fraction of AFC counts (<strong>to</strong> provide an expansion<br />
adjustment fac<strong>to</strong>r), computed as 2,477 ÷ 20,503 = 0.121 (alternatively 10.8% ÷ 89.2% = 12.1%).<br />
This fac<strong>to</strong>r can be updated periodically with surveys as deemed necessary.<br />
Farebox Data Transmission Error Adjustment<br />
NYCT’s AFC group produces bi-monthly reports estimating farebox data transmission error<br />
impacts. Ratio of farebox-registered cash <strong>to</strong> coins physically received and counted at the<br />
Consolidated Revenue Facility (colloquially, “Money Room number”) is reported by depot.<br />
When revenues received exceed passenger registrations, reasons generally are farebox<br />
undercounting or improper data upload; passenger overpayments are very rare. Money Room<br />
number is the adjustment fac<strong>to</strong>r <strong>to</strong> compensate for data transmission errors. Systemwide<br />
weighted average (by each depot’s monthly trips operated) is used.<br />
SBS Correction Fac<strong>to</strong>rs<br />
NYCT obtains<br />
ridership directly by “probing” MFCs. Transaction counts from<br />
MFCs and CFCs are available from June 29, 2008, when POP was launched. Monthly raw count<br />
must be corrected for non-receipt passengers and data transmission errors.<br />
NYCT conducted a BX12 payment study in May-June 2009, observing 1,881 fare payment<br />
transactions for 2,278 boardings, leaving 397 boardings (or 17.4%) unaccounted for (Figure<br />
5(b)). However, 3.4% of non-receipt boardings were by Children Under 44” (requiring no<br />
receipts when accompanied by paying adults), and about 1% were boardings by railroad<br />
universal farecard “UniTickets” holders (estimated from sales and usage data). This 4.4%<br />
combined <strong>to</strong>tal was actually valid boardings that legitimately did not require receipts. Thus,<br />
“unaccountable” boardings account for 17.4% – 4.4% = 13.0% of ridership (33). Non-receipt<br />
adjustment expansion fac<strong>to</strong>r is thus 13.0% ÷ (1 – 13.0%) = 14.9%.<br />
Using outlier analysis and manual data correction (substituting averages where values are<br />
missing), NYCT’s ridership unit produced MFC transmission error estimations. The ratio of<br />
monthly registered <strong>to</strong> estimated swipes (based on MFC reporting failure patterns) is used.<br />
Total Adjustments<br />
Adjustment categories are mutually exclusive, thus fac<strong>to</strong>rs are simply added <strong>to</strong>gether <strong>to</strong> obtain an<br />
overall adjustment fac<strong>to</strong>r (Figure 5(c)). Fac<strong>to</strong>rs are expressed as percentages of raw transaction<br />
file counts. SBS counts are separately added manually in spreadsheets. Same adjustment fac<strong>to</strong>rs<br />
are applied <strong>to</strong> both unlinked-trip and passenger-mile statistics.<br />
11-<strong>0368</strong>_afc_mileage_paper_038.doc (11/16/2010; 788k) NOVEMBER DRAFT – November 16, 2010
Alex Lu, Alla Reddy Page 18 of 26<br />
(a) Non-Farebox Passenger Survey Results<br />
Category Passengers Observed Percentage Notes<br />
Valid MetroCard Fare 19,630 85.4%<br />
Valid Split Fare 294 1.3%<br />
Invalid MetroCard Fare 449 2.0%<br />
Invalid Split Fare 130 0.6%<br />
Sub<strong>to</strong>tal AFC Counted Passengers 20,503 89.2%<br />
Front Door Non-Paying Passenger 644 2.8%<br />
Rear Door Non-Paying Passenger 110 0.5%<br />
Child Over 44" Travelling Without Fare 413 1.8%<br />
<strong>Paper</strong> Ticket 47 0.2%<br />
Child Under 44" Travelling Without Fare 557 2.4%<br />
Flash Pass, Uniform, or Official Badge 268 1.2%<br />
Wheelchair Travelling Without Fare 44 0.2%<br />
Seamless Transfers 1 31 0.1%<br />
Select Bus Receipt on BX12 Local 2 27 0.1%<br />
% of Trips with Farebox Malfunction 1.40%<br />
Broken Farebox Psgr Boardings 3 336 1.5%<br />
Sub<strong>to</strong>tal Unaccountable Passengers 2,477 10.8%<br />
Total Passengers 22,980 100.0%<br />
(b) BX12 Select Bus Service Non-Receipt Boarding Survey Results<br />
1. Transfers between<br />
Train and B42 Bus <strong>to</strong><br />
Canarsie Beach at<br />
Canarsie Subway station<br />
occurs within fare control.<br />
Transferring passengers<br />
are not required <strong>to</strong> swipe<br />
upon boarding, thus no<br />
AFC record is generated.<br />
2. BX12 Select Bus utilizes<br />
a proof-of-payment (POP)<br />
fare collection system.<br />
POP receipts are not valid<br />
on board BX12 local buses,<br />
but are occasionally<br />
accepted by drivers.<br />
3. Estimated passenger<br />
boardings during farebox<br />
malfunction based on 1.4%<br />
evenly distributed.<br />
Category Total Count Rate Notes<br />
Fares Paid – MetroCard Valida<strong>to</strong>rs 1,847<br />
Fares Paid – Coin Fare Collec<strong>to</strong>rs 41<br />
Paid Passengers Boarding Local Service (Leakage) 4 -7<br />
Passenger Registrations Observed 1,881 —<br />
Front Door Entries 1,383<br />
Rear Door Entries 895<br />
Passenger Boardings Observed 2,278 —<br />
Boardings minus Registrations 397 17.4% ±2%<br />
Exempt (non-Receipt) Adjustment 5 — 4.4%<br />
Rate of Unaccountable Boardings — 13.0% ±2%<br />
(c) All Required Correction Fac<strong>to</strong>rs <strong>to</strong> AFC Data<br />
4. POP receipts are<br />
occasionally redeemed on<br />
BX12 local buses.<br />
5. Includes Children under<br />
44”, and passengers with<br />
UniTickets (commuter<br />
railroad universal fare<br />
media, accepted only on<br />
feeder buses).<br />
Service Bus Passengers Description<br />
Fac<strong>to</strong>r<br />
Req’d?<br />
Fac<strong>to</strong>r<br />
Value<br />
Standard In EU65 MetroCard Base “raw” passenger boarding data from the<br />
Bus Transaction File<br />
MetroCard AFC system.<br />
No —<br />
Cash Passengers Passengers not using electronic fare media. Yes 15.4%<br />
Non-Farebox Passengers Passengers not interacting with farebox due <strong>to</strong> broken<br />
farebox, fare evasion, paper tickets, flash passes, etc.<br />
Yes 12.1%<br />
Farebox Data<br />
Passengers paying fare normally but data not in EU65<br />
Transmission Errors file due <strong>to</strong> farebox data transmission malfunction.<br />
Yes 5.4%<br />
Total Adjustment Fac<strong>to</strong>r (Standard Bus) 32.9%<br />
Select<br />
Bus<br />
Service<br />
Revenue Passenger Data<br />
from Select Bus Service<br />
Fare Validation Machines<br />
Non-Receipt Passengers<br />
Number of receipts issued by the Proof-of-Payment<br />
wayside fare collection machines (Cash and<br />
MetroCard) on the BX12 Select Bus Service.<br />
Passengers without POP receipts due <strong>to</strong> fare evasion,<br />
paper tickets, and flash passes, etc.<br />
Passengers paying fare normally, but not recorded<br />
because of fare payment machine malfunction.<br />
No —<br />
Yes 14.9%<br />
Fare Validation Machine<br />
Data Transmission Errors<br />
Yes 2.0%<br />
Total Adjustment Fac<strong>to</strong>r (Select Bus) 16.9%<br />
FIGURE 5 Derivation of correction fac<strong>to</strong>rs used <strong>to</strong> adjust data for non-AFC fares: (a) Nonfarebox<br />
passenger survey; (b) POP leakage survey; (c) All correction fac<strong>to</strong>rs.<br />
11-<strong>0368</strong>_afc_mileage_paper_038.doc (11/16/2010; 788k) NOVEMBER DRAFT – November 16, 2010
Alex Lu, Alla Reddy Page 19 of 26<br />
1<br />
2<br />
3<br />
4<br />
5<br />
6<br />
7<br />
8<br />
9<br />
10<br />
11<br />
12<br />
13<br />
14<br />
15<br />
16<br />
17<br />
18<br />
19<br />
20<br />
21<br />
22<br />
23<br />
24<br />
25<br />
26<br />
27<br />
28<br />
29<br />
30<br />
31<br />
32<br />
33<br />
34<br />
35<br />
36<br />
37<br />
38<br />
39<br />
40<br />
41<br />
42<br />
43<br />
44<br />
45<br />
PARALLEL TESTING<br />
Although each assumption was verified using statistical analyses of his<strong>to</strong>rical data, direct<br />
comparison of results <strong>to</strong> related data is required <strong>to</strong> test overall algorithm performance. NYCT<br />
chose a three-pronged approach for this validation.<br />
Comparison with Route Average Trip Lengths from Ridecheck Surveys<br />
“Average miles travelled” by route (program output) is compared <strong>to</strong> known values computed<br />
from recent SR surveys. Although not directly comparable because survey and AFC dates are<br />
different, if route and population patterns haven’t changed, trip lengths should be a route<br />
characteristic that varies relatively little. Even though ridechecks are not 100% accurate and not<br />
available for all routes, it represents the best NYCT data for average passenger miles.<br />
Comparison cannot be made directly with NTD Section 15 data, because NYCT’s NTD sample<br />
picks one specific route only a few times per year (700 trips sampled from universe of 244<br />
routes), and thus cannot determine average trip lengths by route.<br />
Figure 6(b) shows AFC trip lengths for one single day (vertical axis) versus SR survey values<br />
(horizontal axis) for all NYCT local routes. R-squared of 0.75 and nearly 1:1 slope indicates<br />
good correlation between results obtained from different computation methods and data sources.<br />
Even scattering on both sides suggests neither AFC nor SR contain assumptions that<br />
systematically skew passenger miles estimations for specific route types.<br />
Consistency of Estimated Trip Lengths<br />
Average trip lengths by route for different dates are compared against each other. As a route<br />
characteristic, it should be fairly stable, even if passenger counts vary. Weekday AFC trip<br />
lengths in January 2010 for all routes in Manhattan (Figure 6(c)) and the Bronx (Figure 6(d))<br />
appear fairly stable compared <strong>to</strong> the monthly averages, with coefficient of variation (standard<br />
deviation divided by the mean) generally remaining
Alex Lu, Alla Reddy Page 20 of 26<br />
1<br />
2<br />
3<br />
4<br />
5<br />
6<br />
7<br />
8<br />
9<br />
10<br />
11<br />
12<br />
13<br />
14<br />
15<br />
16<br />
17<br />
18<br />
19<br />
20<br />
21<br />
22<br />
23<br />
24<br />
25<br />
26<br />
27<br />
28<br />
29<br />
30<br />
31<br />
32<br />
33<br />
34<br />
35<br />
36<br />
37<br />
38<br />
39<br />
40<br />
Direct Comparison with <strong>An</strong>nual Section 15 Sample<br />
Traditional Section 15 data estimates annual passenger miles through a 700-trip annual sample,<br />
producing ±10% error at 95% confidence. When one year’s AFC data has been processed and<br />
summarized, it can be compared <strong>to</strong> results from manual sampling procedures. The difference<br />
should be no greater than 10%. AFC passenger miles remain within 10% of traditional survey<br />
estimates (Figure 6(e)).<br />
OBTAINING APPROVAL<br />
To obtain necessary FTA approvals, NYCT summarized statistics from parallel testing <strong>to</strong>gether<br />
with benefits of adopting 100% AFC data for passenger mile derivation:<br />
1. Uses 100% MetroCard data, removing sampling needs.<br />
2. Eliminates paper data collection, manual data entry, and checking; provides<br />
higher accuracy and consistency by eliminating “human” elements.<br />
3. Eliminates a discrepancy consistently observed between revenue AFC ridership<br />
and surveyor counts.<br />
4. Eliminates attendance issues that require survey rescheduling.<br />
5. Data is accessible electronically, making it easier <strong>to</strong> retrieve for audits.<br />
6. Since sampling is not used, monthly fluctuations will no longer occur.<br />
FTA approved NYCT’s conversion <strong>to</strong> AFC data for bus passenger-miles reporting on December<br />
9, 2009. At FTA request, NYCT submitted appropriate additional backup documentation:<br />
• Overall presentation of AFC conversion project<br />
• Data flow diagram<br />
• Selected manual survey raw data for 2007 (Figure 6(a))<br />
• Monthly AFC results and selected daily data for 2007<br />
• Descriptions of AFC adjustment fac<strong>to</strong>rs and passenger-mile algorithm<br />
[Figure 6 shown on next page]<br />
FIGURE 6 (a) Backup submittal <strong>to</strong> the FTA showing an example of manual survey data for<br />
Q58 on June 1, 2007; (b) Results from independent approaches <strong>to</strong> testing the AFC mileage<br />
algorithm: AFC estimated mileage versus Surface Ridecheck estimated mileage correlation test;<br />
(c) Internal consistency test (Manhattan); (d) Internal consistency test (Bronx); (e) Comparison<br />
with traditional Section 15 NTD sample (2007-2009).<br />
11-<strong>0368</strong>_afc_mileage_paper_038.doc (11/16/2010; 788k) NOVEMBER DRAFT – November 16, 2010
Alex Lu, Alla Reddy Page 21 of 26<br />
(a)<br />
(b)<br />
5.00<br />
4.50<br />
AFC Estimated Average Trip Lengths<br />
versus Survey Estimation<br />
4.00<br />
3.50<br />
AFC_MILES<br />
3.00<br />
2.50<br />
2.00<br />
1.50<br />
1.00<br />
0.50<br />
R 2 = 0.748<br />
(c)<br />
0.00<br />
0.00 0.50 1.00 1.50 2.00 2.50 3.00 3.50 4.00 4.50 5.00<br />
SURVEY_MILES<br />
(d)<br />
(e)<br />
PARALLEL TEST<br />
Surveyor's (Sample) versus MetroCard AFC Data (100%)<br />
Passenger Miles & Unlinked Trips -- NTD Bus (MB): 2007 - 2009<br />
2007 2008 2009<br />
Surveyor AFC Data Surveyor AFC Data Surveyor AFC Data<br />
REVENUE RIDERSHIP<br />
738,039,531 746,977,406<br />
726,433,247<br />
% Change (from previous year)<br />
1.21% -2.75%<br />
UNLINKED TRIPS<br />
862,630,526 863,838,154 902,640,956 868,638,444 906,529,603 842,865,961<br />
% Change - MetroCard AFC <strong>to</strong> Surveyor Data 0.14% -3.77% -7.02%<br />
% Change (from previous year) 4.64% 0.56% 0.43% -2.97%<br />
PASSENGER MILES<br />
1,812,108,125 1,887,689,579 1,861,302,947 1,892,676,473 1,865,303,339 1,838,901,551<br />
% Change - MetroCard AFC <strong>to</strong> Surveyor Data 4.17% 1.69% -1.42%<br />
% Change (from previous year) 2.71% 0.27% 0.21% -2.84%<br />
TRIP LENGTH (miles)<br />
2.10 2.19 2.06 2.18 2.06 2.18<br />
% Change - MetroCard AFC <strong>to</strong> Surveyor Data 4.03% 5.67% 6.03%<br />
% Change (from previous year) -1.84% -0.29% -0.21% 0.13%<br />
11-<strong>0368</strong>_afc_mileage_paper_038.doc (11/16/2010; 788k) NOVEMBER DRAFT – November 16, 2010
Alex Lu, Alla Reddy Page 22 of 26<br />
CONCLUSIONS<br />
As previous literature indicates, developing au<strong>to</strong>mated analyses of AFC data streams can be a<br />
minefield full of pitfalls resulting from defective data, incorrect assumptions, poor design, and<br />
implementation issues. By applying lessons learned in NYCT’s subway AFC passenger miles<br />
reporting system development (5), this project avoided some common processing-time and<br />
regula<strong>to</strong>ry pitfalls.<br />
Although required engineering assumptions in this fault <strong>to</strong>lerant algorithm may seem egregious<br />
at the outset, NYCT staff diligently tested and proved each hypothesis by conducting elaborate<br />
surveys, analyzing and re-utilizing readily available service planning route profile data, and<br />
running extensive parallel tests. At each stage in development, computationally efficient<br />
methods were utilized. Processes requiring extensive coding effort, processor time, hard-<strong>to</strong>obtain<br />
data, or manual intervention were rejected. Fault <strong>to</strong>lerant alternatives and assumptions<br />
providing higher degrees of au<strong>to</strong>mation without introducing unacceptable estimation errors were<br />
sought. Maximum use were made of available data sources <strong>to</strong> au<strong>to</strong>matically and periodically<br />
update lookup tables and correction fac<strong>to</strong>rs. This effort paid off as regula<strong>to</strong>ry approvals were<br />
vastly streamlined compared with subway passenger-miles, because appropriate test results and<br />
documentation were readily available.<br />
As more properties embrace OD farebox data collection or AVL/APC systems, analytical<br />
algorithm needs for non-geographic data will decline. No<strong>net</strong>heless, even best geocoded<br />
smartcard or AVL/APC data streams can have data quality issues and continues <strong>to</strong> require<br />
interpretative assumptions, failure detection algorithms, and data correction fac<strong>to</strong>rs for human<br />
elements like fare evasion or blocked sensors. We hope methods and ideas demonstrated in this<br />
algorithm, although specifically developed for NYCT, can be helpful and applicable as other<br />
data analysts delve in<strong>to</strong> newer data streams.<br />
ACKNOWLEDGEMENTS<br />
The authors gratefully acknowledge support and assistance of the following during algorithm<br />
development: Gary Delorme, Federal Transit Administration; Sergio Maia, National Transit<br />
Database; Jane Bailey, Savantage. Authors thank NYCT colleagues Svetlana Rudenko, Michael<br />
Kelly, San<strong>to</strong>sh Kumar, Minh Tran, Louis Balfan, Tewfik Berri, Steve Aievoli, Ted Wang,<br />
<strong>An</strong>thony Cramer, H. Robert Menhard (SDR), Miguel Garcia, Daniel Rodriguez (AFC), Qifeng<br />
Zeng, Stella Levin, Jennifer Cohen, William Amarosa, and Lawrence R. Hirsch (OMB).<br />
Responsibility for errors or omissions remains with the authors. Opinions expressed are the<br />
authors’ and do not necessarily reflect official policies of Metropolitan Transportation Authority<br />
or New York City Transit.<br />
11-<strong>0368</strong>_afc_mileage_paper_038.doc (11/16/2010; 788k) NOVEMBER DRAFT – November 16, 2010
Alex Lu, Alla Reddy Page 23 of 26<br />
REFERENCES<br />
(1) Federal Transit Administration. 2007 <strong>An</strong>nual NTD Reporting Manual and Circular 2710.4A:<br />
Sampling Techniques for Obtaining Fixed Route Bus (MB) Operating Data Required Under the<br />
Section 15 Reporting System. Accessed via the National Transit Database website<br />
http://www.ntdprogram.gov/ on May 2, 2008.<br />
(2) Zhao, J., A. Rahbee, and N.H.M. Wilson. Estimating a Rail Passenger Trip Origin-<br />
Destination Matrix Using Au<strong>to</strong>matic Data Collection Systems. In Computer-Aided Civil and<br />
Infrastructure Engineering, No. 22, pp. 376-387, 2007.<br />
(3) Rahbee, Adam B. Farecard Passenger Flow Model at Chicago Transit Authority, Illinois. In<br />
Transportation Research Record 2072, <strong>TRB</strong>, National Research Council, Washing<strong>to</strong>n, D.C.,<br />
2008.<br />
(4) Barry, James J., R. Newhouser, A. Rahbee, and S. Sayeda. Origin and Destination Estimation<br />
in New York City Using Au<strong>to</strong>mated Fare System Data. In Transportation Research Record:<br />
Journal of the Transportation Research Board, Transportation Research Board of the National<br />
Academies, 2002.<br />
(5) Reddy, Alla, A. Lu, S. Kumar, V. Bashmakov, and S. Rudenko. Application of Entry-Only<br />
Au<strong>to</strong>mated Fare Collection (AFC) System Data <strong>to</strong> Infer Ridership, Rider Destinations, Unlinked<br />
Trips, and Passenger Miles. <strong>TRB</strong> <strong>Paper</strong> # 09-0809. In Transportation Research Record 2110,<br />
Transportation Research Board of the National Academies, 2009.<br />
(6) Guptill, Robert. Data from MBTA’s Au<strong>to</strong>mated Fare Collection (AFC). Presented at <strong>TRB</strong><br />
National Transportation Planning Applications Conference, May 2009. Retrieved from<br />
http://www.trb-appcon.org/<strong>TRB</strong>2009presentations/s19/07_impact.ppt on June 27, 2010.<br />
(7) Liao, Chen-Fu, and H. Liu. Mining Bus Location, Passenger Count and Fare Collection<br />
Database for Intelligent Transit Applications. Presented at the 21st <strong>An</strong>nual Transportation<br />
Research Conference, April 27-28, 2010, St. Paul, Minn. Retrieved from<br />
http://www.cts.umn.edu/Events/ResearchConf/2010/presentations/24-liao.pdf on June 27, 2010.<br />
(8) Zureiqat, Hazem, N.H.M. Wilson, and J. Attanucci. Fare Policy <strong>An</strong>alysis for Public<br />
Transport: A Discrete-Continuous Modeling Approach Using Panel Data, <strong>TRB</strong> <strong>Paper</strong> #09-1591.<br />
In Proceedings of the 88 th <strong>An</strong>nual Meeting of the Transportation Research Board. CD-ROM.<br />
Transportation Research Board of the National Academies, 2009.<br />
(9) Frumin, Michael. Au<strong>to</strong>matic Data for Applied Railway Management: Passenger Demand,<br />
Service Quality Measurement, and Tactical Planning on the London Overground Network.<br />
Thesis, Massachusetts Institute of Technology, Cambridge, Mass., 2010.<br />
(10) Gordillo, Fabio. The Value of Au<strong>to</strong>mated Fare Collection Data for Transit Planning: <strong>An</strong><br />
Example of Rail Transit OD Matrix Estimation. Technology and Policy Program Thesis,<br />
11-<strong>0368</strong>_afc_mileage_paper_038.doc (11/16/2010; 788k) NOVEMBER DRAFT – November 16, 2010
Alex Lu, Alla Reddy Page 24 of 26<br />
Massachusetts Institute of Technology, Cambridge, Mass., 2006. Retrieved from<br />
http://dspace.mit.edu/handle/1721.1/38570 on June 27, 2010.<br />
(11) Ro, Wei-Yuan ( 羅 惟 元 ). Using Taipei Easycard Transaction Data <strong>to</strong> Explore the O-D<br />
Table of Bus Passengers. Masters Thesis, Graduate Institute of Transportation Management,<br />
Tamkang University, Damshui, Taiwan, June 2008. Retrieved from<br />
http://tkuir.lib.tku.edu.tw:8080/dspace/handle/987654321/33825 on June 27, 2010.<br />
(12) Wong, S.C., and C.O. Tong. Estimation of Time-Dependent Origin-Destination Matrices<br />
for Transit Networks. In Transportation Research Part B: Methodological, Volume 32, Issue 1,<br />
Pages 35-48, January, 1998.<br />
(14) Liu, Jianfeng, J.H. Li, F. Chen, Y.Q. Zhou. Review on Station-<strong>to</strong>-Station OD Matrix<br />
Estimation Model and <strong>Algorithm</strong> for Urban Rail Transit. Presented at Second International<br />
Conference on Computer Modeling and Simulation, Vol. 3, pp.149-153, Sanya, China, January,<br />
2010.<br />
(15) Pelleter, Marie-Pierre, M. Treeplanner, and C. Moroncy. Smart Card Data in Public<br />
Transit Planning: A Review. Report CIRRELT-2009-46. Retrieved from<br />
https://www.cirrelt.ca/DocumentsTravail/CIRRELT-2009-46.pdf on June 27, 2010.<br />
(16) Zúñiga, Felipe G., J.C.A. Muñoz, R.E. Giesen. Real-Time Prediction and Update of<br />
Dynamic Origin-Destination Matrices on a Transit Corridor. Presented at TransLog<br />
Transportation and Logistics Workshop, Hamil<strong>to</strong>n, Ont., Canada, 2009.<br />
(17) Farzin, Janine M. Constructing an Au<strong>to</strong>mated Bus Origin-Destination Matrix Using<br />
Farecard and Global Positioning System Data in São Paulo, Brazil. In Transportation Research<br />
Record 2072, Transportation Research Board of the National Academies, 2008.<br />
(18) Mulqueeny, James Jr., S.J. LaBelle, R.T. Patronsky, and J. Simo<strong>net</strong>ti. What <strong>to</strong> Do With<br />
Your New Electronic Farebox Data. Presented at 73 rd <strong>An</strong>nual Meeting of the Transportation<br />
Research Board. Transportation Research Board of the National Academies, 1994.<br />
(19) Furth, Peter G. Integration of Fareboxes with Other Electronic Devices on Transit Vehicles.<br />
In Transportation Research Record 1557, p. 21-17, Transportation Research Board of the<br />
National Academies, 1996.<br />
(20) Cui, Alex. Bus Passenger Origin-Destination Matrix Estimation Using Au<strong>to</strong>mated Data<br />
Collection Systems. Thesis, Massachusetts Institute of Technology, Cambridge, Mass., 2006.<br />
(21) Taiwan Smart Card Corporation. What is Taiwan Tong? ( 什 麼 是 「 台 灣 通 」?)<br />
Retrieved from http://www.twnsc.com.tw/node/5 on July 2, 2010.<br />
(22) Gilligan, James M. New Jersey Transit BRT Initiatives: Go Bus28 and Reuse of a Right-of-<br />
Way in Union County. Presented at APTA Multimodal Operations Planning Conference, New<br />
York City, N.Y., July 26-28, 2010.<br />
11-<strong>0368</strong>_afc_mileage_paper_038.doc (11/16/2010; 788k) NOVEMBER DRAFT – November 16, 2010
Alex Lu, Alla Reddy Page 25 of 26<br />
(23) Furth, Peter G. Innovative Sampling Plans for Estimating Transit Passenger Kilometers. In<br />
Transportation Research Record 1618, <strong>TRB</strong>, National Research Council, Washing<strong>to</strong>n, D.C.,<br />
1998, pp. 87–95.<br />
(24) Navick, David S. and P.G. Furth. Estimating Passenger Miles, Origin-Destination Patterns,<br />
and Loads with Location-Stamped Farebox Data. In Transportation Research Record 1799,<br />
<strong>Paper</strong> No. 02-2466, <strong>TRB</strong>, National Research Council, Washing<strong>to</strong>n, D.C., 2002, pp. 107–113.<br />
(25) Fare Demonstration Project. In Headlights, Magazine of Electric Railroaders’ Association,<br />
Inc., New York, N.Y., August, 1964.<br />
(26) Illinois Central Railroad. Illinois Central’s Gamble at Chicago: Private Breakthrough for a<br />
Public Cause. Chicago, Ill., circa 1968.<br />
(27) Buneman, Kevin. Au<strong>to</strong>mated and Passenger-Based Transit Performance Measures. In<br />
Transportation Research Record 992, pp. 23-28, Transportation Research Board of the National<br />
Academies, 1984.<br />
(28) Miller, Luther S. AFC: A Fare Deal for All – Mass Transit Au<strong>to</strong>matic Fare Collection<br />
Systems. In Railway Age, Issue 5, Volume 195, May, 1994.<br />
(29) Vigrass, J. William. The Lindenwold (New Jersey <strong>to</strong> Philadelphia) Hi-Speed Line: The<br />
First Twenty Years of the Port Authority Transit Corporation (PATCO). West Jersey Chapter,<br />
National Railway His<strong>to</strong>rical Society, Cherry Hill, N.J., 1990.<br />
(30) Ford, Roger. Technology Update: Ticket Issuing and Revenue Control. In Modern<br />
Railways, Volume 41, Pages 256-257, May, 1984.<br />
(31) Young, David. The Business of Fare Collection. In Mass Transit Magazine, September,<br />
1977.<br />
(32) Urban Mass Transportation Administration. Sampling Procedures for Obtaining Fixed<br />
Route Bus Operating Data Required Under the Section 15 Reporting System, UMTA Circular<br />
2710.1, Washing<strong>to</strong>n, D.C., February 22, 1978.<br />
(33) Donohue, Pete. You Won’t Find a Free Ride Here... MTA Inspec<strong>to</strong>rs Keep Bronx’s BX12<br />
Fare-Beaters in Check. In New York Daily News, June 17, 2010. Retrieved from<br />
http://www.nydailynews.com/ny_local/bronx/2010/06/17/2010-06-<br />
17_dont_do_the_crime__or_you_may_pay_farebeat_fine_on_bx12.html on July 10, 2010.<br />
(34) MTA New York City Transit. 2010 NYC Transit Service Reductions. New York, N.Y.,<br />
January 27, 2010. Retrieved from http://mta.info/mta/news/books/pdf/<br />
100125_1031_service2010-nyct.pdf on November 9, 2010.<br />
11-<strong>0368</strong>_afc_mileage_paper_038.doc (11/16/2010; 788k) NOVEMBER DRAFT – November 16, 2010
Alex Lu, Alla Reddy Page 26 of 26<br />
(35) Reddy, Alla, J. Kuhls, and A. Lu. Measuring and Controlling Subway Fare Evasion:<br />
Improving Safety and Security at New York City Transit Authority. <strong>TRB</strong> <strong>Paper</strong> <strong>#11</strong>-2016,<br />
Submitted for Presentation at the Transportation Research Board 90th <strong>An</strong>nual Meeting,<br />
Washing<strong>to</strong>n, D.C., January 23-27, 2011.<br />
(36) New York State Legislature. New York State Penal Law, §120.05 Assault in the Second<br />
Degree, Subdivision 11. Retrieved from<br />
http://public.leginfo.state.ny.us/LAWSSEAF.cgi?QUERYTYPE=LAWS+&QUERYDATA=$$PEN<br />
120.05$$@TXPEN0120.05 on July 10, 2010.<br />
(37) Donohue, Pete. Brooklyn Man Indicted for Pummeling Bus Driver, Could Get Up <strong>to</strong> Seven<br />
Years. In New York Daily News, July 3, 2010. Retrieved from<br />
http://www.nydailynews.com/news/ny_crime/2010/07/03/2010-07-<br />
03_goon_slapped_with_rap_in_busdriver_attack.html on July 10, 2010.<br />
(38) McFadden, Robert D. Police Say Killer Paid No Fare and Attacked After Being Denied a<br />
Transfer. In New York Times, New York Section, Page A27, December 2, 2008.<br />
11-<strong>0368</strong>_afc_mileage_paper_038.doc (11/16/2010; 788k) NOVEMBER DRAFT – November 16, 2010