Bangladesh country report - ASTI - cgiar
Bangladesh country report - ASTI - cgiar
Bangladesh country report - ASTI - cgiar

You also want an ePaper? Increase the reach of your titles
YUMPU automatically turns print PDFs into web optimized ePapers that Google loves.
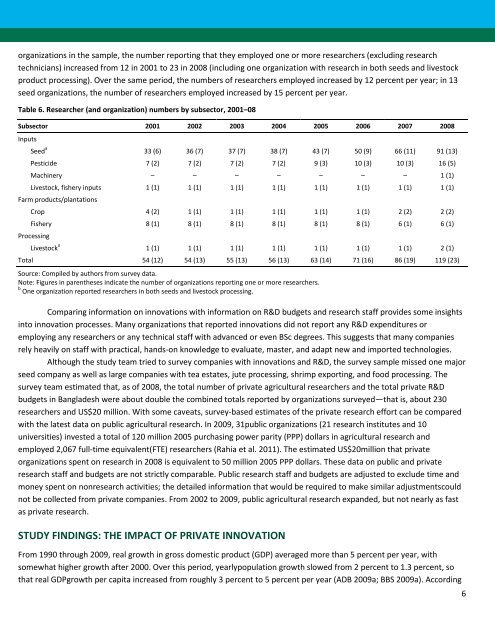
organizations in the sample, the number <strong>report</strong>ing that they employed one or more researchers (excluding research<br />
technicians) increased from 12 in 2001 to 23 in 2008 (including one organization with research in both seeds and livestock<br />
product processing). Over the same period, the numbers of researchers employed increased by 12 percent per year; in 13<br />
seed organizations, the number of researchers employed increased by 15 percent per year.<br />
Table 6. Researcher (and organization) numbers by subsector, 2001–08<br />
Subsector 2001 2002 2003 2004 2005 2006 2007 2008<br />
Inputs<br />
Seed a 33 (6) 36 (7) 37 (7) 38 (7) 43 (7) 50 (9) 66 (11) 91 (13)<br />
Pesticide 7 (2) 7 (2) 7 (2) 7 (2) 9 (3) 10 (3) 10 (3) 16 (5)<br />
Machinery – – – – – – – 1 (1)<br />
Livestock, fishery inputs 1 (1) 1 (1) 1 (1) 1 (1) 1 (1) 1 (1) 1 (1) 1 (1)<br />
Farm products/plantations<br />
Crop 4 (2) 1 (1) 1 (1) 1 (1) 1 (1) 1 (1) 2 (2) 2 (2)<br />
Fishery 8 (1) 8 (1) 8 (1) 8 (1) 8 (1) 8 (1) 6 (1) 6 (1)<br />
Processing<br />
Livestock a 1 (1) 1 (1) 1 (1) 1 (1) 1 (1) 1 (1) 1 (1) 2 (1)<br />
Total 54 (12) 54 (13) 55 (13) 56 (13) 63 (14) 71 (16) 86 (19) 119 (23)<br />
Source: Compiled by authors from survey data.<br />
Note: Figures in parentheses indicate the number of organizations <strong>report</strong>ing one or more researchers.<br />
b One organization <strong>report</strong>ed researchers in both seeds and livestock processing.<br />
Comparing information on innovations with information on R&D budgets and research staff provides some insights<br />
into innovation processes. Many organizations that <strong>report</strong>ed innovations did not <strong>report</strong> any R&D expenditures or<br />
employing any researchers or any technical staff with advanced or even BSc degrees. This suggests that many companies<br />
rely heavily on staff with practical, hands-on knowledge to evaluate, master, and adapt new and imported technologies.<br />
Although the study team tried to survey companies with innovations and R&D, the survey sample missed one major<br />
seed company as well as large companies with tea estates, jute processing, shrimp exporting, and food processing. The<br />
survey team estimated that, as of 2008, the total number of private agricultural researchers and the total private R&D<br />
budgets in <strong>Bangladesh</strong> were about double the combined totals <strong>report</strong>ed by organizations surveyed—that is, about 230<br />
researchers and US$20 million. With some caveats, survey-based estimates of the private research effort can be compared<br />
with the latest data on public agricultural research. In 2009, 31public organizations (21 research institutes and 10<br />
universities) invested a total of 120 million 2005 purchasing power parity (PPP) dollars in agricultural research and<br />
employed 2,067 full-time equivalent(FTE) researchers (Rahia et al. 2011). The estimated US$20million that private<br />
organizations spent on research in 2008 is equivalent to 50 million 2005 PPP dollars. These data on public and private<br />
research staff and budgets are not strictly comparable. Public research staff and budgets are adjusted to exclude time and<br />
money spent on nonresearch activities; the detailed information that would be required to make similar adjustmentscould<br />
not be collected from private companies. From 2002 to 2009, public agricultural research expanded, but not nearly as fast<br />
as private research.<br />
STUDY FINDINGS: THE IMPACT OF PRIVATE INNOVATION<br />
From 1990 through 2009, real growth in gross domestic product (GDP) averaged more than 5 percent per year, with<br />
somewhat higher growth after 2000. Over this period, yearlypopulation growth slowed from 2 percent to 1.3 percent, so<br />
that real GDPgrowth per capita increased from roughly 3 percent to 5 percent per year (ADB 2009a; BBS 2009a). According<br />
6