Working with ALS Mice (.pdf) - JAX Mice and Services - The Jackson ...
Working with ALS Mice (.pdf) - JAX Mice and Services - The Jackson ...
Working with ALS Mice (.pdf) - JAX Mice and Services - The Jackson ...

You also want an ePaper? Increase the reach of your titles
YUMPU automatically turns print PDFs into web optimized ePapers that Google loves.
<strong>Working</strong> <strong>with</strong> <strong>ALS</strong> <strong>Mice</strong><br />
Guidelines for preclinical testing & colony management<br />
Prepared by 1 Melanie Leitner Ph.D., 1 Sheila Menzies Ph.D., <strong>and</strong> 2 Cathleen Lutz Ph.D.<br />
1<br />
Prize4Life, Cambridge, MA <strong>and</strong> 2 <strong>The</strong> <strong>Jackson</strong> Laboratory, Bar Harbor, ME
<strong>Working</strong> <strong>with</strong> <strong>ALS</strong> <strong>Mice</strong><br />
Guidelines for preclinical testing & colony management<br />
Introduction......................................................................................................................................................1<br />
Part I. Considerations for Preclinical Studies Using SOD1 <strong>Mice</strong>................................................................. 3<br />
Consideration 1: Gender................................................................................................................................. 3<br />
Consideration 2: Litter.................................................................................................................................... 3<br />
Consideration 3: Transgene Copy Number.................................................................................................... 4<br />
Consideration 4: Exclusion Criteria............................................................................................................... 4<br />
Consideration 5: Onset/Timing of Treatment................................................................................................ 5<br />
Consideration 6: Endpoint............................................................................................................................... 5<br />
Consideration 7: Proving Access of Treatment to Target Tissue.................................................................. 6<br />
Consideration 8: Dose response.................................................................................................................... 6<br />
Consideration 9: Pharmacokinetics............................................................................................................... 7<br />
Consideration 10: Statistics............................................................................................................................ 7<br />
Consideration 11: Environmental Factors...................................................................................................... 7<br />
Consideration 12: Multi-drug Treatment......................................................................................................8<br />
Part II. Colony Management Considerations................................................................................................ 9<br />
Consideration 1: Strain Background.............................................................................................................. 9<br />
Inbred/Straight Lines................................................................................................................................. 9<br />
Congenic Lines............................................................................................................................................ 9<br />
Hybrid Lines................................................................................................................................................ 9<br />
Mixed Genetic (Hybrid) Backround: Advantages <strong>and</strong> Disadvantages.....................................................10<br />
Inbred Lines: Advantages <strong>and</strong> Disadvantages.........................................................................................11<br />
Consideration 2: Genetic Backgrounds & Breeding Strategies<br />
of Existing G93A-SOD1 Mutant Lines............................................................................................................11<br />
<strong>The</strong> Hybrid B6SJL Line..............................................................................................................................11<br />
<strong>The</strong> Congenic C57BL/6J Line....................................................................................................................12<br />
<strong>The</strong> G93A-SOD1 Mutant Transgene on Other Strain Backgrounds........................................................12<br />
Consideration 3: Quality Assurance Measures for SOD1-G93A Colonies..................................................12<br />
Copy Number <strong>and</strong> Pedigree Analysis.......................................................................................................12<br />
Genetic Quality Control.............................................................................................................................13<br />
Conclusions.................................................................................................................................................14<br />
Appendices......................................................................................................................................................15<br />
Appendix A. QPCR Protocol for Determining Copy Number.....................................................................15<br />
Appendix B. Sample Neurological Scoring System...................................................................................17<br />
Appendix C. Template Pedigree Ledger.....................................................................................................18<br />
Appendix D. List of Reviewers.....................................................................................................................19<br />
References..................................................................................................................................................... 20
Introduction<br />
Amyotrophic Lateral Sclerosis (<strong>ALS</strong>) is a devastating <strong>and</strong> rapidly fatal disease <strong>with</strong> currently only one<br />
available, FDA-approved, modestly effective treatment. <strong>The</strong>re is therefore an urgent need for new therapies.<br />
With the development of the first genetically based mouse model of <strong>ALS</strong> in 1994, the field of preclinical<br />
testing was energized, but there have been a number of unforeseen complexities along the way.<br />
This document is designed to 1) summarize the current best practices <strong>and</strong> recommendations available for<br />
designing <strong>and</strong> conducting preclinical studies using currently available SOD1-based mouse models of <strong>ALS</strong>, <strong>and</strong><br />
2) summarize the current best practices <strong>and</strong> most current information regarding breeding <strong>and</strong> maintaining<br />
SOD1 mutant mouse colonies.<br />
For the purposes of the materials covered in this document, the recommendations to follow focus specifically<br />
on preclinical studies, meaning those experimental studies whose primary goal is to develop a therapy for<br />
human use. While we believe the following breeding <strong>and</strong> design recommendations may also benefit general<br />
proof-of-concept studies, designed to examine fundamental mechanisms <strong>and</strong> elucidate new biological targets<br />
of <strong>ALS</strong>, this is not the primary purpose of these materials.<br />
Overview of Various SOD1 Animal Models<br />
As first reported in (Rosen et al., 1993) mutations in the Cu/Zn Superoxide Dismutase 1 gene (SOD1) account<br />
for ~20% of Familial <strong>ALS</strong> (F<strong>ALS</strong>) cases, corresponding to 2-3% of all <strong>ALS</strong> cases. Transgenic mutant SOD1<br />
mice are the only <strong>ALS</strong> mouse models currently available that exhibit all of the histopathological hallmarks<br />
observed clinically in sporadic <strong>and</strong> familial <strong>ALS</strong>.<br />
SOD1 is a ubiquitous, mostly cytosolic, 153 amino acid protein that catalyzes the dismutation of superoxide<br />
anion radicals leading to the formation of hydrogen peroxide. <strong>The</strong> enzyme functions as a homodimer, in<br />
which each monomer binds one zinc <strong>and</strong> one copper atom. Copper<br />
binding is thought to be important for catalytic activity while zinc<br />
binding is believed to be critical for structural stability.<br />
Over 146 mutations scattered throughout SOD1 have been<br />
identified in F<strong>ALS</strong> patients, the majority of these being point<br />
mutations of highly conserved amino acids (Clevel<strong>and</strong> <strong>and</strong> Rothstein<br />
2001). A continuously updated list of human mutations can be found<br />
on the <strong>ALS</strong>OD online database, alsod.iop.kcl.ac.uk. Intriguingly, all<br />
mutations, <strong>with</strong> the exception of D90A, seem to be inherited in an<br />
autosomal dominant manner.<br />
Because there is no obvious mutational hotspot <strong>and</strong> no clear correlation between the level<br />
of enzymatic activity of the mutant SOD1 protein <strong>and</strong> the observed disease phenotype or clinical progression<br />
(refer to Table 1), SOD1 is thought to act primarily via a toxic gain of function in <strong>ALS</strong> (Pasinelli <strong>and</strong><br />
Brown 2004, Bruijn et al., 2004), although loss of function may also contribute to disease pathophysiology<br />
(Fischer et al., 2007). It is generally thought that the different mutant SOD1 proteins are likely to cause <strong>ALS</strong><br />
by a similar mechanism. Several hypotheses for SOD1 mutant mediated neuronal loss have been advanced<br />
including excitotoxicity, oxidative damage, impaired energy metabolism, inflammation, <strong>and</strong> insufficient<br />
growth factor signaling.<br />
Several transgenic mouse models have been generated that model mutations found in F<strong>ALS</strong> patients (see<br />
Table 1 below for comparisons of key characteristics), including the G93A (Gurney et al., 1994), G37R<br />
(Wong et al., 1995), G85R (Bruijn et al., 1997), G127X (Jonsson et al., 2004), D90A (Jonsson et al., 2006b),<br />
<strong>and</strong> H46R mutations (Sasaki et al., 2007). In all of these mouse models, massive death of motor neurons<br />
<strong>Working</strong> <strong>with</strong> <strong>ALS</strong> <strong>Mice</strong> 1
in the ventral horn of the spinal cord <strong>and</strong> loss of myelinated axons in ventral motor roots ultimately leads to<br />
paralysis <strong>and</strong> muscle atrophy. A limited number of other neuronal populations have also been shown to be<br />
affected in various SOD1 mutant mouse models, including upper corticospinal motor neurons in G93A mice<br />
(unpublished data presented by P. H. Ozdinler in Istanbul, Turkey, July 2009), sensory neurons in dorsal root<br />
ganglia in G85R (Bruijn et al., 1997), <strong>and</strong> neurons of brainstem cranial nuclei in G37R mice (Wong et al., 1995).<br />
All of these mouse models have been reported to exhibit the same histopathological hallmarks associated<br />
<strong>with</strong> <strong>ALS</strong> in humans: progressive accumulation of detergent–resistant aggregates containing SOD1 <strong>and</strong><br />
ubiquitin <strong>and</strong> aberrant neurofilament accumulations in degenerating motor neurons. In addition to neuronal<br />
degeneration, reactive astroglia <strong>and</strong> microglia have also been detected in diseased tissue in the mice, similar to<br />
that observed in humans.<br />
Despite these histopathological similarities, the timing of onset <strong>and</strong> rate of disease progression differ (often<br />
dramatically) among the various SOD1 transgenic mouse models. To date, researchers have not be able to<br />
account for these differences in onset or progression by looking at particular characteristics of the mutant<br />
protein, as disease onset <strong>and</strong> progression do not appear to correlate <strong>with</strong> the presence or absence of enzyme<br />
activity, or <strong>with</strong> the stability of the various mutant SOD1 proteins (refer to Table 1 below for summary<br />
comparison). However disease progression, but not disease onset, may correlate <strong>with</strong> aggregation propensity<br />
(Wang et al., 2008).<br />
Table 1: Characteristics of Commonly Used <strong>ALS</strong> SOD1 Mutant Mouse Models<br />
Characteristic G93A G85R G37R D90A G127X H46R<br />
Line Gur1;<br />
(high Tg copy #);<br />
B6SJL Hybrid<br />
Line 148<br />
Multiple lines<br />
were analyzed<br />
Line 134 Line 716 Line 70<br />
Inheritance Dominant Dominant Dominant Recessive Dominant Dominant<br />
Protein<br />
Aggregation<br />
Propensity<br />
High 7 High 7 Moderate 7 High 7 High 4 Low 10<br />
Enzyme Activity Active 3 Inactive 1,5 Active 1 Inactive Inactive 5 Inactive 8<br />
Protein Stability Stable 5 Reduced 5 Reduced 1 Stable 5,6 Unstable 5 Stable 8<br />
Disease Onset<br />
Early<br />
Late<br />
Moderate<br />
(3- 4 mo) 3 (7.5 mo) 2 (4-6m o) 11<br />
Late<br />
(12mo) 6<br />
Late Moderate (5<br />
(8-9 mo) 4 mo) 9<br />
Disease<br />
Progression<br />
Moderate<br />
Fast<br />
Slow<br />
Slow<br />
Fast<br />
Slow<br />
(3 wks) 3 (2 wks) 2 (4-6 wks) 12 (4 wks) 6 (7-10 dys) 4 (4 weeks) 9<br />
Original<br />
Publication<br />
Gurney et al.<br />
Science 1994<br />
Bruijn et al.<br />
Neuron 1997<br />
Wong et al.<br />
Neuron 1995<br />
Jonsson et al.<br />
J Neuropathol<br />
Exp Neurol<br />
2006b<br />
Jonsson et al.<br />
Brain 2004<br />
Sasaki et al.<br />
J Neuropathol<br />
Exp Neurol<br />
2007<br />
References<br />
(1) Borchelt et al., 1994 (2) Bruijn et al., 1997 (3) Gurney et al., 1994 (4) Jonsson et al., 2004 (5) Jonsson et al., 2006c (6)<br />
Jonsson et al., 2006b (7) Prudencio et al., 2009 (8) Ratovitski et al., 1999 (9) Sasaki et al., 2007 (10) Strom et al., 2008 (11)<br />
Wong et al., 1995 (12) <strong>JAX</strong>, personal communication, 2009<br />
2<br />
<strong>Working</strong> <strong>with</strong> <strong>ALS</strong> <strong>Mice</strong>
Part I. Considerations for Preclinical Studies<br />
Using SOD1 <strong>Mice</strong><br />
Several recent workshops, webinars, <strong>and</strong> publications have focused on issues relating to the most rigorous <strong>and</strong><br />
interpretable design of SOD1 mutant mouse-based preclinical studies. In preparing the following materials,<br />
we have in particular drawn from the recommendations of the <strong>ALS</strong> <strong>The</strong>rapy Development Institute, the first<br />
report of the ENMC Group for the Establishment of Guidelines for the Conduct of Preclinical <strong>and</strong> Proof of<br />
Concept Studies in <strong>ALS</strong>/MND Models, <strong>and</strong> the recent Second Workshop on Guidelines for the Preclinical<br />
Evaluation of Potential <strong>The</strong>rapeutics in <strong>ALS</strong>/MND, held in Reisensburg, Germany. In addition, these materials<br />
have been reviewed <strong>and</strong> valuable feedback provided by an esteemed list of expert stakeholders, enumerated in<br />
Appendix D.<br />
As you review the following materials, you will notice that in general the recommendations presented <strong>and</strong> the<br />
data summarized are based on the use of the G93A‐SOD1 B6SJL hybrid background mutant mouse model.<br />
<strong>The</strong> reason for this is quite simply because this was the first genetically based <strong>ALS</strong> animal model developed,<br />
<strong>and</strong> so it has become the most widely used <strong>and</strong> well-characterized mouse model of<br />
<strong>ALS</strong>, not because of any inherent scientific superiority or patient applicability<br />
of this model vs. any of the other mutant SOD1 models. We believe that<br />
many of the recommendations to follow have general applicability<br />
for preclinical studies using other <strong>ALS</strong> mouse models, but certainly<br />
the specifics of timing of disease onset, lifespan/disease duration,<br />
cohort numbers required for suitable confidence/statistical power,<br />
<strong>and</strong> so forth will be model <strong>and</strong> strain/background dependent.<br />
Throughout the document we have tried to highlight where the<br />
recommendations have general applicability across the various<br />
models <strong>and</strong> where they are specific to the G93A hybrid model.<br />
Consideration 1: Gender<br />
Recommendation: It is necessary to use equal numbers of males <strong>and</strong> females in all cohorts that will be compared<br />
for preclinical studies.<br />
<strong>The</strong> SOD1 mutant model currently <strong>with</strong> the most detailed gender-based data is the G93A SOD1 mutant on a<br />
mixed B6SJL hybrid background. This model shows clear gender differences in survival, <strong>with</strong> female animals<br />
living on average 4-7 days longer than males, depending on the specific colony (Heiman‐Patterson et al.,<br />
2005, Scott et al., 2007, <strong>JAX</strong> internal communications, 2009) so it is critical to always use a gender balanced<br />
study design <strong>with</strong> these animals In practice, this entails ensuring equal numbers of males <strong>and</strong> females<br />
in all cohorts that will be compared for preclinical studies. Congenic C57BL/6J animals carrying a G93A<br />
SOD1 mutation also show gender differences in survival (Heiman‐Patterson et al., 2005, Cat Lutz, personal<br />
observations, 2009).<br />
Consideration 2: Litter<br />
Recommendation: When using animal models on non-congenic backgrounds, it is necessary to balance<br />
littermates across experimental cohorts<br />
As has been demonstrated conclusively for the widely used G93A mutant SOD1 model on a mixed B6SJL<br />
hybrid background (Scott et al., 2008), it is critical when using hybrid animal models to use matched<br />
littermates across experimental cohorts. In their 2008 publication, <strong>ALS</strong>TDI showed that across their cohort<br />
of over 5000 animals, siblings from the same litter were more likely to have similar ages of onset <strong>and</strong> death<br />
than non-siblings (Scott et al., 2008). Litter is therefore an important factor related to observed disease<br />
<strong>Working</strong> <strong>with</strong> <strong>ALS</strong> <strong>Mice</strong> 3
onset <strong>and</strong> survival in <strong>ALS</strong> mouse studies using non-congenic/hybrid animals. Litter is far less of a potentially<br />
confounding factor when using <strong>ALS</strong> models on “pure” congenic backgrounds, such as animals backcrossed<br />
for 10 generations onto a C57BL/6J background, as currently exist for G93A, G37R, G85R, D90A, <strong>and</strong><br />
G127X (Zetterstrom et al., 2007). Please see Part II of this manual, which discusses colony management<br />
recommendations, for more information on the potential impact of strain background <strong>and</strong> genetic drift.<br />
Consideration 3: Transgene Copy Number<br />
Recommendation: It is imperative to quantitatively assess transgene copy number for all animals used in<br />
preclinical studies<br />
Over time it has become apparent that the mutant G93A transgene undergoes a background level of copy loss,<br />
due to meiotic rearrangement of the transgene array. Decrease in transgene copy number has been clearly<br />
correlated <strong>with</strong> extension of lifespan not only in the G93A animals (Alex<strong>and</strong>er et al., 2004) but in other<br />
highly overexpressing transgenic mouse models as well, such as several of the Huntington’s Disease transgenic<br />
mouse models. Given this background level of copy number loss, it is critical that users of G93A <strong>and</strong> other<br />
highly over-expressing <strong>ALS</strong> mouse models obtain quantitative data regarding transgene copy number either<br />
via quantitative PCR or quantitative Southern blotting.<br />
<strong>The</strong> animals provided through the Prize4Life mouse colony have all been checked for copy number loss<br />
via qPCR but this may not be the case for animals obtained through other sources. <strong>The</strong>refore, researchers<br />
interested in conducting preclinical studies are cautioned as to the<br />
need to obtain this information for each <strong>and</strong> every transgenic<br />
animal used (in both control <strong>and</strong> treatment cohorts),<br />
as historically, numerous studies have been<br />
confounded by undetected copy number drop,<br />
wasting precious time, money, <strong>and</strong> leading to<br />
erroneous findings.<br />
Consideration 4: Exclusion Criteria<br />
Recommendation: Any animal which fails to undergo the predicted disease progression should be systematically<br />
excluded from treatment analysis <strong>and</strong> the reason for exclusion should be recorded <strong>and</strong> reported<br />
In the course of conducting <strong>ALS</strong> preclinical studies, it is occasionally the case that an animal will die of a<br />
cause unrelated to the progress of the disease. Death by infection, death resulting from damage incurred in<br />
the process of delivering the therapeutic intervention of interest, or other non-disease-related deaths should<br />
be tracked <strong>and</strong> these animals excluded accordingly. If an animal dies before showing typical <strong>and</strong> predicted<br />
disease progression, for example as assessed by increasing neurological score, this animal should be excluded<br />
from the treatment analysis <strong>and</strong> the reason for exclusion should be reported. It is also important to exclude<br />
the animal’s gender matched littermate from the comparison cohort so as to maintain litter-matched balance<br />
in preclinical studies using animals on mixed backgrounds.<br />
It is critical to be systematic about tracking <strong>and</strong> accounting for these early deaths, as they can confound<br />
interpretation of the true effect of a therapeutic intervention. An analysis by <strong>ALS</strong>TDI (Scott et al., 2008)<br />
indicated that failing to account for non-<strong>ALS</strong> related deaths <strong>with</strong>in preclinical studies is likely historically to<br />
be the largest potential source of noise <strong>and</strong> spurious results. This recommendation applies to all preclinical<br />
studies, regardless of which line or mutation model is being used.<br />
4<br />
<strong>Working</strong> <strong>with</strong> <strong>ALS</strong> <strong>Mice</strong>
Consideration 5: Onset/Timing of Treatment<br />
Recommendation: <strong>The</strong> combination of peak body weight followed by decreasing neurological score is a<br />
reasonable measure to determine disease onset in <strong>ALS</strong> SOD1 mouse models<br />
This is a challenging issue <strong>and</strong> one on which there is little consensus in the<br />
<strong>ALS</strong> preclinical research field. <strong>The</strong>re are strong arguments to be made for<br />
requiring therapeutic delivery at disease onset. As <strong>ALS</strong> is only diagnosed in<br />
patients post-onset, there is a very real concern that potential therapies<br />
that have been shown to be efficacious in animals prior to onset will<br />
fail to show any benefit in humans. However others have argued that<br />
given the highly aggressive nature of the existing <strong>ALS</strong> mouse models,<br />
particularly the G93A <strong>and</strong> other high copy number expressing mutation<br />
models, waiting until disease onset to test potential therapies may<br />
lead researchers to miss/throw‐out potentially promising therapies. In<br />
practice, many labs have opted for a pre‐onset delivery when conducting<br />
their preclinical studies.<br />
According to the ENMC Review (Ludolph et al., 2007) the vast majority of previously conducted preclinical<br />
studies using the G93A animal have tested compounds between day 40 <strong>and</strong> day 70. <strong>The</strong> recommendation<br />
of the ENMC is to conduct proof of concept studies (exploring basic questions of therapeutic efficacy)<br />
between day 50 <strong>and</strong> day 70 (in the G93A B6SJL animal model) <strong>and</strong>, if a drug has a robust effect during this<br />
pre-symptomatic window, to then re-test the compound in later symptomatic phases (at or post onset).<br />
As to when exactly disease onset occurs in <strong>ALS</strong> mouse models, the greatest consensus seems to currently exist<br />
that peak body weight is a reasonable <strong>and</strong> consistent determinant of onset (Ludolph et al., 2007) particularly<br />
in combination <strong>with</strong> a measure of neurological score. Use of neurological scores alone are also common <strong>and</strong><br />
well accepted, although subject to greater potential for user error <strong>and</strong> user bias if studies are not conducted<br />
in a suitably blinded fashion. Some example of commonly used neurological scoring systems include:<br />
measurements of splay (or other measures of paralysis) <strong>and</strong> beam walk. Please request accompanying video<br />
material if you are interested in viewing a demonstration of a commonly used neurological scoring system.<br />
As highlighted by <strong>ALS</strong>TDI (Scott et al., 2008) a combination of use of weight <strong>and</strong> neurological score may be<br />
the most reliable <strong>and</strong> gentle (i.e. not introducing additional stressors) way to both measure onset as well as to<br />
identify non-<strong>ALS</strong> mediated deaths in animals that don’t demonstrate the typical progression of weight loss in<br />
combination <strong>with</strong> increasing neurological score. For the G93A B6SJL mixed background animals onset,<br />
as defined based on first signs of a decrease in body weight, is typically around day 100. Please refer to the<br />
<strong>ALS</strong> mouse model comparison chart found in Table 1 for estimates of disease onset for the other SOD1<br />
mutation-based models.<br />
Consideration 6: Endpoint<br />
Recommendation: Although there is a lack of consensus in the field, the most commonly used disease<br />
endpoint in preclinical studies involving <strong>ALS</strong> SOD1 mouse models, is the inability of an animal to right itself<br />
<strong>with</strong>in 15-30 seconds if laid on either side<br />
Just as there is debate in the field regarding the best way to measure disease onset in <strong>ALS</strong> mouse models,<br />
there is likewise debate as to whether it is preferable to use a functional or a survival-based outcome measure<br />
(endpoint) or a combined measure reflecting both. Survival (or rather “death”) in preclinical studies is<br />
typically measured as the inability of an animal to right itself <strong>with</strong>in 15-30 seconds if laid on either side<br />
(Ludolph et al., 2007<strong>and</strong> Scott et al., 2008). Common functional measures used include rotarod, grip<br />
strength, running wheel activity, <strong>and</strong> gait analysis-but there is far less agreement as to which, if any, of these<br />
is preferable to any other, nor is there any st<strong>and</strong>ardization between/among them (i.e. way to convert or<br />
<strong>Working</strong> <strong>with</strong> <strong>ALS</strong> <strong>Mice</strong> 5
directly compare time to a given rotarod score to time to a given grip strength score). For the purposes of these<br />
recommendations, we support the use of survival endpoints, given the humane, relatively straightforward, <strong>and</strong><br />
widespread use of the 15-30 sec/side righting test, although we believe that functional measures may provide a<br />
more sensitive gauge of therapeutic efficacy.<br />
Consideration 7: Proving Access of Treatment to Target Tissue<br />
Recommendation: Before undertaking thorough preclinical studies in large cohorts of animals, ensure that the<br />
therapeutic intervention of interest has the intended effect on the target tissue of interest using a reasonable<br />
biological correlate<br />
<strong>The</strong> ability of a therapeutic intervention to affect the target should be determined before preclinical efficacy<br />
studies are begun. In the case of <strong>ALS</strong>, this often (although not always) means showing that a treatment is able<br />
to cross the blood brain barrier (in the case of treatments applied systemically) <strong>and</strong> have the intended effect in<br />
the brain <strong>and</strong>/or spinal cord. Because these target tissue confirmation studies are really proof-of-concept studies<br />
(prior to initiation of a preclinical study) it is possible to use smaller numbers of animals for this type of study<br />
(although keeping the considerations enumerated above in mind) to establish this issue of proper<br />
drug distribution.<br />
In addition to this basic penetration/access question, it is also essential before embarking on a preclinical<br />
study to have evidence of some direct measure of efficacy/biological correlate i.e. in the case of a treatment<br />
which is believed to act via increased proliferation of mitochondria, provide direct measure indicating such<br />
(mitochondrial counts in drug vs. controls) or if a proposed survival explanation involves an increase in<br />
autophagy, provide direct measure indicating such. Providing data on biological correlates adds considerable<br />
weight to the interpretation of preclinical studies <strong>and</strong> also can be an early warning sign that a preclinical study<br />
is not warranted if the treatment of interest is unable to reproduce in vivo the biological effect predicted or<br />
shown in vitro.<br />
Finally, histopathological measurements are highly recommended as an independent measure of<br />
treatment efficacy. Stereologically appropriate motor neuron cell counts, somal measurements, <strong>and</strong> other<br />
immunohistochemical observations of glial activation or immune system responses can provide valuable<br />
insights into treatment efficacy <strong>and</strong> mechanism of action at the micro-level. <strong>The</strong>se types of analyses are<br />
complimentary to the survival <strong>and</strong> behavioral measurements that are usually the major focus of preclinical<br />
studies. It is reasonable (<strong>and</strong> cost effective) to collect tissues of interest during the course of a preclinical study<br />
for future histopathological examination should a therapeutic effect be detected.<br />
Consideration 8: Dose Response<br />
Recommendation: Although demonstrating a full dose response curve is not a necessary component of <strong>ALS</strong><br />
preclinical studies, demonstration that the effects of a treatment of interest show some correlation <strong>with</strong> dose is an<br />
important <strong>and</strong> powerful confirmation of efficacy<br />
For purposes of translation from preclinical testing results into human trials, it is necessary to demonstrate a<br />
dose-response curve. While it is clear that mice are not humans <strong>and</strong> there are many factors which must<br />
be considered when trying to convert effective doses from mouse to man, the simple demonstration that<br />
<strong>with</strong>in a particular dose range, increasing or decreasing dose changes the therapeutic effect of a treatment<br />
is a critical proof-of-concept for any proposed therapy. Single dose studies are difficult to interpret, particularly<br />
in the absence of pharmacokinetic data, <strong>and</strong> are insufficient for moving a compound forward into<br />
human-based studies. For this type of study (as <strong>with</strong> the target access confirmation studies discussed above),<br />
once a therapeutic effect has been detected, it is possible to use smaller animal cohorts (fewer animals/dose)<br />
to determine dose response curves.<br />
6<br />
<strong>Working</strong> <strong>with</strong> <strong>ALS</strong> <strong>Mice</strong>
Consideration 9: Pharmacokinetics<br />
Recommendation: Once therapeutic efficacy has been shown, pharmacokinetic analysis of the therapy of interest<br />
is an essential step in the effort to translate preclinical findings into human treatments<br />
Pharmacokinetics is the study of what happens to a drug once it enters the body. Also referred to as ADME<br />
analysis (Absorption, Distribution, Metabolism, <strong>and</strong> Excretion), underst<strong>and</strong>ing the pharmacokinetic<br />
properties of a compound is critical to establishing a treatment as a viable therapy (as, in combination <strong>with</strong><br />
obtaining a thorough underst<strong>and</strong>ing of a given intervention’s toxicity profile, ADME analysis is an essential<br />
regulatory step before moving into human trials).<br />
Absorption:<br />
Distribution:<br />
Metabolism:<br />
Excretion:<br />
the process of a substance entering into the body<br />
the dispersion of a substance throughout the various<br />
compartments/tissues of the body<br />
the breakdown of a substance into its metabolites<br />
<strong>and</strong>/or component parts<br />
the removal of a substance (<strong>and</strong> its metabolites) <strong>and</strong><br />
redistribution to outside of a body<br />
<strong>The</strong>se types of studies (also see section above on providing that compound of<br />
interest is brain/spinal cord penetrant) to determine the mechanism(s) of absorption<br />
<strong>and</strong> distribution of a given intervention, the rate at which a treatment’s action begins <strong>and</strong> the duration of the<br />
treatment effect, the changes that happen to a given substance in the body (e.g. the effect of enzymes or pH),<br />
<strong>and</strong> the effects <strong>and</strong> routes of excretion of any metabolites of the compound, are critical for interpreting the<br />
outcome of a preclinical study.<br />
Consideration 10: Statistics<br />
Recommendation: Use conservative statistical analyses, given the potential for uncontrolled variables to influence<br />
study outcomes<br />
Given the various challenges <strong>and</strong> limitations in translating preclinical studies into clinical effects (particularly<br />
in the field of neurodegeneration), we recommend that researchers use fairly conservative statistical analyses<br />
when analyzing their preclinical data. <strong>The</strong> ENMC group has recommended use of a Cox proportional hazards<br />
analysis (Ludolph et al., 2007) for experiments where the outcome is influenced by multiple variables (e.g.<br />
experiments on mixed backgrounds where both gender <strong>and</strong> litter may influence outcomes). Other statistical<br />
analyses may also be useful, but researchers should be careful to consider the number of major variables that<br />
should be taken into consideration when selecting which statistical calculations to perform. It is essential to<br />
use blinded observers when taking animal measurements throughout a preclinical experiment.<br />
Consideration 11: Environmental Factors<br />
Recommendation: SOD1 mouse models of disease, especially on congenic backgrounds, appear to be quite<br />
sensitive to environmental factors, therefore it is important to st<strong>and</strong>ardize environmental conditions as much as<br />
possible as these factors may influence measured lifespan<br />
Environmental factors are commonly acknowledged to influence the health <strong>and</strong> survival of laboratory mice in<br />
general <strong>and</strong> there is evidence to suggest that SOD1 mutant mice may be more susceptible to these potential<br />
stressors than wildtype animals. Discussions of exercise <strong>and</strong> housing-related factors in particular are included<br />
below <strong>and</strong> should be considered when designing SOD1 mouse preclinical studies.<br />
<strong>Working</strong> <strong>with</strong> <strong>ALS</strong> <strong>Mice</strong> 7
Exercise is the primary environmental factor that has been studied to date <strong>with</strong> respect to <strong>ALS</strong> SOD1<br />
mouse models. <strong>The</strong>re is a fair bit of data to suggest that there is an interaction between exercise <strong>and</strong> disease<br />
progression <strong>and</strong> potentially between exercise <strong>and</strong> survival in both <strong>ALS</strong> mice as well as <strong>ALS</strong> patients. <strong>The</strong><br />
effects of exercise in <strong>ALS</strong> are not straightforward <strong>and</strong> appear to depend on the type <strong>and</strong> intensity of physical<br />
activity. Intense, high endurance exercise regimes have been shown to exacerbate motor defects <strong>and</strong> shorten<br />
lifespan (Mahoney et al., 2004). According to <strong>ALS</strong>-TDI, multiple sequential rotarod trials given twice weekly,<br />
along <strong>with</strong> grip strength <strong>and</strong> stride length tests, appear to accelerate disease progression in SOD1 mice<br />
(Gill et al., 2009). However, others have shown that moderate levels of low endurance exercise appear to<br />
be beneficial to SOD1 mice as well as <strong>ALS</strong> patients (McCrate <strong>and</strong> Kaspar, 2008). While the precise role that<br />
exercise plays in disease progression <strong>and</strong> survival remain poorly defined, the impact of exercise, <strong>and</strong> use of<br />
outcome measures requiring exercise (such as rotarod or exercise wheels) should be carefully considered<br />
when designing drug testing studies.<br />
In addition to exercise, both stressful <strong>and</strong> enriched housing conditions can cause physiological <strong>and</strong> behavioral<br />
consequences in laboratory mice (Olsson <strong>and</strong> Dahlborn 2002) <strong>and</strong> may impact the measured survival of<br />
SOD1 mutant transgenic mice. Potential housing-related stressors (or conversely enrichments) include<br />
excessive h<strong>and</strong>ling, crowded cages, presence/absence of nesting material, toys, <strong>and</strong> cage inserts (such as<br />
houses, tubes, <strong>and</strong> platforms), noisy environments, <strong>and</strong> erratic changes in light/dark cycle. Due to the<br />
mundane nature of these concerns, they are often ignored as factors influencing outcomes of animal testing.<br />
However differential treatment of mice could unintentionally introduce variability in the experimental design<br />
<strong>and</strong> confound interpretation of results. <strong>The</strong>refore it is critically important to st<strong>and</strong>ardize mouse h<strong>and</strong>ling<br />
<strong>and</strong> housing conditions as much as possible for experiments using SOD1 mutant mice (particularly those on<br />
pure/congenic backgrounds).<br />
Consideration 12: Multi-drug Treatment<br />
Multi-drug treatments (polytherapy) are complex from both a scientific <strong>and</strong> a regulatory perspective. A<br />
discussion of these complexities is beyond the scope of these materials but at a bare minimum, it is necessary<br />
to either show that each component of a multi-drug treatment has efficacy on its own <strong>and</strong>/or to show an<br />
additive or synergistic effect of components on the relevant biological correlate(s).<br />
8<br />
<strong>Working</strong> <strong>with</strong> <strong>ALS</strong> <strong>Mice</strong>
Part II. Colony Management Considerations<br />
Many labs <strong>and</strong> companies have already chosen to breed <strong>and</strong> maintain their own colonies of <strong>ALS</strong> mouse models<br />
rather than obtain these commercially; therefore in addition to considering specific questions of preclinical<br />
study design using <strong>ALS</strong> mouse models, it is also important to consider the current best practices <strong>and</strong> information<br />
regarding breeding <strong>and</strong> maintaining SOD1 mutant mouse colonies. <strong>The</strong> following sections are designed to<br />
provide background <strong>and</strong> highlight issues to consider when either developing one’s own colony or when obtaining<br />
animals from non-commercial sources.<br />
Consideration 1: Strain Background<br />
Inbred/Straight Lines<br />
As a bit of background, there are currently well over 400 “straight” (not genetically modified) inbred strains<br />
of mice (excluding the various congenic <strong>and</strong> recombinant lines made using these strains), <strong>with</strong> extensive<br />
documented genealogies. Inbred strains of mice are nearly identical to each other in genotype as a result of at<br />
least twenty generations of brother x sister mating. Examples of a few of the work-horses of these inbred strains<br />
include C57BL/6J, C3H/HeJ, <strong>and</strong> FVB/NJ.<br />
Each of these inbred strains is genetically unique <strong>with</strong> distinct phenotypic characteristics. Sometimes these<br />
characteristics are useful in research, while at other times they may preclude the use of a particular strain for a<br />
given research project. For example, strain AKR has a high background incidence of leukemia while C57BL/6<br />
mice have relatively low levels of cancer, <strong>and</strong> tend to be relatively resistant to carcinogens.<br />
Congenic Lines<br />
While there is a multiplicity of existing mouse lines, we will confine the majority of our discussions to congenic<br />
lines <strong>and</strong> F1 hybrids using the C57BL/6J <strong>and</strong> SJL strains, as these are the most relevant strains/backgrounds for<br />
the currently existing mouse models of <strong>ALS</strong>.<br />
In the creation of a wide variety of disease models, targeted mutations <strong>and</strong> transgenes are frequently transferred<br />
into inbred backgrounds to minimize genetic variability <strong>with</strong>in experiments <strong>and</strong> to ensure reproducibility<br />
of conclusions. <strong>The</strong> resulting mutant/transgenic line is referred to as a congenic line <strong>and</strong> is produced by<br />
repeated backcrosses to an inbred strain, <strong>with</strong> selection for a particular marker from the donor strain. Figure 1<br />
demonstrates the estimated statistical dilution of the donor strain genome <strong>with</strong> the new host genome <strong>with</strong> each<br />
generation. After 10 generations, the genetic background is statistically overwhelmingly that of the host (inbred)<br />
strain (<strong>and</strong> can be considered a fully congenic line.<br />
Hybrid Lines<br />
In the specific case of the SOD1-G93A (or G93A-SOD1) transgene, the original transgenic animals were on a<br />
non-uniform background consisting of a mixture of SJL <strong>and</strong> C57BL/6J genetic backgrounds. <strong>The</strong>se mixed B6SJL<br />
animals, sometimes mistakenly referred to as “Gurney” mice after the original paper announcing their creation,<br />
are still widely used in <strong>ALS</strong> research. <strong>The</strong>se mice are maintained by breeding transgenic males back to a wildtype<br />
B6SJL F1 female (see the next section for more extensive discussion of F1 hybrids). This approach is often<br />
embraced as a method of maintaining genetic diversity, since constant inbreeding (i.e. brother sister mating)<br />
over time can result in the fixation of undesirable alleles.<br />
While these hybrid animals are widely used in the <strong>ALS</strong> research field, many <strong>ALS</strong> experiments are also currently<br />
conducted on a congenic line where the transgene has been transferred (backcrossed for 10+ generations) to<br />
a C57BL/6J background. <strong>The</strong>se animals are referred to as B6.Cg-Tg(SOD1*G93A)1Gur/J mice or often by the<br />
shorth<strong>and</strong> “B6 G93A mice”. <strong>The</strong> nomenclature of this congenic strain (indicated by the “Cg”), denotes the<br />
transfer of the SOD1-G93A transgene from a complex background to the host C57BL/6J strain (abbreviated B6)<br />
<strong>with</strong> the punctuation mark of a period indicating that the mutation has been backcrossed onto the B6 genetic<br />
background for greater than 10 generations.<br />
<strong>Working</strong> <strong>with</strong> <strong>ALS</strong> <strong>Mice</strong> 9
Mixed Background<br />
(N1-N4)<br />
Incipient Congenic<br />
(N5-N9)<br />
Congenic<br />
(N10+)<br />
Percent Recipient Strain<br />
100<br />
80<br />
60<br />
40<br />
20<br />
50%<br />
75%<br />
87.5%<br />
93.8%<br />
96.9%<br />
98.4% 99.2% 99.6% 99.8%<br />
Homozygosity<br />
Heterozygosity<br />
99.95% 99.99%<br />
99.91% 99.98%<br />
0<br />
1<br />
2 3 4 5 6<br />
Backcross Generation<br />
7 8 9 10 11 12 13<br />
Figure 1. In the making of congenic strains, donor strain A (indicated in blue) is mated <strong>with</strong> recipient strain B (indicated<br />
in red). <strong>The</strong> progeny of this cross has a 50% genetic contribution from the host <strong>and</strong> 50% percent genetic contribution<br />
from the donor strain. With every passing generation of backcrossing to the host strain, approximately 50% of the<br />
donor genome (green) is replaced <strong>with</strong> the new recipient genome (red). After 10 generations, the residual amount of<br />
unlinked donor genome in the strain is likely to be less than 0.01 percent.<br />
Mixed Genetic (Hybrid) Background: Advantages <strong>and</strong> Disadvantages<br />
As mentioned above, breeding transgenic males back to a B6SJL F1 hybrid female ensures r<strong>and</strong>omization of<br />
alleles inherited from either strain <strong>with</strong>in a population of alleles. In general, breeding back to an F1 offers<br />
other advantages in that progeny tend to be more robust, tend to live longer, exhibit fewer idiosyncrasies of<br />
the parental strains, <strong>and</strong> are less sensitive to adverse environmental conditions than inbred strains. This is the<br />
concept of hybrid vigor. When mating mice back to an F1 hybrid, the resulting offspring will be genetically<br />
different from one another, but proportionately homozygous or heterozygous at either parental locus. This<br />
breeding scheme ensures r<strong>and</strong>omization of alleles inherited from either strain <strong>with</strong>in a population of alleles.<br />
<strong>The</strong> major experimental advantage of having the G93A transgene on the mixed B6SJL background is that the<br />
phenotypic onset of the disease is significantly earlier than on the inbred background.<br />
A disadvantage of mating animals back to an F1 hybrid (thereby maintaining the transgene on a mixed<br />
background) is that each animal resulting from this mating has a unique genetic background, so there is no<br />
information on the genotypes of individuals unless each is specifically genotyped. <strong>The</strong> evidence of segregating<br />
alleles between C57BL/6J <strong>and</strong> SJL, for example, is immediately evident in the wide variety of coat colors<br />
manifest in the resultant offspring, which may be White Bellied Agouti, Black, Albino, or Tan w/pink eyes.<br />
Phenotypic variation is usually greater than is found <strong>with</strong> congenic strains, as individuals differ due to both<br />
genetic <strong>and</strong> non-genetic factors. This means that more animals are usually needed in a given experiment to<br />
achieve a given level of statistical precision. It is because of this increased variability that litter-mate matching<br />
in preclinical studies is so critical.<br />
Another potential disadvantage <strong>with</strong> using mixed background/hybrid animals is the increased risk of incorrect<br />
mating in this breeding scheme. Animal husb<strong>and</strong>ry personnel may not fully underst<strong>and</strong> the necessity to<br />
mate transgenic animals back to the pure strain hybrid F1 generation, <strong>and</strong> may accidentally intercross mice,<br />
drastically changing the genetic background of the resulting colony. This genetic drift <strong>and</strong> the creation of<br />
mouse sub-colonies <strong>with</strong> differing characteristics can cause significant problems <strong>with</strong> interpretability of<br />
preclinical studies <strong>and</strong> colony-to-colony reproducibility.<br />
10<br />
<strong>Working</strong> <strong>with</strong> <strong>ALS</strong> <strong>Mice</strong>
Inbred Lines: Advantages <strong>and</strong> Disadvantages<br />
<strong>The</strong>re are several major advantages of using inbred strains. First, congenic strains are co-isogenic, meaning<br />
that all animals <strong>with</strong>in a strain are virtually genetically identical. This lack of genetic variation promotes<br />
phenotypic uniformity <strong>with</strong>in the strain such that the only variation between individuals is likely to be due to<br />
non-genetic causes. One consequence of this increased uniformity is that fewer inbred animals will be needed<br />
to achieve a given level of statistical precision than if hybrid/mixed background animals had been used (need<br />
for littermate matching is reduced/eliminated).<br />
Second, as a broad generalization, inbred strains tend to be more sensitive to environmental influences than<br />
F1 hybrids. This increased environmental sensitivity may present an advantage in that congenic animals tend<br />
to be more sensitive to experimental treatments than other types of animals. Third, because congenic strains<br />
normally stay genetically constant for long periods, accidental genetic contamination is more easily identified<br />
than when using a mixed background. A wide range of existing DNA genetic markers makes genetic quality<br />
control relatively simple when using congenic animals (refer to quality control section).<br />
Regarding disadvantages to using congenic animals, as mentioned above, congenic animals show increased<br />
sensitivity to environmental factors versus hybrid animals. While this may be advantageous in some instances,<br />
in some experimental contexts it may actually present a serious disadvantage because the impact of any<br />
uncontrolled/unexamined environmental variables will be magnified <strong>and</strong> animals will tend to show greater<br />
variability in their measured responses due to causes outside of the focus of the experiment. Because of this<br />
enhanced sensitivity, when using congenic animals extra care is required to ensure that such animals have<br />
highly controlled <strong>and</strong> similar environments so as not to confound experimental results <strong>and</strong> interpretations.<br />
Another disadvantage of transferring mutations onto inbred backgrounds is that litter sizes are usually<br />
significantly smaller than maintaining a mutation on an F1 background. This often translates into significant<br />
increases in animal husb<strong>and</strong>ry costs depending on the litter size or breeding performance of the inbred line.<br />
In spite of this potential disadvantage, <strong>with</strong> respect to <strong>ALS</strong> research the pure C57BL/6J strain (the strain used<br />
in the creation of the majority of congenic <strong>ALS</strong> mutant transgenic lines) is considered a good breeding strain<br />
<strong>with</strong> a relatively good litter size ranging from 4-8 pups per litter.<br />
Consideration 2: Genetic Backgrounds <strong>and</strong> Breeding Strategies of Existing<br />
G93A‐SOD1 Mutant Lines<br />
<strong>The</strong> Hybrid B6SJL Line<br />
<strong>The</strong> SOD1-G93A (or G93A-SOD1) transgene was designed <strong>with</strong> a mutant human SOD1 gene (harboring<br />
a single amino acid substitution of glycine to alanine at codon 93) driven by its endogenous human SOD1<br />
promoter. This transgene was injected into fertilized B6/SJL F1 mouse eggs <strong>and</strong> founder animals were<br />
obtained. Transgenic mice on a mixed B6/SJL genetic background were sent to <strong>The</strong> <strong>Jackson</strong> Laboratory <strong>and</strong><br />
are currently distributed as (Stock No. 002726, www.jax.org/jaxmice/strain/002726).<br />
<strong>The</strong> hybrid strain is maintained by breeding hemizygous carrier males to B6SJL F1 hybrid females at each<br />
generation. Transgenic mice on this background have a decreased life span compared to congenic animals<br />
(on a pure C57BL/6J background), <strong>with</strong> 50% survival observed at 128.9+/-9.1 days in the mixed background<br />
versus 50% survival at 157.1+/-9.3 days for the pure congenic background. Although female transgenic mice<br />
<strong>with</strong> the mixed B6SJL background occasionally produce litters, as <strong>with</strong> the congenic C57BL/6J line, there<br />
is a very high incidence of non-productive matings. In addition to the transgenic line itself, researchers<br />
who choose to maintain their own colonies by breeding this line in their own vivarium must also house<br />
independent colonies of C57BL/6J <strong>and</strong> SJL/J colonies to produce the (C57BL/6J X SJL/J) F1 females necessary<br />
for mating. Alternatively, the F1 females can be obtained from <strong>The</strong> <strong>Jackson</strong> Laboratory (Stock No. 100012,<br />
www.jax.org/jaxmice/strain/100012).<br />
<strong>Working</strong> <strong>with</strong> <strong>ALS</strong> <strong>Mice</strong> 11
<strong>The</strong> Congenic C57BL/6J Line<br />
Upon receipt of the original hybrid B6SJL mutant SOD1-G93A animals, some of these mice were<br />
backcrossed to C57BL/6J for at least 10 generations to generate a congenic strain (Stock No. 004435,<br />
www.jax.org/jaxmice/strain/004435). <strong>The</strong> backcross was completed in July 2002 by Dr. Greg Cox.<br />
<strong>The</strong>se animals can be maintained by simply breeding hemizygous transgenic males to C57BL/6J females<br />
(the transgenic females are not very efficient breeders).<br />
<strong>The</strong> G93A-SOD1 Mutant Transgene on Other Strain Backgrounds<br />
Since genetic background is known to affect disease onset <strong>and</strong> progression, a number of different genetic<br />
backgrounds have been used in exploring modifier alleles in <strong>ALS</strong>. When choosing a genetic background<br />
one should consider 1) if disease onset <strong>and</strong> progression is conducive to the experiment, <strong>and</strong> 2) the strain<br />
characteristics of the genetic background being considered.<br />
<strong>The</strong> transfer of the SOD1-G93A transgene onto different genetic backgrounds has identified two groups of<br />
inbred strains; early onset <strong>and</strong> late onset strains. Late onset strains include the C57BL/6J congenic mice<br />
161+/-10 days, BALB/cByJ congenic mice 148+/-11 days, <strong>and</strong> the DBA/2J congenic mice 169+/-10 days.<br />
<strong>The</strong> early onset strains include the ALR/LtJ congenic mice 116+/-11 days, NOD-Rag1 null congenic mice<br />
111+/-12 days <strong>and</strong> (from Terry Heiman-Patterson at Drexel) SJL congenic mice 119+/-10 days. (Dr. Greg Cox,<br />
<strong>JAX</strong> communication, 2009).<br />
<strong>The</strong> characteristics of individual inbred strains are important factors to consider when selecting a particular<br />
line to work <strong>with</strong> <strong>and</strong>/or interpreting experimental results. For example, SJL mice are noted for extreme<br />
aggression in males, <strong>and</strong> have also been shown to have an increased rate of muscle regeneration after injury<br />
when compared to BALB/c mice. ALR/Lt mice have a genetic basis for resistance to free radical mediated<br />
stressors, as well as to immune system mediated stress. ALR is also homozygous for Cdh23 ahl , the age related<br />
hearing loss 1 mutation, which on this background results in progressive hearing loss <strong>with</strong> onset prior to<br />
three months of age. <strong>The</strong>re are various other strain differences too numerous to mention here, the general<br />
characteristics of mouse strains can be viewed in Dr. Michael Festing’s Inbred Strains of <strong>Mice</strong> accessible on line<br />
at www.informatics.jax.org/external/festing/search_form.cgi<br />
Consideration 3. Quality Assurance Measures for SOD1-G93A Colonies<br />
Copy Number <strong>and</strong> Pedigree Analysis<br />
<strong>The</strong> number of t<strong>and</strong>em SOD1-G93A transgenes that integrated into the genome in the original Gurney line<br />
is estimated to be upwards of 28 copies (Gurney et al., 1994) <strong>and</strong> is susceptible to spontaneous drops in copy<br />
number at an incidence ranging from 2-6% (Alex<strong>and</strong>er et al., 2004; Scott et al., 2008). <strong>The</strong> most sensitive<br />
way to monitor copy number is through QPCR (see attached protocol Appendix A). It is imperative that<br />
every animal be monitored for copy number loss against st<strong>and</strong>ardized controls, especially the breeder males.<br />
<strong>The</strong> longer lived male breeder (<strong>with</strong> copy number drop) will produce many more progeny than the shorter<br />
lived high copy number SOD1-G93A male <strong>and</strong> the reduced copy number genotype will quickly contaminate/<br />
monopolize a small breeding colony. Any animal exhibiting a reproducible drop in copy number should be<br />
discarded <strong>and</strong> siblings/progeny monitored closely. Related to this, any animal displaying a significant delay in<br />
disease onset or moribund status should be eliminated from the breeding colony, along <strong>with</strong> any descendants<br />
from that animal (as the most likely explanation for this delay is copy number drop). Likewise, siblings of an<br />
animal <strong>with</strong> a delay in onset should also be monitored closely. Retesting for copy number in these animals is<br />
recommended, although it is not necessarily the case that all copy number drops will be detectable.<br />
Although QPCR detects large drops in copy number very well, copy number loss of less than 25-30% can<br />
fall below the threshold of sensitivity of this assay. Thus, it is imperative to couple copy number analysis<br />
<strong>with</strong> disease onset <strong>and</strong> moribund analysis. Animals <strong>with</strong> disease onset are readily identifiable by visual<br />
12<br />
<strong>Working</strong> <strong>with</strong> <strong>ALS</strong> <strong>Mice</strong>
inspection <strong>and</strong> all breeders <strong>and</strong> experimental cohorts should be examined weekly during regular cage<br />
changing. Symptoms of onset in animals include an unsteady wobbly gait <strong>with</strong> the development of a<br />
scruffy-looking coat <strong>and</strong> reduced limb splay (refer to Appendix B <strong>and</strong> accompanying video). In addition to<br />
visual onset, animals should be weighed at least weekly, as disease onset strongly correlates <strong>with</strong> maximum<br />
weight gain <strong>and</strong> thus weight loss is an excellent indicator of disease onset. Moribund analysis is performed<br />
by placing an animal on its side (refer to accompanying video). Failure of the animal to right itself on all four<br />
limbs <strong>with</strong>in 15-30 seconds is an indicator that the animal is no longer capable of reaching the food hopper<br />
or water source <strong>and</strong> should thus be euthanized.<br />
It is particularly important for researchers maintaining their own colony of mice to check the copy number<br />
in all of their breeders <strong>and</strong> progeny (Appendix A) <strong>and</strong> to monitor disease onset <strong>and</strong> moribund status. This<br />
information should be tracked in a detailed pedigree ledger. See Appendix C for an example of a pedigree<br />
ledger <strong>and</strong> explanation of use.<br />
Genetic Quality Control<br />
<strong>The</strong> aim of genetic quality control programs is to detect genetic contamination of one strain through an<br />
inadvertent mating <strong>with</strong> another strain. Genetic contamination is often uncovered by noting changes in<br />
breeding performance, physical appearance (such as coat color or body size) or deviations in Mendelian<br />
ratios. Given the variability of phenotypes observed particularly for the B6SJL mixed background animals,<br />
genetic contamination is more difficult to quickly detect. <strong>The</strong>refore, we strongly recommend that researchers<br />
maintaining their own SOD1 colonies routinely monitor their colonies approximately 2‐4 times per year<br />
as a precaution.<br />
Monitoring to detect genetic contamination is quite straightforward; we recommend using a genotype‐based<br />
approach to assay single-nucleotide polymorphism (SNP) markers positioned throughout the genome.<br />
A panel of 28 SNP assays was determined to be sufficient to<br />
identify strain contamination (Petkov et al., 2004). This<br />
approach provides a quick <strong>and</strong> cost-effective way to<br />
genetically monitor mouse colonies using only a small<br />
tissue sample <strong>and</strong> is easily performed in individual<br />
research laboratories.<br />
In addition to monitoring colonies for gross<br />
contamination through accidental inter-breeding,<br />
researchers also need to ensure that the genetic<br />
backgrounds of their mice do not drift. Genetic drift<br />
is the ability of established inbred strains to genetically<br />
diverge when bred at different facilities over time if<br />
proper genetic control measures are not taken. It is true that<br />
new mutations are relatively rare, <strong>and</strong> only a quarter of these are likely to be fixed even <strong>with</strong> continuous full<br />
sibling mating, so inbred strains tend to stay genetically constant for quite long periods of time. However,<br />
sublines can <strong>and</strong> have occurred when strains have been separated <strong>and</strong> not “refreshed” <strong>with</strong> founder stocks for<br />
too many generations. Unfortunately, many of the mutations that do occur will show no obvious phenotype<br />
except in unusual circumstances. For example, at least seven major substrains of the C57BL/6 line have<br />
emerged <strong>and</strong> been established over the years as a result of isolated breeding at various institutions. Very<br />
recently it was discovered that a deletion in a gene called Nnt1, which regulates metabolism, exists in some<br />
C57BL/6 substrains but not others (Mekada et al., 2009).<br />
Strains can also drift as a result of selective breeding. For example, strains that have severe neurological<br />
phenotypes are often subject to selection from animal husb<strong>and</strong>ry personnel, who may inadvertently select<br />
<strong>Working</strong> <strong>with</strong> <strong>ALS</strong> <strong>Mice</strong> 13
animals from a litter <strong>with</strong> a milder phenotype for breeding. Sharing of colonies among independent research<br />
labs greatly adds to the propagation of both naturally occurring mutations <strong>and</strong> accidental contamination.<br />
Genetic drift in <strong>ALS</strong> SOD1 colonies is extremely undesirable as it has the potential to confound experimental<br />
results between <strong>and</strong> among different research labs. In order to prevent genetic drift between individual mouse<br />
colonies, breeders from foundation stocks must be obtained from the original pedigreed stock at a minimum of<br />
every 10 generations.<br />
Conclusions<br />
<strong>The</strong> G93A mouse line is currently the most widely used experimental model in <strong>ALS</strong> research <strong>and</strong> drug testing.<br />
This transgene currently exists on two genetic backgrounds, the B6SJL mixed hybrid background <strong>and</strong> the<br />
C57BL/6J congenic background, <strong>and</strong> these two groups of animals differ significantly in their disease onset <strong>and</strong><br />
survival. Both backgrounds present experimental advantages <strong>and</strong> disadvantages <strong>and</strong> careful consideration<br />
should be taken in choosing a genetic background based on the researcher’s experimental objectives.<br />
Regardless of genetic background, the G93A transgene has been shown to spontaneously drop copy number<br />
which can greatly confound experimental results. Proper colony management in the form of copy number<br />
analysis, phenotypic assessment, <strong>and</strong> genetic quality controls, as outlined above, is essential for achieving<br />
validity <strong>and</strong> consistency in experimental results.<br />
14<br />
<strong>Working</strong> <strong>with</strong> <strong>ALS</strong> <strong>Mice</strong>
Appendices<br />
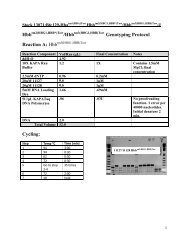
Appendix A. QPCR Protocol for Determining Copy Number<br />
Introduction<br />
<strong>The</strong> principle behind the QPCR technique is that the gene of interest <strong>and</strong> an internal control gene can be<br />
amplified by PCR simultaneously, <strong>and</strong> the PCR products can be monitored after each cycle of amplification,<br />
based on reporter fluorescence specific for either the gene of interest or the internal control. <strong>The</strong> earliest<br />
cycle (CT, cycle threshold), at which an increase of reporter fluorescence above a baseline signal is measured,<br />
should be recorded for the gene of interest <strong>and</strong> an internal control, <strong>and</strong> the difference between these, called<br />
ΔCt, must be calculated. <strong>The</strong> higher the copy number, the fewer cycles needed to amplify sufficient product<br />
for detection. <strong>The</strong>refore cycle number is very useful for monitoring change in transgene copy numbers.<br />
Half a cycle drop (ΔCt value) translates to a 33% drop in the transgene copy number, which is<br />
currently accepted as the detection threshold of qPCR sensitivity for changes in copy number (reference:<br />
Liu D, Schmidt C, Billings T, Davisson M. 2003. Quantitative PCR genotyping assay for the Ts65Dn mouse<br />
model of Down syndrome. BioTechniques 35(6):1170-1180). Any animal exhibiting a reproducible drop in copy<br />
number should be discarded <strong>and</strong> the animal’s siblings/progeny should be monitored closely.<br />
Materials <strong>and</strong> Methods<br />
Taqman QPCR protocols are run on an ABI 7500, 7700, 7900 or the Roche Light Cycler 480. It is important<br />
to use an appropriate instrument-specific Fluorophore/Quencher. <strong>The</strong> transgene zygosity is determined by<br />
comparing ΔCt values of each unknown sample against a st<strong>and</strong>ard high copy control (HC) <strong>and</strong> low copy<br />
control (LC), using appropriate endogenous references.<br />
Protocol Primers<br />
Primer 5’ Label Sequence 5’ --> 3’ 3’ Label<br />
IMR1544 none CAC GTG GGC TCC AGC ATT none<br />
IMR3580 none TCA CCA GTC ATT TCT GCC TTT G none<br />
IMR9665 none GGG AAG CTG TTG TCC CAA G none<br />
IMR9666 none CAA GGG GAG GTA AAA GAG AGC none<br />
TmoIMR0105 Cy5 CCA ATG GTC GGG CAC TGC TCA A Black Hole Quencher 2<br />
TmoIMR0147 6-FAM CTG CAT CTG GTT CTT GCA AAA CAC CA Black Hole Quencher 1<br />
Reaction Component Volume (µl) Final Concentration Total Volume (µl)<br />
2 X TaqMan ® Universal Master Mix 6.25 1.00 X 6.25<br />
40 uM oIMR9665 0.13 0.42 uM 0.13<br />
40 uM oIMR9666 0.13 0.42 uM 0.13<br />
40 uM oIMR1544 0.13 0.42 uM 0.13<br />
40 uM oIMR3580 0.13 0.42 uM 0.13<br />
5 uM TmoIMR0105 0.38 0.15 uM 0.38<br />
5 uM TmoIMR0147 0.38 0.15 uM 0.38<br />
DNA 5.00 - 5.00<br />
<strong>Working</strong> <strong>with</strong> <strong>ALS</strong> <strong>Mice</strong> 15
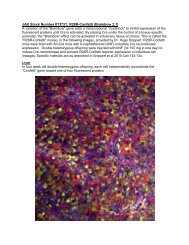
Representative Data<br />
Sample Name<br />
Gene of interest 28.79<br />
Cycle Threshold<br />
(Ct)<br />
Delta Cycle Threshold dCT<br />
(internal control - gene of<br />
interest)<br />
Internal control 24.98 24.98 - 28.79 = -3.81<br />
Control Data<br />
Average Delta Cycle<br />
Threshold St<strong>and</strong>ard Deviation Sample Name<br />
-4.436666667 0.155349069 low copy control<br />
-5.33 0.112694277 high copy control<br />
1. Run samples in triplicate<br />
2. Obtain delta Ct for each sample:<br />
dCt=int. control - gene of interest<br />
3. Obtain average <strong>and</strong> st<strong>and</strong>ard<br />
deviation for each triplicate set<br />
4. Plot dCt values of sample<br />
set <strong>with</strong> known high copy <strong>and</strong><br />
low copy controls<br />
Watch for:<br />
• Large st<strong>and</strong>ard errors<br />
• Low copy number animals<br />
that don’t group <strong>with</strong> others<br />
<strong>and</strong> align <strong>with</strong> low copy controls<br />
(e.g., sample 17 at right)<br />
Any animal displaying a ΔCt value greater than a half cycle difference, or whose st<strong>and</strong>ard deviation places<br />
that animal at more than a half cycle difference as illustrated above, should be re-sampled or discarded. Copy<br />
number drops are estimated to occur at a rate of ~2-6%. Copy number analysis should always be coupled <strong>with</strong><br />
disease onset <strong>and</strong> moribund analysis.<br />
16<br />
<strong>Working</strong> <strong>with</strong> <strong>ALS</strong> <strong>Mice</strong>
Appendix B. Sample Neurological Scoring System<br />
Neurological Score<br />
Regardless of which neurological scoring system is used, scores should be assessed for both hind legs. <strong>The</strong><br />
example neurological scoring system below employs a scale of zero to four developed by <strong>ALS</strong>TDI. Example<br />
criteria used to assign each score under this system (see accompanying video for visual demonstration of<br />
scoring system) are:<br />
Score Criteria<br />
Score of 0:<br />
Score of 1:<br />
Score of 2:<br />
Score of 3:<br />
Score of 4:<br />
Full extension of hind legs away from lateral midline when mouse is suspended by its tail,<br />
<strong>and</strong> mouse can hold this for two seconds, suspended two to three times.<br />
Collapse or partial collapse of leg extension towards lateral midline (weakness) or trembling<br />
of hind legs during tail suspension.<br />
Toes curl under at least twice during walking of 12 inches, or any part of foot is dragging<br />
along cage bottom/table*.<br />
Rigid paralysis or minimal joint movement, foot not being used for generating<br />
forward motion.<br />
Mouse cannot right itself <strong>with</strong>in 30 seconds after being placed on either side.<br />
*If one hind leg is scored as 2, food pellets are left on bedding. If both hind legs are scored as 2, Nutra-Gel®<br />
(Bio-Serve #S4798) is provided as food in addition to food pellets on bedding <strong>and</strong> a long sipper tube is placed<br />
on the water bottle.<br />
<strong>Working</strong> <strong>with</strong> <strong>ALS</strong> <strong>Mice</strong> 17
Appendix C. Template Pedigree Ledger<br />
A pedigree ledger is used to track the information on a strain over the entire history of a colony <strong>and</strong> is useful<br />
in recording a variety of information, such as breeding generation, litter size, dam/sire information etc. <strong>The</strong><br />
recording of information in a pedigree ledger can be extremely detailed to include many observations or it can<br />
be customized to capture only the information immediately required by an investigator. Below is an example<br />
of a simplified pedigree ledger designed in Microsoft Excel on a G93A mouse colony.<br />
Strain Name For example B6.Cg-Tg(SOD1*G93A)1Gur/J<br />
A B C D E F G H<br />
Parents#/Ped# Sex/Geno Birth date Date Mated Gen# euthanized QPCR REF # comments<br />
796x102<br />
808 F B6 9/15/08 10/31/2008 N28<br />
104 M HEMI 9/20/08 148 days 36859 non productive<br />
799x103<br />
844 F B6 9/17/08 N28<br />
105 M HEMI 9/30/09 11/6/2008 155 days 40433<br />
844x105<br />
1037 F B6 12/19/08 1/27/2008 N29<br />
1038 F B6 12/19/08<br />
1039 F B6 12/19/08<br />
106 M HEMI 12/25/09 158 days 45983<br />
Note that pedigree numbers are assigned sequentially <strong>and</strong> are unique <strong>with</strong>in a strain. Column A contains two<br />
sets of pedigree numbers, one for the existing parents (#796 for the C57BL/6J dam <strong>and</strong> 102 for the G93A<br />
transgenic male), <strong>and</strong> the pedigree numbers assigned to a new C57BL/6J female (#808) <strong>and</strong> the offspring<br />
from mating 796x102 (male 104). Note that male 106 from mating 844x105 was used to propagate the line,<br />
but mating 808x104 was noted as non productive in the comments section.<br />
A variety of columns can be added to this spreadsheet so as to capture as much (or as little) information as<br />
desired by the investigator; for example onset of wobbly gait or the week where weight loss was noted. This<br />
example shows birth dates, mating dates, backcross generation number, <strong>and</strong> the days of age a given male was<br />
euthanized. One column should contain the QPCR data for each animal so that one can easily reference that<br />
data in the event the animal lives longer than expected.<br />
Pedigree ledgers are necessary tracking tools for any colony, but are particularly useful for the G93A colony.<br />
For example, if a given male survived to 200 days, one could eliminate any subsequent mating of animals sired<br />
by this male <strong>and</strong> still maintain the overall integrity of the colony. In addition, any data already derived from<br />
animals resulting from that mating would immediately be called into question.<br />
18<br />
<strong>Working</strong> <strong>with</strong> <strong>ALS</strong> <strong>Mice</strong>
Appendix D. List of Reviewers<br />
Expert Reviewers who Provided Feedback<br />
1. Dave Borchelt, Ph.D. (University of Florida)<br />
2. Bob Brown Jr., M.D. Ph.D. (University of Massachusetts)<br />
3. Lucie Bruijn, Ph.D. (<strong>ALS</strong> Association)<br />
4. Greg Cox, Ph.D. (<strong>The</strong> <strong>Jackson</strong> Laboratory)<br />
5. Merit Cudkowicz, M.D., M.Sc. (Northeast <strong>ALS</strong> Consortium (NE<strong>ALS</strong>))<br />
6. Sharon Hesterlee, Ph.D. (Muscular Dystrophy Association Venture Philanthropy)<br />
7. Terry Heiman-Patterson, M.D. (Drexel University College of Medicine)<br />
8. Brian Kaspar, Ph.D. (Ohio State University)<br />
9. Jean-Pierre Julien, Ph.D. (Laval University)<br />
10. Jonathan Matthews, Ph.D. (University of Massachusetts)<br />
11. Steve Perrin, Ph.D. (<strong>ALS</strong> <strong>The</strong>rapy Development Institute)<br />
12. Mercedes Prudencio, Ph.D. (University of Florida)<br />
13. Jeffrey Rothstein, M.D., Ph.D. (Johns Hopkins University)<br />
14. Fern<strong>and</strong>o Vieira, M.D. (<strong>ALS</strong> <strong>The</strong>rapy Development Institute)<br />
<strong>Working</strong> <strong>with</strong> <strong>ALS</strong> <strong>Mice</strong> 19
References<br />
Alex<strong>and</strong>er GM, Erwin KL, Byers N, Deitch JS, Augelli BJ, Blankenhorn EP, Heiman-Patterson TD. 2004. Effect of<br />
transgene copy number on survival in the G93A SOD1 transgenic mouse model of <strong>ALS</strong>. Brain Res Mol Brain Res<br />
130(1-2):7-15.<br />
Borchelt DR, Lee MK, Slunt HS, Guarnieri M, Xu ZS, Wong PC, Brown RH Jr., Price DL, Sisodia SS, Clevel<strong>and</strong> DW.<br />
1994. Superoxide dismutase 1 <strong>with</strong> mutations linked to familial amyotrophic lateral sclerosis possesses significant<br />
activity. Proc Natl Acad Sci USA 91(17):8292-6.<br />
Bruijn LI, Becher MW, Lee MK, Anderson KL, Jenkins NA, Copel<strong>and</strong> NG, Sisodia SS, Rothstein JD, Borchelt DR,<br />
Price DL, Clevel<strong>and</strong> DW. 1997. <strong>ALS</strong>-Linked SOD1 Mutant G85R Mediates Damage to Astrocytes <strong>and</strong> Promotes<br />
Rapidly Progressive Disease <strong>with</strong> SOD1-Containing Inclusions. Neuron 18:327‐338.<br />
Bruijn LI, Miller TM, Clevel<strong>and</strong> DW. 2004. Unraveling the mechanisms involved in motor neuron degeneration in<br />
<strong>ALS</strong>. Annu Rev Neurosci 27:723-49.<br />
Clevel<strong>and</strong> DW, Rothstein JD. 2001. From Charcot to Lou Gehrig: deciphering selective motor neuron death in <strong>ALS</strong>.<br />
Nat Rev Neurosci 2(11):806-19.<br />
Deforges S, Branchu J, Biondi O, Grondard C, Pariset C, Lécolle S, Lopes P, Vidal PP, Chanoine C, Charbonnier F.<br />
2009. Motoneuron survival is promoted by specific exercise in a mouse model of amyotrophic lateral sclerosis.<br />
J Physiol 15;587(Pt 14):3561-72.<br />
Fischer L, Asress S, Wang M, Glass J. 2007. Axonal Degeneration <strong>and</strong> Oxidative Stress: Revisiting the SOD1<br />
Knockout Mouse. Amyotrophic Lateral Sclerosis Suppl 1: 30-31.<br />
Gill A, Kidd J, Vieira F, Thompson K, Perrin S. 2009. No benefit from chronic lithium dosing in a sibling-matched,<br />
gender balanced, investigator-blinded trial using a st<strong>and</strong>ard mouse model of familial <strong>ALS</strong>. PLoS One 4(8):e6489.<br />
Gurney ME, Pu H, Chiu AY, Dal Canto MC, Polchow CY, Alex<strong>and</strong>er DD, Caliendo J, Hentati A, Kwon YW, Deng<br />
HX, Chen W, Zhai P, Sufit RL, Siddique T. 1994. Motor neuron degeneration in mice that express a human Cu,Zn<br />
superoxide dismutase mutation. Science 264(5166):1772-5.<br />
Heiman-Patterson TD, Deitch JS, Blankenhorn EP, Erwin KL, Perreault MJ, Alex<strong>and</strong>er BK, Byers N, Toman I,<br />
Alex<strong>and</strong>er GM. 2005. Background <strong>and</strong> gender effects on survival in the TgN(SOD1-G93A)1Gur mouse model of <strong>ALS</strong>.<br />
J Neurol Sci 236(1‐2):1-7.<br />
Jonsson PA, Ernhill K, Andersen PM, Bergemalm D, Brannstrom T, Gredal O, Nilsson P, Marklund SK, 2004. Minute<br />
quantities of misfolded mutant superoxide dismutase-1 cause amyotrophic lateral sclerosis. Brain 127:73-88.<br />
Jonsson PA, Graffmo KS, Andersen PM, Brännström T, Lindberg M, Oliveberg M, Marklund SL. 2006a.<br />
Disulphide-reduced superoxide dismutase-1 in CNS of transgenic amyotrophic lateral sclerosis models.<br />
Brain 129(Pt 2):451-64.<br />
Jonsson PA, Graffmo KS, Brännström T, Nilsson P, Andersen PM, Marklund SL. 2006b. Motor neuron disease in<br />
mice expressing the wild type-like D90A mutant superoxide dismutase-1. J Neuropathol Exp Neurol 65(12):1126-36.<br />
Jonsson PA, Graffmo KS, Andersen PM, Brannstrom T, Lindberg M, Oliveberg M, Marklund SL. 2006c.<br />
Disulfide-reduced superoxide dismutase-I in CNS of transgenic amylotrophic lateral sclerosis models.<br />
Brain 129: 451-464.<br />
Ludolph AC, Bendotti C, Blaugrund E, Hengerer B, Loffler JP, Martin J, Meininger V, Meyer T, Moussaoui S,<br />
Robberecht W, Scott S, Silani V, Van Den Berg LH (ENMC Group For <strong>The</strong> Establishment Of Guidelines For <strong>The</strong><br />
Conduct Of Preclinical And Proof Of Concept Studies In <strong>ALS</strong>/MND Models). 2007. Guidelines for the preclinical in<br />
vivo evaluation of pharmacological active drugs for <strong>ALS</strong>/MND: Report on the 142nd ENMC international workshop.<br />
Amyotrophic Lateral Sclerosis 8: 217–223.<br />
McCrate ME, Kaspar BK. 2008. Physical activity <strong>and</strong> neuroprotection in amyotrophic lateral sclerosis.<br />
Neuromolecular Med 10(2):108-17.<br />
20<br />
<strong>Working</strong> <strong>with</strong> <strong>ALS</strong> <strong>Mice</strong>
Mahoney DJ, Rodriguez C, Devries M, Yasuda N, Tarnopolsky MA. 2004. Effects of high-intensity endurance exercise<br />
training in the G93A mouse model of amyotrophic lateral sclerosis. Muscle Nerve 29(5):656-62.<br />
Mekada K, Abe K, Murakami A, Nakamura S, Nakata H, Moriwaki K, Obata Y, Yoshiki A. 2009. Genetic differences<br />
among C57BL/6 substrains. Exp Anim 58(2): 141-9.<br />
Olsson IA, Dahlborn K. 2002. Improving housing conditions for laboratory mice: a review of ‘environmental<br />
enrichment’. Lab Anim 36:243–270.<br />
Pasinelli P, Brown RH. 2006. Molecular biology of amyotrophic lateral sclerosis: insights from genetics.<br />
Nat Rev Neurosci 7(9):710-23.<br />
Petkov PM, Cassell MA, Sargent EE, Donnelly CJ, Robinson P, Crew V, Asquith S, Haar RV, Wiles MV. 2004.<br />
An efficient SNP system for mouse genome scanning <strong>and</strong> elucidating strain relationships. Genome Res 2004<br />
14(9):1806-11.<br />
Prudencio M, Hart PJ, Borchelt DR, Andersen PM. 2009. Variation in aggregation propensities among<br />
<strong>ALS</strong>-associated variants of SOD1: correlation to human disease. Hum Mol Genet 18(17):3217-26.<br />
Ratovitski T, Corson LB, Strain J, Wong P, Clevel<strong>and</strong> DW, Culotta VC, Borchelt DR. 1999. Variation in the<br />
biochemical/biophysical properties of mutant superoxide dismutase 1 enzymes <strong>and</strong> the rate of disease progression<br />
in familial amyotrophic lateral sclerosis kindreds. Hum Mol Genet 8(8):1451-60.<br />
Rosen DR, Siddique T, Patterson D, Figlewicz DA, Sapp P, Hentati A, Donaldson D, Goto J, O’Regan JP, Deng H,<br />
Rahmani Z, Krizus A, McKenna-Yasek D, Cayabyab A, Gaston SM, Berger R, Tanzi RE, Halperin JJ, Herzfeldt B,<br />
Van den Bergh R, Hung W, Bird T, Deng G, Mulder DW, Smyth C, Laing NG, Soriano E, Pericak–Vance MA, Haines<br />
J, Rouleau GA, Gusella JS, Horvitz HR, Brown RH. 1993. Mutations in Cu/Zn superoxide dismutase gene are<br />
associated <strong>with</strong> familial amyotrophic lateral sclerosis. Nature 362(6415):59-62.<br />
Sasaki S, Nagai M, Aoki M, Komori T, Itoyama Y, Iwata M. 2007. Motor neuron disease in transgenic mice <strong>with</strong> an<br />
H46R mutant SOD1 gene. J Neuropathol Exp Neurol 66(6):517-24.<br />
Scott S, Kranz JE, Cole J, Lincecum JM, Thompson K, Kelly N, Bostrom A, <strong>The</strong>odoss J, Al-Nakhala BM, Vieira FG,<br />
Ramasubbu J, Heywood JA. 2008. Design, power, <strong>and</strong> interpretation of studies in the st<strong>and</strong>ard murine model of <strong>ALS</strong>.<br />
Amyotrophic Lateral Sclerosis 9:4–15.<br />
Ström AL, Shi P, Zhang F, Gal J, Kilty R, Hayward LJ, Zhu H. 2008. Interaction of amyotrophic lateral sclerosis<br />
(<strong>ALS</strong>)-related mutant copper-zinc superoxide dismutase <strong>with</strong> the dynein-dynactin complex contributes to inclusion<br />
formation. J Biol Chem 283(33):22795-805.<br />
Wang Q, Johnson JL, Agar NY, Agar JN. 2008. Protein aggregation <strong>and</strong> protein instability govern familial<br />
amyotrophic lateral sclerosis patient survival. PLoS Biol 6(7):e170.<br />
Wong PC, Pardo CA, Borchelt DR, Lee MK, Copel<strong>and</strong> NG, Jenkins NA, Sisodia SS, Clevel<strong>and</strong> DW, Price DL. 1995.<br />
An Adverse Property of a Familial <strong>ALS</strong>-Linked SOD1 Mutation Causes Motor Neuron Disease Characterized by<br />
Vacuolar Degeneration of Mitochondria. Neuron 14:1105-1116.<br />
Zetterstrom P, Stewart HG, Bergemalm D, Jonsson PA, Graffmo KS, Andersen PM, Brannstrom T, Oliveberg M,<br />
Marklund SL. 2007. Soluble misfolded subfractions of mutant superoxide dismutase-1 are enriched in spinal cords<br />
throughout life in murine <strong>ALS</strong> models. Proc Natl Acad Sci USA 104(35): 14157–14162.<br />
<strong>Working</strong> <strong>with</strong> <strong>ALS</strong> <strong>Mice</strong> 21
Mailing<br />
Prize4Life, Inc.<br />
14 Cambridge Center<br />
P.O. Box 425783<br />
Cambridge, MA 02142<br />
Physical<br />
Prize4Life, Inc.<br />
10 Cambridge Center<br />
Cambridge, MA 02142<br />
617-500-7527 tel<br />
www.prize4life.org<br />
<strong>The</strong> <strong>Jackson</strong> Laboratory<br />
610 Main Street<br />
Bar Harbor, Maine 04609<br />
<strong>The</strong> <strong>Jackson</strong> Laboratory—West<br />
4910 Raley Boulevard<br />
Sacramento, California 95838<br />
1-800-422-6423 or<br />
1-207-288-5845 tel<br />
1-207-288-6150 fax<br />
www.jax.org<br />
LT0011 12/02/09