4. Balance of Payments and Foreign Trade
4. Balance of Payments and Foreign Trade
4. Balance of Payments and Foreign Trade

Create successful ePaper yourself
Turn your PDF publications into a flip-book with our unique Google optimized e-Paper software.
Quarterly Monitor No. 25-26 • April–September 2011<br />
23<br />
<strong>4.</strong> <strong>Balance</strong> <strong>of</strong> <strong>Payments</strong> <strong>and</strong> <strong>Foreign</strong> <strong>Trade</strong><br />
The current account<br />
deficit is low compared<br />
to pre-crisis levels but<br />
continues to st<strong>and</strong><br />
above the long-term<br />
sustainable level…<br />
Also, the deficit<br />
is slightly higher<br />
compared to 2009 <strong>and</strong><br />
2010<br />
In Q2 <strong>and</strong> Q3 a<br />
lower current deficit<br />
compared to levels<br />
early in the year<br />
The percentage <strong>of</strong> the<br />
goods deficit in the GDP<br />
indicates that the goods<br />
deficit is at a relatively<br />
low level…<br />
In the first nine months <strong>of</strong> 2011 the current account deficit in the balance <strong>of</strong> payments<br />
stood at 2.1 billion Euro (8.5% <strong>of</strong> GDP) <strong>and</strong> registered a slight rise compared to the same<br />
period <strong>of</strong> the previous year. But, the current deficit in the GDP in Q2 <strong>and</strong> Q3 stood at less<br />
than the achieved values in Q1, primarily due to the low foreign trade deficit. Namely, the<br />
goods exchange deficit stood at 15.8% <strong>of</strong> the GDP <strong>and</strong> indicated that the goods deficit is at<br />
an extremely low level bearing in mind the value achieved following the crisis (2009: 17.7%<br />
<strong>and</strong> 2010: 16.8%) <strong>and</strong> especially prior to the crisis (2008: 26.0%). The crisis in the Eurozone<br />
<strong>and</strong> the slow recovery <strong>of</strong> domestic economic activity caused a slowing down <strong>of</strong> the growth <strong>of</strong><br />
exports <strong>and</strong> imports which in Q2 <strong>and</strong> Q3 2011 account for a lower percentage <strong>of</strong> the GDP<br />
than in the same period <strong>of</strong> 2010. Exports <strong>and</strong> imports in the first three quarters registered a<br />
positive growth rate but – y-o-y growth has dropped from quarter to quarter. Also, negative<br />
tendencies have appeared in terms <strong>of</strong> structure <strong>of</strong> imports – an evident slowing <strong>of</strong> the growth<br />
<strong>of</strong> intermediary <strong>and</strong> capital goods – which just reflects the current problems in economic<br />
activity <strong>and</strong> does not indicate any significant improvement in the medium term. Since the<br />
start <strong>of</strong> the year, the percentage <strong>of</strong> the current transfers <strong>and</strong> remittances in the GDP is also<br />
below the levels <strong>of</strong> 2009 <strong>and</strong> 2010 although it is still at a relatively high level compared to the<br />
values prior to the crisis. That drop in the percentage can be explained with the very high<br />
base, that is an unusually high inflow <strong>of</strong> current transfers (including remittances) over the<br />
past two years <strong>and</strong> the current economic problems in Europe which could have a significant<br />
effect on the future inflow <strong>of</strong> funds on that basis. A substantial inflow <strong>of</strong> capital on the basis<br />
<strong>of</strong> direct <strong>and</strong> portfolio investments has been achieved. The public sector is significantly in<br />
debt while the registered outflow <strong>of</strong> capital due to companies repaying long-term <strong>and</strong> banks<br />
repaying short-term loans. <strong>Foreign</strong> transactions resulted in a significant growth <strong>of</strong> foreign<br />
currency reserves in the period which at the end <strong>of</strong> September stood 1.3 billion Euro higher<br />
than at the end <strong>of</strong> 2010.<br />
The cumulative value <strong>of</strong> the current account deficit in the balance <strong>of</strong> payments in the first three<br />
quarters stood at 2,059 billion Euro which is 8.5% <strong>of</strong> the value <strong>of</strong> the achieved GDP in this period.<br />
This deficit is still very low compared to its pre-crisis levels (2007: 17.7%, 2008: 21.6%), <strong>and</strong> is<br />
just 1.3 <strong>and</strong> 1.2 percentage points <strong>of</strong> the GDP above the levels <strong>of</strong> 2009 <strong>and</strong> 2010. The relatively<br />
low value <strong>of</strong> the current deficit compared to the values prior to the crisis could be explained with<br />
the relatively low level <strong>of</strong> foreign trade – the slowing down <strong>of</strong> the growth <strong>of</strong> exports <strong>and</strong> imports<br />
(caused primarily by a drop in dem<strong>and</strong> in the countries caught up in the new wave <strong>of</strong> the crisis<br />
<strong>and</strong> the slow recovery <strong>of</strong> domestic production) 1 <strong>and</strong> lower inflow <strong>of</strong> current transfers.<br />
In Q2 2011 the current account deficit in the balance <strong>of</strong> payments stood at 621 million Euro<br />
(7.3% <strong>of</strong> the GDP) <strong>and</strong> is absolutely <strong>and</strong> relatively 2 below the level <strong>of</strong> Q1 when it stood at 761<br />
million Euro (10.4% <strong>of</strong> GDP). However, in Q3 the current deficit is recording a slight rise<br />
compared to Q2 values <strong>and</strong> st<strong>and</strong>s at 677 million Euro (8.1% <strong>of</strong> the GDP, Table T4-1). Viewed<br />
on the basis <strong>of</strong> y-o-y, the current deficit in Q2 is lower by 1.2 percentage points <strong>of</strong> the GDP<br />
compared to Q2 2010 while in Q3 it is approximately 1 percentage point <strong>of</strong> the GDP above the<br />
deficit in Q3 2010.<br />
The percentage <strong>of</strong> the goods deficit in the GDP in the first nine months st<strong>and</strong>s at 15.8% <strong>and</strong><br />
shows that the goods deficit is at a relatively low level bearing in mind the values achieved after<br />
the crisis (2009: 17.7% <strong>and</strong> 2010: 16.8%) <strong>and</strong> especially prior to the crisis (2008: 26.0%). Still,<br />
viewed in absolute terms, in the first three quarters the goods deficit is recording a slight rise<br />
compared to the same period <strong>of</strong> the previous year <strong>and</strong> st<strong>and</strong>s at 3.8 billion Euro. If we look at<br />
quarterly values, the goods exchange deficit in Q2 <strong>of</strong> 1,230 million Euro (1<strong>4.</strong>5% <strong>of</strong> GDP) <strong>and</strong><br />
in Q3 <strong>of</strong> 1,265 million Euro (15.1% <strong>of</strong> GDP) is lower than the deficit in Q1 <strong>of</strong> the current year<br />
Trends<br />
1 The latest seasonally adjusted data indicates a stagnation <strong>and</strong> slight drop in economic activity in the second <strong>and</strong> third quarter.<br />
2 Compared to the appropriate quarterly value <strong>of</strong> the GDP in Euro.
24 <strong>4.</strong> <strong>Balance</strong> <strong>of</strong> <strong>Payments</strong> <strong>and</strong> <strong>Foreign</strong> <strong>Trade</strong><br />
Trends<br />
The drop in the<br />
percentage <strong>of</strong><br />
exports <strong>and</strong> the<br />
pronounced drop<br />
in the percentage<br />
<strong>of</strong> imports in Q2<br />
<strong>and</strong> Q3 compared<br />
to the same<br />
quarters <strong>of</strong> 2010<br />
Percentage <strong>of</strong><br />
remittances in GDP<br />
lower compared<br />
to 2010 but still at<br />
high level<br />
(1,315 million Euro, that is 18.0% <strong>of</strong> GDP). Also, the goods deficit in Q2 <strong>and</strong> Q3 is about 2<br />
percentage points <strong>of</strong> the GDP lower compared to the values in the same quarters <strong>of</strong> the previous<br />
year (Table T4-1). The growth <strong>of</strong> both imports <strong>and</strong> exports is slowing <strong>and</strong> in 2011 they account<br />
for a lower percentage <strong>of</strong> the GDP than in 2010. Exports in Q2 <strong>and</strong> Q3 is about half a percentage<br />
point <strong>of</strong> the GDP lower than y-o-y while the drop in imports is even more pronounced by about<br />
2.5 percentage points <strong>of</strong> the GDP (Table T4-1).<br />
In the first nine months the inflow <strong>of</strong> current transfers stood at 9.3% <strong>of</strong> the GDP, including<br />
remittances which account for 6.6% <strong>of</strong> the GDP. That level <strong>of</strong> current transfers <strong>and</strong> remittances,<br />
even though undergoing a visible drop compared to 2010 <strong>and</strong> 2009, is still more significant than<br />
the level prior to the crisis (2008: current transfers 7.8% <strong>of</strong> GDP, remittances 5.2% <strong>of</strong> GDP, Table<br />
T4-1). The lowering <strong>of</strong> the percentage <strong>of</strong> the inflow <strong>of</strong> funds compared to the previous two years<br />
can, on one h<strong>and</strong>, be explained with the very high base, that is a very high current transfer level<br />
(including remittances) in 2009 <strong>and</strong> 2010 while, on the other h<strong>and</strong>, current economic problems<br />
in Europe, due to the growth <strong>of</strong> unemployment, can be reflected in a lower future inflow <strong>of</strong> funds<br />
on that basis. If we look at quarterly values, we can see that there was a significant drop in Q3<br />
following the slight drop in current transfers <strong>and</strong> remittances in the GDP in Q2 2011.<br />
Table T4-1. Serbia: <strong>Balance</strong> <strong>of</strong> <strong>Payments</strong><br />
2010 2011<br />
2008 2009 2010 Q1 Q2 Q3 Q4 Q1 Q2 Q3<br />
in millions <strong>of</strong> euros<br />
CURRENT ACCOUNT -7,054 -2,084 -2,082 -760 -615 -519 -189 -761 -621 -677<br />
Goods -8,501 -5,118 -4,773 -1,186 -1,171 -1,244 -1,173 -1,315 -1,230 -1,265<br />
Export f.o.b1 7,416 5,978 7,403 1,473 1,861 1,938 2,130 1,955 2,163 2,169<br />
Import f.o.b -15,917 -11,096 -12,176 -2,659 -3,032 -3,182 -3,303 -3,270 -3,392 -3,434<br />
Services -185 18 5 -19 5 -1 20 28 12 12<br />
Export 2,741 2,500 2,667 537 635 737 758 631 720 816<br />
Import -2,926 -2,482 -2,662 -555 -629 -739 -738 -604 -708 -803<br />
Income, net -922 -502 -670 -167 -205 -127 -171 -112 -252 -195<br />
Receipts 558 500 438 107 108 92 131 101 100 101<br />
<strong>Payments</strong> -1,480 -1,002 -1,108 -273 -313 -219 -302 -214 -352 -296<br />
Current transfers, net 2,554 3,518 3,356 611 755 854 1,136 638 849 771<br />
o/w grants 163 197 193 29 20 35 109 49 41 39<br />
o/w private remittances, net 1,692 2,618 2,383 415 543 610 815 450 596 546<br />
CAPITAL ACCOUNT 13 2 1 0 0 1 0 -1 0 -1<br />
FINANCIAL ACCOUNT 7,133 2,207 2,032 698 596 488 241 616 578 527<br />
Direct investment, net 1,824 1,372 860 284 136 176 265 307 259 661<br />
Portfolio investment, net -91 -51 39 38 35 4 -38 520 246 871<br />
Other investments 3,713 3,249 204 10 104 -6 87 -43 105 73<br />
<strong>Trade</strong> credits 957 654 92 -109 125 249 -182 188 174 153<br />
Loans 3,499 1,414 830 523 -270 93 483 -879 34 226<br />
NBS 0 1,114 341 0 237 50 54 -4 52 -3<br />
Government 98 258 735 167 198 315 55 29 275 297<br />
Commercial banks 125 894 626 525 -396 -123 619 -691 -132 -10<br />
Long-term -274 492 619 558 -6 33 34 3 10 99<br />
Short-term 399 402 6 -32 -390 -156 585 -694 -142 -109<br />
Other (enterprises) 3,275 -853 -872 -170 -309 -148 -246 -214 -160 -58<br />
Currency <strong>and</strong> deposits -713 760 -717 -405 249 -348 -213 648 -104 -306<br />
Other assets <strong>and</strong> liabilities -30 0 0 0 0 0 0 0 0 0<br />
Allocation <strong>of</strong> SDR 0 422 0 0 0 0 0 0 0 0<br />
Reserves Assets (- increase) 1,687 -2,363 929 367 321 313 -73 -168 -33 -1,078<br />
ERRORS AND OMISSIONS, net -92 -124 49 62 19 31 -53 147 43 151<br />
OVERALL BALANCE -1,687 2,363 -929 -367 -321 -313 73 168 33 1,078<br />
PRO MEMORIA<br />
in % <strong>of</strong> GDP<br />
Current account -21.6 -7.2 -7.3 -11.5 -8.6 -7.1 -2.6 -10.4 -7.3 -8.1<br />
<strong>Balance</strong> <strong>of</strong> goods -26.0 -17.7 -16.8 -18.0 -16.3 -17.1 -16.0 -18.0 -1<strong>4.</strong>5 -15.1<br />
Exports <strong>of</strong> goods 22.7 20.7 26.1 22.4 25.9 26.7 29.0 26.8 25.5 25.9<br />
Imports <strong>of</strong> goods -48.7 -38.4 -42.9 -40.4 -42.3 -43.8 -45.0 -4<strong>4.</strong>8 -40.0 -41.0<br />
<strong>Balance</strong> <strong>of</strong> goods <strong>and</strong> services -26.6 -17.7 -16.8 -18.3 -16.2 -17.1 -15.7 -17.6 -1<strong>4.</strong>4 -1<strong>4.</strong>9<br />
Current transfers, net 7.8 12.2 11.8 9.3 10.5 11.7 15.5 8.7 10.0 9.2<br />
GDP in euros 2) 32,690 28,893 28,377 6,589 7,176 7,274 7,338 7,304 8,474 8,379<br />
Source: NBS<br />
1) Exports f.o.b, based on NBS methodology adjusted to IMF BOPM-5.<br />
2) Quarterly values. Annual GDP converted into euros using the average annual exchange rate (average <strong>of</strong> <strong>of</strong>ficial NBS daily mid rates).<br />
In the first two quarters <strong>of</strong> 2011, the current account deficit is at the level <strong>of</strong> last year’s value for<br />
that period. In Q3, there was a y-o-y growth in its value by 30%. The goods deficit was above last<br />
year’s by 5% in Q2, <strong>and</strong> by 1.7% in Q3. In Q2, imports <strong>and</strong> exports recorded a y-o-y growth <strong>of</strong><br />
16.2%, that is 11.9%, <strong>and</strong> in Q3 registered a slight slowing <strong>of</strong> growth (achieved y-o-y rate 11.9%
Quarterly Monitor No. 25-26 • April–September 2011<br />
25<br />
Significant Capital<br />
Influx Registered<br />
...mainly on basis<br />
<strong>of</strong> FDI <strong>and</strong> portfolio<br />
investments<br />
Intensive debt payment<br />
by banks <strong>and</strong> the<br />
enterprises in this<br />
period <strong>and</strong> debts taken<br />
by state<br />
<strong>and</strong> 7.9%, respectively). After the y-o-y growth in the value <strong>of</strong> current transfers <strong>and</strong> remittances<br />
in Q2 (12.4% <strong>and</strong> 9.8%, respectively), Q3 saw a y-o-y drop <strong>of</strong> 9.7% <strong>and</strong> 10.4%, respectively<br />
(Table T4-1).<br />
A significant inflow <strong>of</strong> capital was registered in Q2 2011 <strong>of</strong> 610 million Euro 3 , <strong>and</strong> in Q3<br />
<strong>of</strong> 1,605 million Euro 4 (Table T4-1). The cumulative growth <strong>of</strong> foreign currency reserves<br />
from the start <strong>of</strong> the year st<strong>and</strong>s at 1,278 million Euro (including 1,078 growth in Q3).<br />
A significant growth <strong>of</strong> foreign currency reserves in that period came in February (196<br />
million Euro) 5 , in April (113 million Euro) 6 , in July (296 million Euro 7 , <strong>and</strong> the greatest<br />
increase <strong>of</strong> the foreign currency reserves was registered in September (831.3 million<br />
Euro) 8 .<br />
The net inflow <strong>of</strong> FDI is very high <strong>and</strong> in the first three quarters <strong>of</strong> this year it stood at 1,227<br />
million Euro. Most <strong>of</strong> the foreign investments accounted for the Q3 inflow <strong>of</strong> 661 million Euro<br />
(including 420 million in July thanks to the sale <strong>of</strong> the Delta Maxi company). Net FDI in<br />
Q2 amounted to €306.6mn, the bulk <strong>of</strong> which arrived in April (113 million Euro) 9 . Also, a<br />
significant part <strong>of</strong> the net inflow from portfolio investments was achieved in Q2 <strong>and</strong> Q3 <strong>of</strong> 1,117<br />
million Euro (including 871 million Euro in Q3 from the sale <strong>of</strong> Eurobonds <strong>of</strong> the Republic <strong>of</strong><br />
Serbia see Table T4-1) 10 . A very high inflow <strong>of</strong> portfolio investments in Q2 <strong>and</strong> Q3 with a high<br />
inflow in Q1 (cumulatively 1,637 million Euro in these three quarters) is not in accord with the<br />
very low, <strong>and</strong> even negative inflow registered in earlier years (Table T4-1), <strong>and</strong> certainly are not<br />
in accord with the current economic uncertainty in Europe <strong>and</strong> the world.<br />
Due to intensive payment <strong>of</strong> debts by banks <strong>and</strong> the enterprises in this period, in addition to<br />
goverment borrowing, on the account “Loans” was registered a low net inflow in Q2 <strong>of</strong> 34 million<br />
euros, followed by higher inflow in Q3 (226 million euros). The government took loans <strong>of</strong> 275<br />
million Euro 11 in Q2 <strong>and</strong> an additional 297 million Euro in Q3 12 . Banks paid <strong>of</strong>f their debts totaling<br />
833 million Euro since the start <strong>of</strong> the year (with 945 million Euro realized on the basis <strong>of</strong> shot-term<br />
loans). Also, a net repayment <strong>of</strong> debts by the enterprises <strong>of</strong> 432 million Euro was registered in the<br />
first nine months solely on the basis <strong>of</strong> long-term loans. The repayment <strong>of</strong> debts by the enterprises is<br />
probably the consequence <strong>of</strong> the inability to refinance loans fallen due which additionally contributes<br />
to its financial exhausting. Following the high inflow in Q1, an outflow on the account “Currency <strong>and</strong><br />
Deposits” was registered in Q2 <strong>and</strong> Q3 <strong>of</strong> 104 million Euro, that is 306 million Euro (Table T4-1).<br />
Trends<br />
Overall foreign debt is<br />
23,860 million Euro or<br />
72.5% <strong>of</strong> GDP<br />
<strong>Foreign</strong> Debt<br />
The overall foreign debt at the end <strong>of</strong> September 2011 stood at 23,860 million Euro (Table T4-2).<br />
Although the foreign debt registered a modest cumulative growth compared to the end <strong>of</strong> 2010 <strong>of</strong><br />
73.9 million Euro, it was the result <strong>of</strong> a significant drop in the value <strong>of</strong> the foreign debt in the first<br />
three months (1,11<strong>4.</strong>5 million Euro) <strong>and</strong> a slight rise during Q2 (62.5 million Euro) <strong>and</strong> a high<br />
rise during Q3 by 1,126.0 million Euro. The speed <strong>of</strong> that trend in foreign debt since the start <strong>of</strong><br />
the year is due to the drop in private foreign debts (which were pronounced to a great extent in<br />
Q1) on the one h<strong>and</strong> <strong>and</strong> higher debts by the public sector (most pronounced in Q3) on the other.<br />
The unfavorable trend in foreign debts – where the repayment <strong>of</strong> debts by the private sector was<br />
compensated by the debts by the public sector – led to the foreign debt st<strong>and</strong>ing at 44% <strong>and</strong> the<br />
3 653 million Euro when corrected for the balance <strong>of</strong> Errors <strong>and</strong> Omissions.<br />
4 1,756 million Euro when corrected for the balance <strong>of</strong> Errors <strong>and</strong> Omissions.<br />
5 When inflow was achieved from the sale <strong>of</strong> government securities worth 288.6 million Euro, see QM2<strong>4.</strong><br />
6 When the final installment <strong>of</strong> 51.7 million Euro <strong>of</strong> the st<strong>and</strong>by arrangement with the IMF was drawn.<br />
7 Mainly through the issue <strong>of</strong> government secutities worth 138.4 million Euro <strong>and</strong> 127.5 million Euro through loans, see http://www.<br />
nbs.rs/internet/cirilica/scripts/showContent.html?id=5175&konverzija=no.<br />
8 An inflow <strong>of</strong> 72<strong>4.</strong>3 million Euro based on the sale <strong>of</strong> Eurobonds see http://www.nbs.rs/internet/cirilica/scripts/showContent.<br />
html?id=5287&konverzija=no.<br />
9 Investments in the processing industry (iron <strong>and</strong> steel production, textile, food products <strong>and</strong> beverages <strong>and</strong> non-metal minerals),<br />
trade <strong>and</strong> financial sector, see. Inflation Report, August 2011, p 17.<br />
10 See footnote 8.<br />
11 The Societe Generale bank approved a loan to the state <strong>of</strong> 270 million Euro in April. A loan was taken with World Bank guarantees to<br />
finance the budget deficit <strong>and</strong> refinance debts, see Inflation Report August 2011, p 17.<br />
12 Of which 280 million were in July.
26 <strong>4.</strong> <strong>Balance</strong> <strong>of</strong> <strong>Payments</strong> <strong>and</strong> <strong>Foreign</strong> <strong>Trade</strong><br />
Trends<br />
Drop in private<br />
foreign debt<br />
accompanied by<br />
public sector debts<br />
private at 56% <strong>of</strong> the overall foreign debt unlike the start <strong>of</strong> the year when the public foreign debt<br />
stood at 38% <strong>and</strong> the private sector debt at 62% <strong>of</strong> the overall foreign debt. The favorable trend is to<br />
reduce the short term debt thanks to a drop in the short term indebtedness <strong>of</strong> banks.<br />
The public sector foreign debt stood at 10,433 million Euro <strong>and</strong> accounts for 31.7% <strong>of</strong> the GDP.<br />
Compared to the country’s foreign debt nine months earlier, a rise has been recorded <strong>of</strong> 1,357<br />
million Euro (or 1.1 percentage points). Take into account the fact that the public sector lowered<br />
its foreign debt during the first quarter <strong>of</strong> 2011 by about 200 million Euro <strong>and</strong> the growth <strong>of</strong> the<br />
debt compared to the end <strong>of</strong> March is close to 1.6 billion Euro, <strong>of</strong> which 1.3 billion Euro are debts<br />
in Q3. Namely, 934 million Euro is the rise <strong>of</strong> the foreign debt <strong>of</strong> the public sector in September,<br />
predominantly caused by the sale <strong>of</strong> state Eurobonds on the foreign financial market. 13<br />
On the other h<strong>and</strong>, the private sector significantly lowered its debt. Compared to the situation<br />
with the private debt at the end <strong>of</strong> 2010, a drop in debts <strong>of</strong> 1,283.1 million Euro was registered<br />
(from 1<strong>4.</strong>71 to 13.43 billion Euro, Table T4-2). The greatest repayment <strong>of</strong> debts was registered<br />
in Q1 (some 900 million Euro). The long-term debt <strong>of</strong> the private sector was reduced by about<br />
300 million Euro in the first nine months <strong>of</strong> 2011, with the banks taking about an additional<br />
200 million Euro in loans while companies repaid a net half a billion Euro (330 million Euro in<br />
Q2 <strong>and</strong> Q3). Compared to the situation in late 2010, the short-term bank <strong>and</strong> enterprises dues<br />
were reduced by about one billion Euro (with the banks lowering their short-term loan debts by<br />
about 950 million Euro, especially in the first three months <strong>of</strong> 2011, Table T4-2).<br />
Table T4-2. Serbia: <strong>Foreign</strong> Debt by Structure, 2008–2011<br />
2010 2011<br />
The pronounced drop<br />
in foreign debt in the<br />
GDP is primarily the<br />
consequence <strong>of</strong> a<br />
drop in the debt <strong>of</strong> the<br />
private sector <strong>and</strong> the<br />
high appreciation <strong>of</strong><br />
the Dinar in real terms<br />
which is about 9% from<br />
the start <strong>of</strong> the year to<br />
September<br />
2008 2009<br />
Mar Jun Sep Dec Mar Jun Sep<br />
stocks, in EUR millions, end <strong>of</strong> the period<br />
Total foreign debt 21,088 22,487 22,943 23,456 23,115 23,786 22,672 22,734 23,860<br />
(in % <strong>of</strong> GDP) 2) 71.6 75.2 78.1 81.7 80.1 80.2 73.5 71.4 72.5<br />
Public debt 6,521 7,764 8,122 8,921 8,874 9,076 8,861 9,138 10,433<br />
(in % <strong>of</strong> GDP) 2) 22.1 26.0 27.6 31.1 30.8 30.6 28.7 28.7 31.7<br />
Long term 6,503 7,762 8,122 8,921 8,874 9,076 8,861 9,138 10,433<br />
o/w: to IMF 0 1,110 1,157 1,483 1,455 1,529 1,475 1,506 1,582<br />
o/w: Government obligation<br />
under IMF SDR allocation 0 422 440 469 444 449 434 428 449<br />
Short term 18 1 0 0 0 0 0 0 0<br />
Private debt 14,568 14,724 14,820 14,535 14,241 14,710 13,811 13,597 13,427<br />
(in % <strong>of</strong> GDP) 2) 49.5 49.2 50.4 50.6 49.4 49.6 4<strong>4.</strong>8 42.7 40.8<br />
Long term 12,442 12,720 12,919 13,076 12,945 12,880 12,696 12,630 12,569<br />
o/w: Banks debt 2,201 2,597 2,867 3,195 3,279 3,362 3,347 3,413 3,551<br />
o/w: Enterprises debt 10,241 10,123 10,052 9,881 9,667 9,518 9,348 9,217 9,018<br />
Short term 2,126 2,003 1,901 1,459 1,295 1,830 1,116 966 858<br />
o/w: Banks debt 1,323 1,713 1,691 1,304 1,146 1,731 1,036 895 785<br />
o/w: Enterprises debt 803 290 210 155 149 100 79 72 73<br />
<strong>Foreign</strong> debt, net 1) , (in% <strong>of</strong> GDP) 2) 43.9 39.8 42.5 45.1 45.9 46.5 41.3 40.1 38.0<br />
Note: Since September 2010 methodology for the external debt statistics has been changed so that the external public debt includes obligations under the<br />
IMF SDR allocation (443.5 million Euro), which was used in December 2009, as well as capitalized interest to Paris Club creditors (86.4 million Euro), while the<br />
loans concluded before December 20, 2000, under which the payments have not been effected, are excluded from the external debt <strong>of</strong> the private sector<br />
(875.4 million Euro <strong>of</strong> which 397 million Euro relate to domestic banks <strong>and</strong> 478.4 million Euro to domestic enterprises). <strong>Foreign</strong> debt data provided in the Table<br />
follow the new methodology.<br />
Source: NBS, QM<br />
1) Total foreign debt less NBS currency reserves.<br />
2) The values used are seasonally- <strong>and</strong> cyclically-adjusted quarterly GDP figures, multiplied by four.<br />
If we look at the participation <strong>of</strong> the foreign debt in the GDP, there is an evident great drop<br />
compared to the end <strong>of</strong> the previous year. Compared to the end <strong>of</strong> December 2011 when the<br />
foreign debt accounted for 80.2% <strong>of</strong> the GDP, the participation <strong>of</strong> the foreign debt in the GDP<br />
is 7.7 percentage points lower <strong>and</strong> st<strong>and</strong>s at 72.5% 14 . The pronounced participation drop is<br />
the consequence <strong>of</strong> the drop in private sector debts <strong>and</strong> the accounting effect (the high real<br />
appreciation <strong>of</strong> the Dinar against the Euro from the start <strong>of</strong> the year to September is about 9%).<br />
The participation <strong>of</strong> the private sector foreign debt is 8.8 percentage points <strong>of</strong> the GDP lower<br />
(from 49.6% to 40.8% <strong>of</strong> the GDP). The reduction <strong>of</strong> the debts based on long-term loans to the<br />
13 Serbia in September sold 10 year Eurobonds worth one billion Dollars with an annual interest rate <strong>of</strong> 7.25%.<br />
14 QM assessment.
Quarterly Monitor No. 25-26 • April–September 2011<br />
27<br />
Slowing <strong>of</strong> exports<br />
growth...<br />
...<strong>and</strong> its components...<br />
...primarily bulky<br />
exports....<br />
…due to a significant<br />
deceleration <strong>of</strong> exports<br />
<strong>of</strong> non-ferrous metals ...<br />
…<strong>and</strong> the y-o-y drop<br />
in exports <strong>of</strong><br />
iron <strong>and</strong> steel<br />
private sector is 5.2 percentage points <strong>of</strong> the GDP with the majority being the repayment <strong>of</strong><br />
debts by enterprises. The reduction <strong>of</strong> the short-term debts by 3.6 percentage points <strong>of</strong> the GDP<br />
since the start <strong>of</strong> the year is almost entirely owed to banks. The public sector debt increased its<br />
participation in the GDP by 1.1 percentage point. If the same denominator had been used as for<br />
the calculation <strong>of</strong> the participation at the end <strong>of</strong> 2010 to calculate the value <strong>of</strong> the debt in the<br />
GDP, the reduction <strong>of</strong> the overall debt would be just three percentage points <strong>of</strong> the GDP (the<br />
overall foreign debt would be 77.1% <strong>of</strong> the GDP) with the reduction <strong>of</strong> the private sector foreign<br />
debt st<strong>and</strong>ing at 6.2 percentage points <strong>of</strong> the GDP <strong>and</strong> the growth <strong>of</strong> the participation <strong>of</strong> the<br />
public sector debt 3.0 percentage points <strong>of</strong> the GDP.<br />
Exports<br />
Viewed from the start <strong>of</strong> the year, exports have significantly slowed in growth (Table T4-3).<br />
Following the high y-o-y growth in Q1 <strong>of</strong> 33.7%, exports recorded a significant slowing in Q2<br />
(1<strong>4.</strong>5% y-o-y), to st<strong>and</strong> in Q3 at just 11.7% over the value in Q3 2010. The crisis in the Eurozone<br />
primarily led to weak exports results in Q2 <strong>and</strong> Q3, both directly because <strong>of</strong> the fact that the<br />
countries <strong>of</strong> the Eurozone are the most important export area for Serbia 15 <strong>and</strong> indirectly due to<br />
the drop in prices <strong>of</strong> metals, food <strong>and</strong> other products which account for a large part <strong>of</strong> domestic<br />
exports on the world market.<br />
In the past period, domestic exports <strong>and</strong> the foreign trade balance were influenced negatively<br />
by the drop in dem<strong>and</strong> in the world – because <strong>of</strong> the crisis <strong>and</strong> real appreciation <strong>of</strong> the Dinar<br />
(because <strong>of</strong> which domestic goods became relatively more expensive). This is a significantly<br />
unfavorable situation compared to the first wave <strong>of</strong> the crisis when the drop in dem<strong>and</strong> in the<br />
world was neutralized by a real depreciation <strong>of</strong> the Dinar.<br />
During the monitored six month period (Q2 <strong>and</strong> Q3) bulky <strong>and</strong> underlying exports (<strong>and</strong> within that<br />
the core group) registered a lower growth rate (Table T4-3) compared to Q1 2011. The deceleration<br />
was present in the Bulky Exports component due to the y-o-y drop in exports <strong>of</strong> iron <strong>and</strong> steel<br />
<strong>and</strong> a significant slowing <strong>of</strong> the exports <strong>of</strong> non-ferrous metals. Also, the export <strong>of</strong> cereal <strong>and</strong> cereal<br />
products contributed to that rate <strong>of</strong> the bulky exports, bearing in mind the slow growth <strong>of</strong> exports<br />
<strong>of</strong> those products in Q2 (when there was a ban on their exports which lasted through most <strong>of</strong><br />
Q2 16 ), which continued into Q3 despite the lifting <strong>of</strong> the ban. The export <strong>of</strong> fruits <strong>and</strong> vegetables<br />
slowed down in Q2 <strong>and</strong> slightly speeded up in Q3.<br />
The y-o-y rise in the export <strong>of</strong> non-ferrous metals stood at 3<strong>4.</strong>9% in Q2 <strong>and</strong> at 3.7% in Q3. The<br />
prices <strong>of</strong> metals on the world market in Q2 <strong>and</strong> Q3 – although registering drops compared to<br />
the start <strong>of</strong> the year – continued to st<strong>and</strong> above last year’s values monitored at quarterly level. The<br />
prices <strong>of</strong> metals in Euro in Q2 stood at 6.4% (20.4% in Dollars 17 ) <strong>and</strong> in Q3 at 10.1% (20.7% in<br />
Dollars) over the average prices in the appropriate quarters <strong>of</strong> 2010. The exported quantities <strong>of</strong><br />
metals in Q2 were 26.8% over <strong>and</strong> in Q3 by 5.8% below the appropriate quarterly values <strong>of</strong> 2010.<br />
An unfavorable circumstance is that the prices <strong>of</strong> metals on the world market are continuing to<br />
drop <strong>and</strong> in October they were 7.1% below the prices <strong>of</strong> October the previous year <strong>and</strong> 10% below<br />
prices in September <strong>and</strong> 20% below prices in Q1 <strong>of</strong> the current year (monitored in Dollars).<br />
The trend <strong>of</strong> a quick recovery <strong>of</strong> the exports <strong>of</strong> iron <strong>and</strong> steel after the crisis <strong>and</strong> at the start <strong>of</strong> the<br />
current year was completely stopped <strong>and</strong> turned around in Q2 <strong>and</strong> Q3. Namely, the export <strong>of</strong><br />
iron <strong>and</strong> steel in the second <strong>and</strong> third quarter <strong>of</strong> 2011 saw a drop compared to the same period <strong>of</strong><br />
the previous year (<strong>4.</strong>8% <strong>and</strong> about 19.4% respectively). The downward trend in the export <strong>of</strong> those<br />
products – which make up one tenth <strong>of</strong> overall domestic exports – is the result <strong>of</strong> unfavorable<br />
circumstances on the world market in regard to those products. Primarily, the grave economic<br />
situation in Europe <strong>and</strong> the drop in dem<strong>and</strong> caused a drop in the dem<strong>and</strong> for those products <strong>and</strong><br />
consequently a drop in prices. That led to lower domestic production <strong>and</strong> one <strong>of</strong> the furnaces at<br />
Trends<br />
15 57.3% <strong>of</strong> the overall value <strong>of</strong> exports in 2010 were to the EU. Italy was the country to which the most domestic products were<br />
exported in 2010 <strong>and</strong> accounted for 11.5% <strong>of</strong> overall exports.<br />
16 From mid-March to mid-June.<br />
17 Due to the depreciation <strong>of</strong> the Dollar against the Euro in this period.
28 <strong>4.</strong> <strong>Balance</strong> <strong>of</strong> <strong>Payments</strong> <strong>and</strong> <strong>Foreign</strong> <strong>Trade</strong><br />
Trends<br />
Lower y-o-y growth<br />
rates <strong>of</strong> underlying<br />
exports in Q2<br />
<strong>and</strong> Q3 compared<br />
to start <strong>of</strong> year<br />
the US Steel Serbia company was idled which caused further unfavorable results in the company<br />
which is also the biggest domestic exporter. If there is no significant change on the world market,<br />
that blast furnace will remain on idle in Q4 which will have a significant unfavorable effect on<br />
the value <strong>of</strong> exports <strong>of</strong> iron <strong>and</strong> steel <strong>and</strong> overall exports in the last quarter <strong>and</strong> in all <strong>of</strong> 2011.<br />
Underlying exports are also registering lower y-o-y growth rates in Q2 <strong>and</strong> Q3 compared to the<br />
start <strong>of</strong> the year (Table T4-3). Within the underlying exports the core group component significantly<br />
decelerates growth from quarter to quarter (y-o-y rates: Q1 31.7%, Q2 21.3% <strong>and</strong> July-August<br />
15.4%). The y-o-y growth rate <strong>of</strong> products in the group other showed a slight growth in Q3 (Table<br />
T4-3) following a slowing down in Q2 compared to Q1. The achieved growth <strong>of</strong> the export <strong>of</strong><br />
other is modest <strong>and</strong> insufficient from the point <strong>of</strong> view <strong>of</strong> overall exports, since that group <strong>of</strong><br />
products makes up 43% <strong>of</strong> overall exports in 2010.<br />
Table T4-3. Serbia: Exports, Y-o-y Growth Rates, 2010–2011<br />
Exports share<br />
in 2010<br />
2011 1) 2010 1) 2011 1)<br />
Q1 Q2 Q3 Q1 Q2 Q3 Q1 Q2 Q3<br />
in % mil.euros y-o-y growth rate (%)<br />
Total 100.0 1,961 2,157 2,157 1<strong>4.</strong>9 23.2 2<strong>4.</strong>6 33.7 1<strong>4.</strong>5 11.7<br />
Bulky exports 28.1 649 574 566 42.3 41.6 39.3 53.9 15.7 5.5<br />
Iron <strong>and</strong> steel 9.8 239 186 147 60.2 130.4 39.0 47.4 -<strong>4.</strong>8 -19.4<br />
Non ferrous metals 7.1 164 178 158 68.3 75.0 69.3 50.5 3<strong>4.</strong>9 3.7<br />
Fruits <strong>and</strong> vegetables 5.4 92 92 147 21.6 -<strong>4.</strong>8 16.2 22.4 15.4 29.0<br />
Cereal <strong>and</strong> cereal products 5.9 154 117 114 10.0 -16.6 33.7 10<strong>4.</strong>1 32.4 29.5<br />
Underlying exports 71.9 1,312 1,583 1,591 6.7 17.8 19.7 25.5 1<strong>4.</strong>0 1<strong>4.</strong>1<br />
Core 28.8 577 632 673 2.1 11.8 32.1 31.7 21.3 15.4<br />
Clothes <strong>4.</strong>1 82 80 96 -37.7 -36.4 2.2 13.5 15.3 18.2<br />
Miscellaneous manufactured articles, n.e.s. 3.5 60 74 77 -5.8 6.3 9.5 27.2 13.6 5.6<br />
Manufactures <strong>of</strong> metals, n.e.s. 3.5 68 97 100 -8.0 2.2 9.2 52.6 45.6 47.0<br />
Rubber products 2.9 76 65 65 23.6 33.6 27.0 40.0 25.9 18.4<br />
Electrical machinery, apparatus <strong>and</strong> appliances 6.0 124 134 141 25.5 46.8 58.7 58.9 2<strong>4.</strong>1 15.7<br />
Organic chemicals 1.4 12 12 11 261.5 357.9 501.2 -58.7 -56.3 -61.3<br />
Plastics in primary forms 1.8 43 42 41 47.1 69.9 753.8 48.5 30.7 10.4<br />
Footwear 2.1 51 45 55 0.8 2.4 1<strong>4.</strong>8 35.0 3<strong>4.</strong>7 23.1<br />
Paper, paperboard <strong>and</strong> articles <strong>of</strong> paper pulp 2.2 45 52 50 12.1 11.4 11.4 26.5 25.4 2<strong>4.</strong>6<br />
Non-metal mineral produce 1.3 17 32 38 -9.4 12.2 17.9 47.2 17.1 8.7<br />
Other 43.0 735 951 918 10.2 21.7 12.1 21.0 9.7 13.1<br />
Source: SORS<br />
1) Figures that are in millions <strong>of</strong> euros <strong>and</strong> y-o-y growth rates were obtained based on the data from Statistical Office <strong>of</strong> the Republic <strong>of</strong> Serbia calculated<br />
using new methodology. For details see QM 20, “Changes to foreign trade methodology used by the Statistical Office <strong>of</strong> the Republic <strong>of</strong> Serbia”.<br />
Seasonally-adjusted<br />
values confirmed that<br />
the deceleration <strong>of</strong><br />
exports in Q2 <strong>and</strong> Q3<br />
are to a great measure<br />
the consequence <strong>of</strong> the<br />
deceleration <strong>of</strong> bulky<br />
exports<br />
Current problems<br />
in Europe do not<br />
leave room for better<br />
forecasts for Q4<br />
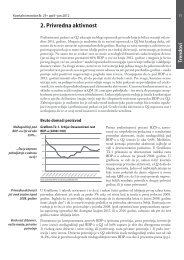
Graph T4-4 shows an evident drop in the value <strong>of</strong> seasonally-adjusted exports from the start<br />
<strong>of</strong> the year. The seasonally-adjusted exports in Q2 compared to Q1 are lower by <strong>4.</strong>1% (15.4% at<br />
annual level), while in Q3 0.9% below the value <strong>of</strong> Q2 (3.6% at annual level). The seasonallyadjusted<br />
value <strong>of</strong> underlying exports (overall exports after the exclusion <strong>of</strong> the bulky exports<br />
component) are showing a slight rise from quarter to quarter (Graph T4-4). Namely, the value<br />
Graph T4-<strong>4.</strong> Serbia: Seasonally-Adjusted<br />
Exports <strong>and</strong> Seasonally-Adjusted Underlying<br />
Exports, by Quarter 2004−2011<br />
millions <strong>of</strong> euros<br />
2400<br />
2200<br />
2000<br />
1800<br />
1600<br />
1400<br />
1200<br />
1000<br />
800<br />
600<br />
400<br />
200<br />
0<br />
Source: SORS, QM<br />
Seasonally adjusted exports<br />
Seasonally adjusted underlying exports<br />
<strong>of</strong> exports monitored in this way in Q2 is 0.6%<br />
over Q1 (2.4% at annual level), while in Q3 it<br />
was 2.1% above Q2 (8.5% at annual level). The<br />
seasonally-adjusted values confirm the fact that<br />
the deceleration <strong>of</strong> exports in Q2 <strong>and</strong> Q3 are to a<br />
great extent the consequence <strong>of</strong> the deceleration<br />
<strong>of</strong> bulky exports.<br />
The current problems in Europe do not leave<br />
room for better forecasts in terms <strong>of</strong> domestic<br />
exports. Namely, if there is a further slowing<br />
down <strong>of</strong> economic activity <strong>and</strong> even a recession<br />
in certain EU countries <strong>and</strong> a deceleration <strong>of</strong><br />
economic activities in neighboring countries,<br />
the consequence could be a pronounced drop in<br />
dem<strong>and</strong> which would have an unfavorable effect<br />
on domestic export results at the end <strong>of</strong> this <strong>and</strong><br />
the start <strong>of</strong> next year.
Quarterly Monitor No. 25-26 • April–September 2011<br />
29<br />
Imports<br />
Imports <strong>of</strong> goods<br />
significantly slows<br />
down since start <strong>of</strong> year<br />
The import <strong>of</strong> goods significantly slowed down since the start <strong>of</strong> the year (Table T4-5). In Q2<br />
goods worth 3,502 million Euro were imported which is 1<strong>4.</strong>2% more than in the same period a<br />
year earlier. In Q3 overall imports stood at 3,538 million Euro <strong>and</strong> 7.7% higher than in the same<br />
period <strong>of</strong> a year earlier.<br />
Table T4-5. Serbia: Imports, Y-o-y Growth Rates, 2010–2011<br />
Imports<br />
share<br />
2010<br />
2011 1) 2010 1) 2011 1)<br />
Q1 Q2 Q3 Q1 Q2 Q3 Q1 Q2 Q3<br />
in% mil.euros y-o-y growth rate (%)<br />
Total 100.0 3,374 3,502 3,538 -5.0 10.4 17.2 2<strong>4.</strong>3 1<strong>4.</strong>2 7.7<br />
Energy 17.8 729 583 545 1.6 61.1 66.6 32.5 7.0 -10.7<br />
Intermediate products 31.1 1,023 1,240 1,197 1.5 15.3 23.2 38.9 29.3 9.8<br />
Capital products 15.8 521 550 573 -22.2 -6.1 1.6 35.0 12.2 8.5<br />
Durable consumer goods 2.8 72 78 83 -7.1 0.3 7.9 -12.7 -<strong>4.</strong>7 -2.2<br />
Non-durable consumer goods 12.7 370 411 444 -2.3 5.7 5.8 7.7 9.4 13.9<br />
Other 19.7 659 640 695 -5.7 -5.2 -0.6 7.2 <strong>4.</strong>0 19.6<br />
Imports excluding energy 82.2 2,645 2,919 2,992 -6.5 3.4 9.7 22.3 15.8 11.9<br />
Source: SORS<br />
1) Figures that are in millions <strong>of</strong> euros <strong>and</strong> y-o-y growth rates were obtained based on the data from Statistical Office <strong>of</strong> the Republic <strong>of</strong> Serbia calculated<br />
using new methodology. For details see QM 20, “Changes to foreign trade methodology used by the Statistical Office <strong>of</strong> the Republic <strong>of</strong> Serbia”.<br />
Trends<br />
Significant deceleration<br />
<strong>of</strong> energy<br />
export growth<br />
...intermediate <strong>and</strong><br />
capital products<br />
Imports <strong>of</strong> non-durable<br />
<strong>and</strong> other products<br />
speed up growth<br />
Seasonally-adjusted<br />
values indicate slow<br />
recovery <strong>of</strong> imports<br />
There is a significant deceleration <strong>of</strong> the growth <strong>of</strong> exports <strong>of</strong> energy in Q2 <strong>and</strong> a y-o-y drop in<br />
Q3 <strong>of</strong> 10.7%. Energy prices on the world market are showing a slight drop over the past few<br />
months but are still at high level. In Q2 <strong>and</strong> Q3 energy prices in Euro were 23.1% <strong>and</strong> 25.3% 18<br />
higher than in Q2 <strong>and</strong> Q3 2010, respectively. The reason for the downward trend in the export <strong>of</strong><br />
energy is solely the drop in imported quantities by 13% in Q2 <strong>and</strong> almost 30% in Q3, monitored<br />
y-o-y. Because <strong>of</strong> that the deceleration <strong>of</strong> energy exports is less pronounced.<br />
The import <strong>of</strong> intermediary products significantly slows growth, leading to the conclusion that a<br />
significant recovery <strong>of</strong> industrial production should not be expected in Q<strong>4.</strong> The imports <strong>of</strong> capital<br />
products in the first three quarters, viewed as a whole, is high. There is an obvious deceleration<br />
<strong>of</strong> growth <strong>of</strong> this group <strong>of</strong> products <strong>and</strong> that explains the real growth <strong>of</strong> investments which has<br />
decelerated rapidly during the year. In addition that, there has been a drop in the imports <strong>of</strong><br />
durable consumer goods in Q2 <strong>and</strong> Q3, <strong>of</strong> <strong>4.</strong>7%, <strong>and</strong> 2.2% (Table T4-5).<br />
A significant y-o-y growth <strong>of</strong> imports was registered in non-durable consumer goods <strong>and</strong><br />
other imports (Table T4-5). Namely, the import <strong>of</strong> those products is growing. Despite the weak<br />
economic activity <strong>and</strong> negative trends in industrial production, private spending in Q2 <strong>and</strong> Q3<br />
was at a solid level.<br />
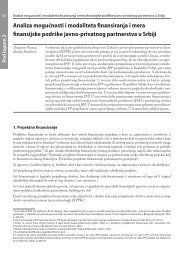
The graph <strong>of</strong> seasonally-adjusted import values (Graph T4-6) shows that the recovery <strong>of</strong> imports<br />
is volatile <strong>and</strong> slow. Namely, since Q2 2009 – when imports first registered growth after the crisis<br />
Graph T4-6. Serbia: Seasonally-Adjusted<br />
Imports, by Quarter, 2007−2011<br />
millions <strong>of</strong> euros<br />
4500<br />
4000<br />
3500<br />
3000<br />
2500<br />
2000<br />
1500<br />
1000<br />
500<br />
0<br />
Source: NBS, SORS, QM<br />
Seasonally adjusted imports<br />
– positive <strong>and</strong> negative inter-quarterly changes<br />
in import values have traded places virtually all<br />
the time. In 2010 following the drop in value<br />
<strong>of</strong> imports in Q4, a growth was registered in<br />
Q1 2011, followed by a drop in value in Q2 <strong>and</strong><br />
growth in Q3 (compared to previous quarters).<br />
That broken up recovery <strong>of</strong> imports led to its<br />
seasonally adjusted value in Q3 2011 is just<br />
29.3% higher than the minimum value on the<br />
graph (Q2 2009). Also, the seasonally-adjusted<br />
imports still have not reached the levels at the<br />
start <strong>of</strong> the crisis <strong>and</strong> are 18.7% lower than the<br />
highest pre-crisis values in Q3 2008. (Graph<br />
T4-6).<br />
18 The rise in energy prices in Euro was eased compared to the growth in Dollars because <strong>of</strong> the weaker Dollar against the Euro. Prices<br />
in Dollars, viewed on y-o-y basis, are higher by 39.3% in Q2, <strong>and</strong> 37.3% in Q3.